REVIEW 4 major objections 5 minor 1 cited by
Be star demographics: a comprehensive study of thousands of lightcurves in the Magellanic Clouds
T0 review · 4 major / 5 minor · reviewed 2026-08-15 · deepseek-v4-flash
Pith's one-line read First population-level measurement of Be star duty cycles: lower-metallicity SMC stars spend more time feeding disks, keep disks almost permanently, and show longer but rarer outbursts.
desk verdict First population-level duty-cycle measurements for Magellanic Cloud Be stars, but the headline metallicity claim does not survive the paper's own mass-matched tests. read the letter →
The pith
A machine-rendered reading of the paper's core claim, the machinery that carries it, and where it could break.
The reading
What carries the argument
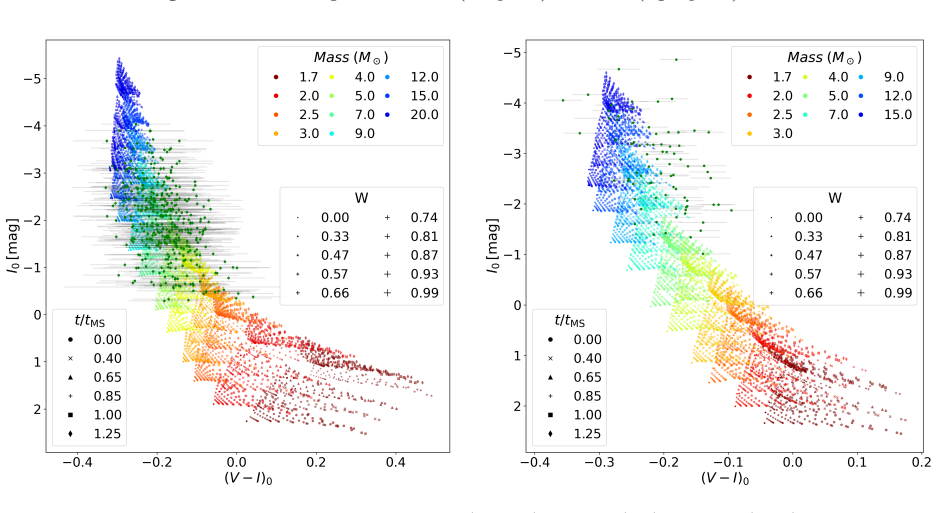
The load-bearing object is the V-I color-magnitude loop: in the viscous decretion disk (VDD) model, a disk event makes a pole-on star brighten and redden while an edge-on star dims with little color change, and the loop's orientation rotates with inclination. That diagnostic was recomputed here in the I band, using the singlebe hydrodynamic code coupled to the hdust radiative-transfer code for one fiducial 12-solar-mass star (rotation rate W = 0.81, viscosity parameter alpha = 1.0) across four feeding times and four base densities. A second grid of diskless, fast-rotating photospheric models at LMC and SMC metallicities converts a dereddened baseline position into an estimate of stellar mass. On top of these, an interactive manual classification assigns each segment of every light curve to one of seven categories (baseline, build-up, dissipation, plateau, isolated build-up, isolated dissipation, unclassified), from which the duty cycle, disk duty cycle, and outburst rate are computed, and published mass-reservoir fitting formulas are applied to isolated events to extract build-up and dissipation durations.
What would settle it
Take the 605 isolated disk events and refit them with dynamical models computed at each star's own mass, rotation, and metallicity instead of the single 12-solar-mass template; if the fitted disk densities and durations no longer reproduce the reported SMC-LMC amplitude and duration gaps, the metallicity conclusion would need revision. A cheaper check is observational: point H-alpha or mid-infrared observations at stars sitting at their I-band baseline, since residual disk emission there would falsify the diskless-baseline premise and push every disk duty cycle upward.
Extended reading notes
Core claim
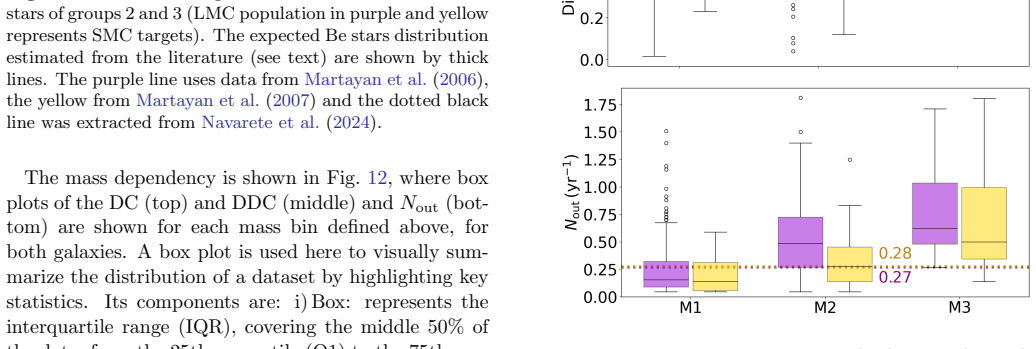
The discovery, stated at population scale, is that Be star activity differs sharply between the two Clouds: among the 1,751 variable Be star candidates, SMC stars spend a median 60% of their time actively feeding a disk versus 44% for LMC stars, both populations keep a detectable disk for essentially the whole observing window (median disk duty cycles of 1.00 and 0.99), and SMC outbursts are longer but less frequent (median 0.26 per year versus 0.31). For 605 isolated disk events, SMC systems reach photometric amplitudes about three times larger and last notably longer (median total duration 645 days versus 407 days), which the authors read as evidence that low-metallicity disks are denser or fed for longer. Within both galaxies, every activity metric grows with stellar mass: the most massive stars show outburst rates about three times those of the least massive, and dissipation outlives build-up by a nearly constant ratio of about 1.5-1.6 that confirms the mass reservoir effect. The authors state that the median duty-cycle, disk duty-cycle, and outburst-rate values are upper limits, since quiet stars were intentionally excluded from the analyzed sample.
Load-bearing premise
The whole analysis rests on the assumption that the brightness-and-color behavior predicted for a single 12-solar-mass model star reliably reveals each real star's orientation and whether it is building or losing a disk, and that a star sitting at its I-band baseline has no disk at all; if either premise fails across the diversity of real LMC and SMC stars, every duty-cycle and outburst statistic inherits the error.
Editorial extensions
If this is right
- The Be state in these samples is near-permanent: a detectable disk exists essentially all of the time, even between mass-ejection episodes, so the disk is closer to a persistent condition than to a transient outburst for these objects.
- Metallicity shapes the entire mass-loss phenomenology, not just the frequency of Be stars: at lower metallicity, stars spend more time feeding disks, build denser disks, and produce longer events.
- Stellar mass drives activity within each galaxy: more massive stars have higher duty cycles, disk duty cycles, and outburst rates, with the outburst rate of the most massive bin about three times that of the least massive.
- Because the sample deliberately excluded quiet stars, the reported medians are upper limits; adding the excluded inactive Be stars would lower the medians but leave the shape of the distributions above the first bin unchanged.
- The near-constant dissipation-to-build-up ratio of about 1.5-1.6 in both galaxies gives population-level support for the mass reservoir effect, in which mass stored in the outer disk slows the fading of the inner disk.
Reading between the lines
- A consequence the paper leaves implicit: the duty-cycle statistics could be inverted into a completeness correction for Be star censuses, since a star is counted as 'Be' only when a disk is present and will be misclassified in a single-epoch survey with probability equal to the complement of its disk duty cycle; with disk duty cycles near unity, the already high SMC Be fraction may be close to the
- A testable extension the paper does not perform: refitting its catalogued isolated events with per-star masses, inclinations, and metallicities could reveal whether the viscosity parameter differs between the Clouds, in which case part of the reported amplitude and duration gap would be a viscous effect rather than a difference in mass-ejection behavior.
- The paper's own caveat that I-band emission traces only the inner disk implies its disk duty-cycle numbers are floor values; H-alpha or mid-infrared follow-up of stars at their photometric baseline would likely show residual outer-disk emission, pushing the effective disk duty cycle even closer to 1.
Signed reviews
Editorial analysis
A structured set of objections, weighed in public.
Referee Report
Summary. The paper analyzes ~2,144 LMC and ~989 SMC OGLE light curves of Be star candidates, manually classifying each light curve into phases (baseline, disk build-up, dissipation, plateau, isolated events) with guidance from viscous decretion disk models. From these classifications the authors define a duty cycle (DC), a disk duty cycle (DDC), an outburst rate (Nout), and, for a subsample with isolated events, build-up and dissipation durations. The central claim is that SMC Be stars are more active: they spend a larger fraction of time in mass-ejection phases (median DC 0.60 vs 0.44 in the LMC), have nearly permanent disks (median DDC 1.0 vs 0.99), and show longer but less frequent outbursts. The paper also reports that all activity diagnostics increase with stellar mass. The analysis is avowedly model-informed and the authors acknowledge several selection biases, including the exclusion of inactive Be stars and the under-representation of low-mass SMC stars.
Significance. If the central claim survives, this is the first population-level measurement of Be star mass-loss duty cycles in the Magellanic Clouds and a unique comparison of disk-activity diagnostics across two metallicities. The dataset is large, the light curves are real OGLE data, and the definitions of DC/DDC/Nout are straightforward, transparent, and easy to reproduce from the phase classifications. The mass determination via MCMC on photospheric models is a standard approach, and the use of KS tests is appropriate. The paper also provides a useful catalog of isolated disk events with durations, which will be valuable for future modeling. The main weakness is that the headline metallicity comparison is confounded by the very different mass distributions of the LMC and SMC samples, a concern that the authors themselves raise in Sect. 7.1 but do not resolve in the quantitative analysis.
major comments (4)
- [Sect. 6.3 and Fig. 12; Sect. 7.4] The central claim that SMC stars are more active than LMC stars is not supported by the mass-matched comparison. The KS tests reported in Fig. 12 show that, within each mass bin, DC differences are not significant (p = 0.36, 0.36, 0.21) and DDC differences are not significant (p = 0.81, 0.47, 0.61). Because Sect. 6.3 demonstrates that DC and DDC increase with stellar mass, and Sect. 7.1 explicitly admits that the SMC subsample is biased toward high-mass stars (median 9.5 Msun vs 6.6 Msun for the LMC), the population-level median differences (0.60 vs 0.44 for DC; 1.0 vs 0.99 for DDC) are likely selection artifacts. The abstract and Sect. 8 currently assert a metallicity dependence without qualifying that the within-mass-bin analysis shows no significant difference; this should be corrected and the mass-matched result should be presented as the primary evidence, or the sample must be reweighted/expanded to remove the confound.
- [Sect. 6.3, Fig. 12] The mass-matched KS tests have limited statistical power because the SMC sample sizes in the mass bins are small (M1: 19, M2: 44, M3: 17), so the null result cannot be taken as evidence that the distributions are actually indistinguishable. The text in Sect. 6.3 says the distributions are 'statistically indistinguishable' for DC and DDC; a more cautious phrasing (e.g., 'no significant difference was detected') is needed, along with a discussion of the power or confidence intervals. Moreover, the mass-matched analysis is restricted to Groups 2 and 3, which constitute only 22% of the SMC Be candidates (Table 7), so the mass-matched subsample may itself not be representative of the full SMC population.
- [Sect. 5 and Sect. 6.1] The manual classification of light curves into seven phase categories is the foundation of every duty cycle and outburst-rate measurement in the paper, yet the manuscript provides no validation of the classification's reliability. No inter-rater agreement test, repeatability check, or systematic comparison of the manual labels with the quantitative fit of Eqs. 5 and 6 (beyond the single example in Fig. 6) is reported. Given that the central demographic results rest entirely on these manual labels, the paper should either provide a reproducibility assessment (e.g., re-classifying a random subset by a second observer) or a sensitivity analysis showing that the headline median differences survive plausible classification uncertainties.
- [Sect. 4.1, Table 2, Fig. 5] The dynamical model grid used to classify stars as pole-on or edge-on and to identify build-up/dissipation phases is computed for a single 12 Msun, LMC-metallicity star with W=0.81 and alpha=1.0, while the sample spans masses from about 3 to 20 Msun and includes SMC (lower-metallicity) stars. The paper itself notes that the V-I loop orientation depends on base density (Sect. 4.1, bottom panel of Fig. 4) and that the intermediate-inclination range produces photometric signals below the detection threshold (Fig. 5), which biases the sample toward extreme inclinations. The authors should either run a small grid of models covering the mass/metallicity range and show that the phase classification is robust, or explicitly state which conclusions are insensitive to this modeling choice. This is a correctness-risk concern, not a circularity argument, but it is load-bearing because the phase labels determine all of DC, DDC, and Nout.
minor comments (5)
- [Abstract and Sect. 8] The abstract's phrase 'strong statistical differences' refers to the full-sample KS tests, but the mass-matched tests (Fig. 12) are the more relevant comparison for the metallicity claim; the abstract should be reworded to reflect the qualified nature of the result.
- [Sect. 6.1, Figs. 8 and 9] The KS test p-values are denoted by the symbol ρ (rho), which is unconventional and could be confused with a correlation coefficient; the paper should use 'p' or 'p-value' throughout.
- [Sect. 6.2] The text says the mass was determined for 468 stars in Groups 2 and 3, but the earlier statement that Groups 2 and 3 contain 816 stars may confuse readers; a sentence clarifying that mass determination required two-band photometry (V and I, or B and I) and thus was possible for only 468 of the 816 would improve clarity.
- [Sect. 6.3] The sentence listing the mass-bin counts ('217, 151, 20 (LMC) 19, 44 and 17') is hard to parse; a table or a clearer format (e.g., 'LMC: 217, 151, 20; SMC: 19, 44, 17') would be an improvement.
- [Sect. 7.2] The discussion of DDC biases is honest and useful, but the conclusion that 'the disk is present for most of the observational period' (Sect. 8) should explicitly carry the caveat that this is an upper limit affected by the activity selection and a lower limit affected by the I-band detection of the inner disk only; the current text in Sect. 8 does not fully convey this tension.
Circularity Check
Two secondary results reduce by construction: DDC≈1 is forced for Group 1 by Eq. 3, and the tb–td correlation/MRE confirmation is imprinted by the Rimulo et al. fitting formulas adopted by citation; the headline SMC-vs-LMC duty-cycle comparison is not definitionally circular.
-
self definitional
[Sect. 5, Eq. 3; Group 1 definition; Table 7; abstract DDC claim]
"DDC = Σtdisk/(ttot−tunc), where Σtdisk is the total time spent in phases where a disk is present, which includes all categories except baseline and unclassified. ... Group 1: Lightcurves without a baseline phase."
For Group 1 there is no baseline phase, so every non-unclassified time is a disk-present phase: Σtdisk = ttot − tunc, and Eq. 3 forces DDC = 1. Table 7 shows Group 1 contains 935 of 1751 stars (53%), including 78% of the SMC sample. The paper's abstract-level statement that DDC medians of 0.99/1.00 indicate 'disks are almost always present' is therefore a restatement of the Group 1 label ('no baseline observed') rather than an independent empirical measurement.
-
ansatz smuggled in via citation
[Sect. 5 (Eqs. 5-6); Sect. 7.3; Conclusions]
"we adopted the formulae derived by Rımulo et al. ... ΔId(t) = ΔIb(tD)×[1/(1+[Cd(t−tD)]^ηd)] ... A clear correlation between the build-up and dissipation times is evident in our data... This underscores the mass reservoir effect (MRE) described earlier."
Eq. 6 anchors the dissipation light curve to ΔIb(tD), which via Eq. 5 is a monotonically increasing function of the build-up duration tb for fixed rate coefficients; the fitted time td to decline to the detection threshold likewise grows with that amplitude. The tb–td correlation presented in Fig. 14 and then cited as 'confirming' the MRE is thus an output of the adopted fitting family from the authors' own prior Rimulo et al. work, not an independent test of that same prior result. The free coefficients allow scatter, but the positive correlation is built into the functional form.
full rationale
The main duty-cycle pipeline is not circular: DC, DDC, and Nout are simple time fractions of manually assigned light-curve phases (Eqs. 2-4), and the LMC/SMC DC difference (0.44 vs 0.60) is a direct measurement, not a fitted equation. Mass estimates come from an MCMC fit of baseline photometry to an independent diskless stellar grid, and the inclination interpretation rests on externally validated VDD/hdust modeling. The circularity is confined to two secondary claims. First, the 'disk duty cycle ≈ 1' result is definitional for the 53% of the sample in Group 1: because these light curves lack a baseline, Eq. 3 gives DDC=1 by construction, so the high DDC medians largely restate the Group 1 selection criterion rather than independently demonstrating that disks are almost always present. Second, the build-up/dissipation correlation used to 'confirm' the mass reservoir effect is obtained by fitting the very functional forms (Eqs. 5-6) adopted from the authors' prior Rimulo et al. work, and Eq. 6 makes the fitted dissipation time depend directly on the build-up amplitude, so the correlation is partly imprinted by the ansatz. The headline metallicity-vs-duty-cycle assertion is confounded by the known mass and activity selection bias (a correctness concern), but that is not a circularity. Overall, the central claim retains independent measured content, so the score is moderate rather than severe.
Assumptions & free parameters
free parameters (4)
- Cbu and Cd (rate coefficients in Eqs. 5 and 6) =
free per event, not tabulated
- eta_bu = 0.8 and eta_d = 1.4 =
0.8, 1.4
- Detection threshold for disk events =
0.06 mag
- Dynamical model calibrator star and grid =
M=12 Msun, W=0.81, alpha=1.0; tb = 60,180,600,1800 d; Sigma0 = 0.12,0.69,1.67,4.00 g/cm2
assumptions (7)
- domain assumption Viscous Decretion Disk theory, including inside-out growth/dissipation and the mass reservoir effect, describes Be disk photometric variability.
- domain assumption singlebe + hdust isothermal thin-disk models with alpha=1.0 reproduce I-band light curve shapes.
- ad hoc to paper The I-band photometric baseline corresponds to a diskless star.
- domain assumption Diskless fast-rotating photospheric models with Kurucz spectra give reliable BVI colors and magnitudes.
- domain assumption The OGLE color/magnitude candidate samples of Mennickent et al. 2002 and Sabogal et al. 2005 are representative Be star parent samples.
- domain assumption Reddening maps of Skowron et al. 2021 and adopted distance moduli are accurate.
- standard math Kolmogorov-Smirnov tests are appropriate for comparing the sample distributions.
Cite this review
Pith. "Pith review of Be star demographics: a comprehensive study of thousands of lightcurves in the Magellanic Clouds." pith.science (2026). https://pith.science/paper/CP66ZQ2J
@misc{pith2026250508714,
  author       = {Pith},
  title        = {Pith review of: Be star demographics: a comprehensive study of thousands of lightcurves in the Magellanic Clouds},
  year         = {2026},
  howpublished = {\url{https://pith.science/paper/CP66ZQ2J}},
  note         = {Machine review of arXiv:2505.08714}
}
read the original abstract
Multi-color OGLE survey light curves of about 20 years duration are analyzed for about 3000 classical Be stars in the Large and Small Magellanic Clouds (LMC, SMC) in order to study the properties and variability. Each light curve was manually analyzed to distinguish between different scenarios, such as photospheric baseline levels, and disk build-up and dissipation phases. This analysis was aided by dynamical disk models and photospheric models to coarsely determine inclination angle and mass. Measured quantities such as the fraction of time spent actively ejecting mass (the duty cycle), the fraction of time spent with a detectable disk (the disk duty cycle), the build-up and dissipation time of isolated disk events, and the number of mass outbursts per year allow us to characterize and compare the behavior of the two populations. There is a wide spread in the duty cycle, with median values of 0.44 (LMC) and 0.60 (SMC). The disk duty cycle is high for both populations, with median values of 0.99 (LMC) and 1.0 (SMC), indicating that disks are almost always present for these stars. The occurrence rate of outbursts ranges from zero to about two per year, with median values of 0.31 (LMC) and 0.26 (SMC). There are strong statistical differences in the behavior of the LMC and SMC populations, with the lower metallicity stars being more active in terms of their duty cycle and disk duty cycle, and with less frequent but longer lasting outbursts.
Figures


Figures from the paper (13 more)





Forward citations
Cited by 1 Pith paper
-
A multi-epoch spectral and photometric study to understand the nature of the interesting Be star candidate HD 249179
HD 249179, previously cataloged as a possible X-ray binary, shows H-alpha, Paschen, and O I emission, weak V/R changes, two pulsation frequency groups, and no detected X-rays, pointing to a classical Be star with an a...
Reference graph
Works this paper leans on
-
[1]
, " * write output.state after.block = add.period write newline
ENTRY address archivePrefix author booktitle chapter doi edition editor eprint howpublished institution journal key month number organization pages publisher school series title misctitle type volume year version url label extra.label sort.label short.list INTEGERS output.state before.all mid.sentence after.sentence after.block FUNCTION init.state.consts ...
-
[2]
write newline
" write newline "" before.all 'output.state := FUNCTION format.url url empty "" new.block "" url * "" * if FUNCTION format.eprint eprint empty "" archivePrefix empty "" archivePrefix "arXiv" = new.block " " eprint * " " * new.block " " eprint * " " * if if if FUNCTION format.doi doi empty "" " " doi * " " * if FUNCTION format.pid doi empty eprint empty ur...
-
[3]
- [1] #1 = = ^ ^ ^ .\!\!^ d .\!\!^ h .\!\!^ m .\!\!^ s .\!\!^ @mss
thebibliography [1] 20pt to REFERENCES 6pt =0pt -12pt 10pt plus 3pt =0pt =0pt =1pt plus 1pt =0pt =0pt -12pt =13pt plus 1pt =20pt =13pt plus 1pt \@M =10000 =-1.0em =0pt =0pt 0pt =0pt =1.0em @enumiv\@empty 10000 10000 `\.\@m \@noitemerr \@latex@warning Empty `thebibliography' environment \@ifnextchar \@reference \@latexerr Missing key on reference command E...
2021
-
[4]
Alcock , C., Allsman , R. A., Alves , D., et al. 1997, , 486, 697, 10.1086/304535
doi:10.1086/304535 1997
-
[5]
Arcos , C., Jones , C. E., Sigut , T. A. A., Kanaan , S., & Cur \'e , M. 2017, , 842, 48, 10.3847/1538-4357/aa6f5f
-
[6]
1993, , 365, 623, 10.1038/365623a0
Aubourg , E., Bareyre , P., Br \'e hin , S., et al. 1993, , 365, 623, 10.1038/365623a0
doi:10.1038/365623a0 1993
-
[7]
2016, , 588, A56, 10.1051/0004-6361/201528026
Baade , D., Rivinius , T., Pigulski , A., et al. 2016, , 588, A56, 10.1051/0004-6361/201528026
-
[8]
2018, , 479, 2909, 10.1093/mnras/sty1320
Bernhard , K., Otero , S., H \"u mmerich , S., et al. 2018, , 479, 2909, 10.1093/mnras/sty1320
Show all 67 references
-
[9]
E., & Carciofi , A
Bjorkman , J. E., & Carciofi , A. C. 2005, in Astronomical Society of the Pacific Conference Series, Vol. 337, The Nature and Evolution of Disks Around Hot Stars, ed. R. Ignace & K. G. Gayley , 75
2005
-
[10]
Carciofi , A. C. 2011, in IAU Symposium, Vol. 272, Active OB Stars: Structure, Evolution, Mass Loss, and Critical Limits, ed. C. Neiner , G. Wade , G. Meynet , & G. Peters , 325--336, 10.1017/S1743921311010738
2011 doi
- [11]
- [12]
-
[13]
C., Miroshnichenko , A
Carciofi , A. C., Miroshnichenko , A. S., Kusakin , A. V., et al. 2006, , 652, 1617, 10.1086/507935
2006 doi
-
[14]
D., Whelan , D
Chojnowski , S. D., Whelan , D. G., Wisniewski , J. P., et al. 2015, , 149, 7, 10.1088/0004-6256/149/1/7
2015 doi
-
[15]
A., & Marang , F
Cuypers , J., Balona , L. A., & Marang , F. 1989, , 81, 151
1989
-
[16]
W., Lang , D., & Goodman , J
Foreman-Mackey , D., Hogg , D. W., Lang , D., & Goodman , J. 2013, , 125, 306, 10.1086/670067
2013 doi
-
[17]
2013, , 553, A24, 10.1051/0004-6361/201220558
Georgy , C., Ekstr \"o m , S., Granada , A., et al. 2013, , 553, A24, 10.1051/0004-6361/201220558
2013 doi
-
[19]
2021 b , , 909, 149, 10.3847/1538-4357/abdd1e
---. 2021 b , , 909, 149, 10.3847/1538-4357/abdd1e
2021 doi
-
[20]
R., Jones , C
Ghoreyshi , M. R., Jones , C. E., Carciofi , A. C., et al. 2024, , 533, 2867, 10.1093/mnras/stae1950
2024 doi
-
[21]
R., Carciofi , A
Ghoreyshi , M. R., Carciofi , A. C., R \' mulo , L. R., et al. 2018, , 479, 2214, 10.1093/mnras/sty1577
2018 doi
-
[22]
B., et al
Graczyk , D., Pietrzy \'n ski , G., Thompson , I. B., et al. 2020, , 904, 13, 10.3847/1538-4357/abbb2b
2020 doi
-
[23]
M., et al
Gutierrez-Soto , J., Neiner , C., Hubert , A. M., et al. 2008, Communications in Asteroseismology, 157, 70
2008
-
[24]
1983, Hvar Observatory Bulletin, 7, 55
Harmanec , P. 1983, Hvar Observatory Bulletin, 7, 55
1983
-
[25]
C., Rivinius , T., Okazaki , A
Haubois , X., Carciofi , A. C., Rivinius , T., Okazaki , A. T., & Bjorkman , J. E. 2012, , 756, 156, 10.1088/0004-637X/756/2/156
2012 doi
-
[26]
2024, , 682, A59, 10.1051/0004-6361/202347911
Jian , M., Matsunaga , N., Jiang , B., Yuan , H., & Zhang , R. 2024, , 682, A59, 10.1051/0004-6361/202347911
2024 doi
-
[27]
E., Sigut , T
Jones , C. E., Sigut , T. A. A., & Porter , J. M. 2008, , 386, 1922, 10.1111/j.1365-2966.2008.13206.x
2008
-
[28]
D., Owocki , S., & Sundqvist , J
Kee , N. D., Owocki , S., & Sundqvist , J. O. 2016, , 458, 2323, 10.1093/mnras/stw471
2016 doi
-
[29]
C., Bessell , M
Keller , S. C., Bessell , M. S., Cook , K. H., Geha , M., & Syphers , D. 2002, , 124, 2039, 10.1086/342548
2002 doi
-
[30]
C., Rivinius , T., et al
Klement , R., Carciofi , A. C., Rivinius , T., et al. 2015, , 584, A85, 10.1051/0004-6361/201526535
2015 doi
-
[31]
2001, , 322, 231, 10.1046/j.1365-8711.2001.04022.x
Kroupa , P. 2001, , 322, 231, 10.1046/j.1365-8711.2001.04022.x
2001
-
[32]
C., Henrique de Amorim , T., et al
Labadie-Bartz , J., Carciofi , A. C., Henrique de Amorim , T., et al. 2022, , 163, 226, 10.3847/1538-3881/ac5abd
2022 doi
-
[33]
V., et al
Labadie-Bartz , J., Pepper , J., McSwain , M. V., et al. 2017, , 153, 252, 10.3847/1538-3881/aa6396
2017 doi
-
[34]
D., Whelan , D
Labadie-Bartz , J., Chojnowski , S. D., Whelan , D. G., et al. 2018, , 155, 53, 10.3847/1538-3881/aa9c7e
2018 doi
-
[35]
1991, , 250, 432, 10.1093/mnras/250.2.432
Lee , U., Osaki , Y., & Saio , H. 1991, , 250, 432, 10.1093/mnras/250.2.432
1991 doi
-
[36]
2001, , 373, 555, 10.1051/0004-6361:20010596
Maeder , A., & Meynet , G. 2001, , 373, 555, 10.1051/0004-6361:20010596
2001 doi
-
[37]
C., Jones , C
Marr , K. C., Jones , C. E., Carciofi , A. C., et al. 2021, , 912, 76, 10.3847/1538-4357/abed4c
2021 doi
-
[38]
2010, , 509, A11, 10.1051/0004-6361/200911672
Martayan , C., Baade , D., & Fabregat , J. 2010, , 509, A11, 10.1051/0004-6361/200911672
2010 doi
-
[39]
M., et al
Martayan , C., Fr \'e mat , Y., Hubert , A. M., et al. 2006, , 452, 273, 10.1051/0004-6361:20053859
2006 doi
-
[40]
2007, , 462, 683, 10.1051/0004-6361:20065076
Martayan , C., Fr \'e mat , Y., Hubert , A.-M., et al. 2007, , 462, 683, 10.1051/0004-6361:20065076
2007 doi
-
[41]
V., Huang , W., & Gies , D
McSwain , M. V., Huang , W., & Gies , D. R. 2009, , 700, 1216, 10.1088/0004-637X/700/2/1216
2009 doi
-
[42]
E., Pietrzy \'n ski , G., Gieren , W., & Szewczyk , O
Mennickent , R. E., Pietrzy \'n ski , G., Gieren , W., & Szewczyk , O. 2002, , 393, 887, 10.1051/0004-6361:20020916
2002 doi
-
[43]
2000, , 361, 101
Meynet , G., & Maeder , A. 2000, , 361, 101
2000
-
[44]
C., & Figueiredo , A
Navarete , F., Ticiani dos Santos , P., Carciofi , A. C., & Figueiredo , A. L. 2024, , 970, 113, 10.3847/1538-4357/ad500f
2024 doi
-
[45]
Okazaki , A. T. 2001, , 53, 119, 10.1093/pasj/53.1.119
2001 doi
-
[46]
Okazaki , A. T. 2007, in Astronomical Society of the Pacific Conference Series, Vol. 361, Active OB-Stars: Laboratories for Stellare and Circumstellar Physics, ed. A. T. Okazaki , S. P. Owocki , & S. Stefl , 230
2007
-
[47]
2006, in Astronomical Society of the Pacific Conference Series, Vol
Owocki , S. 2006, in Astronomical Society of the Pacific Conference Series, Vol. 355, Stars with the B[e] Phenomenon, ed. M. Kraus & A. S. Miroshnichenko , 219
2006
- [48]
-
[49]
W., DePoy , D
Pepper , J., Pogge , R. W., DePoy , D. L., et al. 2007, , 119, 923, 10.1086/521836
2007 doi
-
[50]
2013, , 495, 76, 10.1038/nature11878
Pietrzy \'n ski , G., Graczyk , D., Gieren , W., et al. 2013, , 495, 76, 10.1038/nature11878
2013 doi
- [51]
-
[52]
Pringle , J. E. 1981, , 19, 137, 10.1146/annurev.aa.19.090181.001033
1981
-
[53]
R., Carciofi , A
R \' mulo , L. R., Carciofi , A. C., Vieira , R. G., et al. 2018, , 476, 3555, 10.1093/mnras/sty431
2018 doi
-
[54]
Rivinius , T., Baade , D., & Carciofi , A. C. 2016, , 593, A106, 10.1051/0004-6361/201628411
2016 doi
-
[55]
C., & Martayan , C
Rivinius , T., Carciofi , A. C., & Martayan , C. 2013, , 21, 69, 10.1007/s00159-013-0069-0
2013 doi
-
[56]
P., Whitney , B
Robitaille , T. P., Whitney , B. A., Indebetouw , R., & Wood , K. 2007, , 169, 328, 10.1086/512039
2007 doi
-
[57]
C., Carciofi , A
Rubio , A. C., Carciofi , A. C., Ticiani , P., et al. 2023, , 526, 3007, 10.1093/mnras/stad2652
2023 doi
-
[58]
E., Mennickent , R
Sabogal , B. E., Mennickent , R. E., Pietrzy \'n ski , G., & Gieren , W. 2005, , 361, 1055, 10.1111/j.1365-2966.2005.09261.x
2005
-
[59]
I., & Sunyaev , R
Shakura , N. I., & Sunyaev , R. A. 1973, , 24, 337
1973
-
[60]
Sigut , T. A. A., & Patel , P. 2013, , 765, 41, 10.1088/0004-637X/765/1/41
2013 doi
-
[61]
M., Skowron , J., Udalski , A., et al
Skowron , D. M., Skowron , J., Udalski , A., et al. 2021, , 252, 23, 10.3847/1538-4365/abcb81
2021 doi
-
[62]
R., & Schaefer , G
Touhami , Y., Gies , D. R., & Schaefer , G. H. 2011, , 729, 17, 10.1088/0004-637X/729/1/17
2011 doi
-
[63]
1997, , 47, 319
Udalski , A., Kubiak , M., & Szymanski , M. 1997, , 47, 319
1997
-
[64]
1992, , 42, 253
Udalski , A., Szymanski , M., Kaluzny , J., Kubiak , M., & Mateo , M. 1992, , 42, 253
1992
-
[65]
K., & Szyma \'n ski , G
Udalski , A., Szyma \'n ski , M. K., & Szyma \'n ski , G. 2015, , 65, 1. 1504.05966
2015 arXiv
-
[66]
K., et al
Udalski , A., Soszy \'n ski , I., Szyma \'n ski , M. K., et al. 2008, , 58, 329
2008
-
[67]
G., Carciofi , A
Vieira , R. G., Carciofi , A. C., & Bjorkman , J. E. 2015, , 454, 2107, 10.1093/mnras/stv2074
2015 doi
-
[68]
G., Carciofi , A
Vieira , R. G., Carciofi , A. C., Bjorkman , J. E., et al. 2017, , 464, 3071, 10.1093/mnras/stw2542
2017 doi
Reviewed August 15, 2026 · model on record in the stance chip above.
Discussion (0). Continue with ORCID to comment.