REVIEW 4 major objections 5 minor 7 references
Galaxy And Mass Assembly: A new approach to quantifying dust in galaxies
T0 review · 4 major / 5 minor · reviewed 2026-08-15 · deepseek-v4-flash
Pith's one-line read Two new parameters combining the Balmer decrement with dust mass quantify dust geometry, and support the maximal foreground screen model for starburst galaxies.
desk verdict Fdust and Hdust are genuinely new dust diagnostics with real empirical correlations, but the headline foreground-screen interpretation is partly built into Fdust's definition and needs validation before the strong claims can stand. read the letter →
The pith
A machine-rendered reading of the paper's core claim, the machinery that carries it, and where it could break.
The reading
What carries the argument
The two named parameters carry the argument. $F_{\rm dust}$ is the normalised vertical position of a galaxy between the Case B line and an empirical upper envelope, $\log {\rm BD}_{\rm Env} = 0.185\log M_d - 0.481$ (with a surface-density version using $\log {\rm BD}_{\rm Env} = 0.459\log \Sigma_{M_d} - 1.801$). $H_{\rm dust}=10^{1.0508}M_d/{\rm BD}^{2.303}$ is the dust mass normalised by the Balmer optical depth, equivalent to $M_d/10^{\tau_B^l}$ for a foreground screen. The associated H$\alpha$ deficit and FUV deficit ratios, $L_{\rm FIR}/L_{{\rm H}\alpha}$ and $L_{\rm FIR}/L_{\rm FUV}$, are the independent probes of optically thick dust used to validate both parameters.
What would settle it
Deeper H$\beta$ observations at high dust mass would settle it: if the apparent upper envelope in the BD--$M_d$ plane fills in as faint H$\beta$ lines are recovered, $F_{\rm dust}$ is measuring incompleteness rather than geometry. A second check is to replace the empirical envelope with one predicted by a clumpy interstellar medium model; if that model reproduces the envelope and still puts high-sSFR galaxies at $F_{\rm dust}\approx 1$, the foreground screen interpretation is not unique.
Extended reading notes
Core claim
The central claim is that combining the Balmer decrement (BD) with dust mass ($M_d$) yields two diagnostics that separately trace dust geometry and optical depth. $F_{\rm dust}$ places a galaxy between the Case B line, where BD = 2.86 and there is no obscuration, and a fitted upper envelope in the BD--$M_d$ plane, so $F_{\rm dust}=1$ corresponds to a maximal foreground screen and $F_{\rm dust}=0$ to maximal distributed dust. $H_{\rm dust}=M_d/10^{\tau_B^l}$ normalises the dust mass by the Balmer optical depth, making it a tracer of the quantity of optically thick dust. The paper establishes that these parameters correlate with H$\alpha$ and FUV deficits relative to far-infrared emission, and that high specific star formation selects galaxies with $F_{\rm dust}$ near 1, supporting the maximal foreground screen model for starbursts.
Load-bearing premise
The load-bearing premise is that the fitted upper envelope in the BD--$M_d$ plane marks where a foreground screen geometry sits; if the envelope actually comes from sample selection, incompleteness, or a clumpy dust geometry with varying covering fraction, then the geometric meaning of $F_{\rm dust}$ and the starburst conclusion no longer follow.
Editorial extensions
If this is right
- Surveys can now estimate dust geometry from quantities they already measure (BD, $M_d$, and FIR luminosity), without resolved imaging or radiative-transfer fitting.
- The $H_{\rm dust}$--H$\alpha$ deficit correlation identifies galaxies in which standard obscuration corrections still leave H$\alpha$-based star formation rates underestimated because some Balmer emission is entirely absorbed.
- The rise of $F_{\rm dust}$ with SFR and sSFR, at fixed stellar mass, supports applying starburst-style foreground screen attenuation corrections to the most actively star-forming galaxies.
- The consistency of the $H_{\rm dust}$ relation across four mass-limited redshift bins out to $z\approx0.35$ indicates the connection between optically thick dust and geometry does not evolve strongly over that range.
Reading between the lines
- A direct extension would be to construct the same BD--$M_d$ plane with dust masses from other SED tools or from long-wavelength dust emission; if the envelope slope changes, $F_{\rm dust}$ must be recalibrated for those samples.
- Comparing the empirical envelope with radiative-transfer models of clumpy, fractal dust would test whether the 'distributed' corner of the diagram is really one geometry or a family of covering fractions; this is a testable prediction the paper does not make.
- Because the Balmer lines cannot see the most optically thick regions, combining $F_{\rm dust}$ and $H_{\rm dust}$ with radio or mid-infrared SFR tracers could put a quantitative upper limit on the star formation hidden from optical surveys.
- Applied to spatially resolved observations, these metrics could be computed per pixel or per H II region, connecting global dust geometry to local covering fraction and column density.
Signed reviews
Editorial analysis
A structured set of objections, weighed in public.
Referee Report
Summary. The paper analyzes 842 star-forming galaxies from the GAMA survey to introduce two dust-geometry diagnostics built from the Balmer decrement (BD) and dust mass (Md). The first parameter, Fdust (Eq. 17), measures the vertical position of a galaxy's BD between the Case B value (2.86) and an empirically fitted upper envelope in the BD–Md plane (Eq. 7); it is interpreted as the relative contribution of foreground-screen versus distributed dust geometry, with Fdust=1 called a 'maximal foreground screen.' The second, Hdust (Eq. 18), is defined as Md divided by 10^tau_B, i.e., the dust mass normalized by the Balmer optical depth, and is interpreted as a tracer of optically thick dust. The authors show that Hdust correlates with Halpha and FUV deficits (LFIR/LHalpha and LFIR/LFUV), that Fdust correlates with SFR and sSFR, and that Fdust is largely independent of stellar mass. They conclude that high-sSFR (starburst) galaxies favor a maximal foreground-screen dust geometry and that the diagnostics are sensitive probes of dust geometry. The paper is explicit that 'foreground screen' and 'distributed dust' are convenient descriptors rather than literal physical regimes.
Significance. If the envelope identification is valid, the paper offers two simple observational diagnostics that combine information from two widely available quantities, BD and Md. Hdust is cleanly defined and correlates with independent indicators of optical depth (r=0.64 for Halpha deficit and r=0.52 for FUV deficit), while Fdust removes the stellar-mass dependence seen in Hdust and correlates with sSFR. The paper uses public GAMA data, gives transparent equations with standard calibrations, checks that the results are insensitive to inclination, and verifies the Hdust–Halpha deficit trend across four mass-limited redshift bins. However, the physical interpretation of Fdust as a geometry indicator rests on an empirical envelope whose identification as the foreground-screen locus is not independently tested, and the sSFR–Fdust correlation may be partly a consequence of the parameter definition rather than a geometric effect. The central claim is therefore conditional on additional validation.
major comments (4)
- [Section 2.2, Eq. (7)] The central assumption that the empirical upper envelope in the BD–Md plane traces the foreground-screen sequence is load-bearing but not quantitatively tested. The paper states that the envelope 'traces the BD values resulting from a foreground screen geometry' without giving fit uncertainties for the slope and intercept in Eqs. (7) and (8), and without comparing the envelope to a radiative-transfer or analytic screen model that predicts BD as a function of Md. Because Fdust in Eq. (17) is normalized by this same envelope, the later claim that high-sSFR galaxies have Fdust near unity partly restates the fitted envelope. I ask the authors to (i) report uncertainties on the envelope parameters, (ii) test the screen identification against a simple screen model with assumed dust properties, and (iii) assess whether sample incompleteness or MAGPHYS Md systematics could produce the envelope. The manuscript's own caveat that 'such envelopes may differ quantitatively' for different samples or Md estimators makes this validation necessary, not optional.
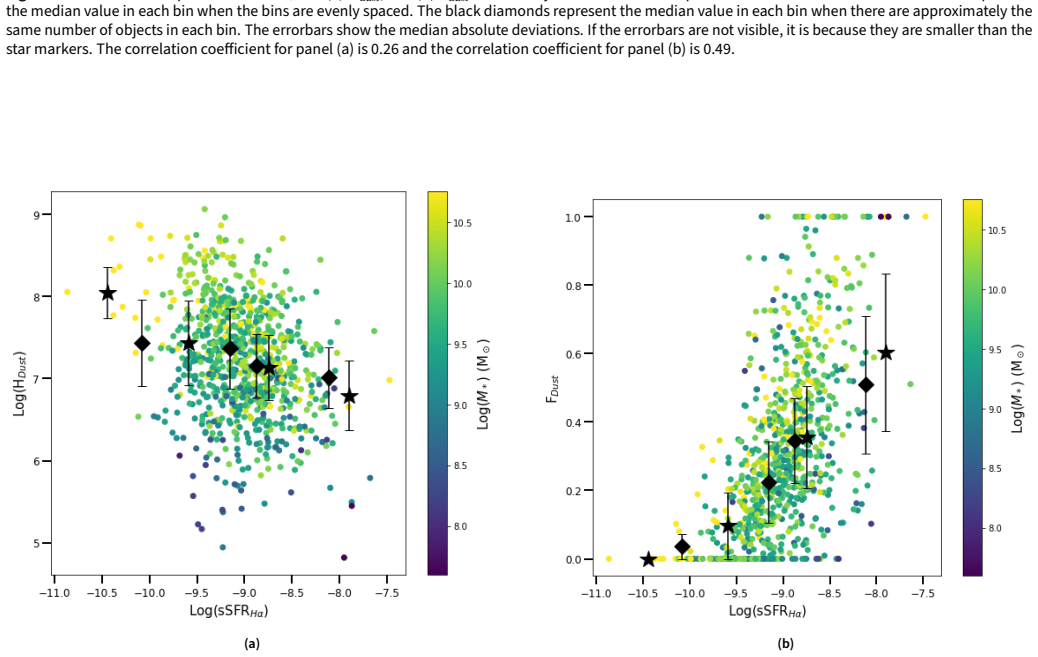
- [Section 4, Eq. (17)] The denominator of Fdust, log(BDEnv/2.86), becomes small at the low-Md end of the sample because the envelope slope is shallow (0.185 in Eq. 7). For example, at log Md ~ 6, a modest BD of about 4 already yields Fdust near 0.8. If high-sSFR galaxies preferentially have lower stellar masses and hence lower dust masses, the apparent Fdust–sSFR correlation in Figure 17b could be driven by this normalization rather than by a change in dust geometry. The authors should demonstrate that the trend persists when Fdust is examined in narrow Md bins, or should redefine Fdust with a denominator computed from the envelope uncertainty and show that the sSFR trend is not an artifact of the low-Md leverage.
- [Section 4, Fdust definition] The paper clips Fdust to 1 for galaxies above the envelope and to 0 for galaxies below the Case B line, but it does not report how many galaxies are affected. If a non-negligible fraction of the sample is clipped, the pile-up at Fdust=1 can artificially enhance the apparent concentration of high-sSFR galaxies at the maximal foreground-screen value. The authors should state the clipped fractions and repeat the key trends (Figures 16b and 17b) with the clipping removed or with a rank-based estimator to show that the conclusions do not depend on this censoring.
- [Section 4, Fig. 9] Figure 9 is used to argue that low-BD, high-Hdust galaxies are not consistent with a foreground screen, which is a useful negative test. However, no equivalent positive test establishes that galaxies near the envelope are actually screen-like. In fact, Figure 9 shows essentially no correlation between BD and SigmaMd (r=0.013), which is not obviously consistent with the interpretation that the envelope in the BD–Md plane is the screen sequence. The authors should quantify the BD–SigmaMd relation for galaxies near the envelope, or model the expected scatter in that relation under the screen hypothesis, to reconcile the screen interpretation with the absence of a global BD–SigmaMd correlation.
minor comments (5)
- [Section 3, Eq. (14)] Equation (14) appears to be missing a division operator between 0.44 log(BD) and 0.4(k(Hbeta)-k(Halpha)); please correct the typesetting so the formula is unambiguous.
- [Section 4, Halpha deficit definition] The 'Halpha deficit' is introduced verbally as the ratio of FIR luminosity to the BD-corrected Halpha luminosity, but Eq. (16) only defines LFIR. Please give the explicit expression for the deficit, including which Halpha luminosity is used and how the BD enters.
- [Tables/Figures, correlation coefficients] The correlation coefficients quoted in the text and figures are reported without uncertainties or sample-size information. For example, the r=0.596 value in Figure 17b is used to support a central claim; please provide uncertainties (e.g., bootstrap or jackknife) and the number of objects in each bin.
- [Section 2.1, sample selection] The FIR signal-to-noise threshold of S/N >= 1 is unusually low and may introduce noisy FIR fluxes. Please discuss how this threshold affects the LFIR-based deficits and whether the results are stable if only FIR S/N >= 3 objects are used.
- [General] The abstract states that the diagnostics 'demonstrate' support for the maximal foreground screen model, but the body of the paper appropriately hedges that the terms are convenient descriptors. Please align the abstract with the more cautious language used in Section 4.
Circularity Check
Fdust's 'maximal foreground screen' label is assigned to the fitted envelope, so the starburst-support conclusion is partly built into the parameter definition.
-
fitted input called prediction
[Section 2.2 (Eq. 7), Section 4 (Eq. 17), Section 6 (Fig. 17b discussion)]
"In the case of Figure 2a this envelope traces the BD values resulting from a foreground screen geometry as the optical depth of the screen increases. ... Fdust is calculated as Fdust = log BD – log(2.86) / log BDEnv – log(2.86) (17) where BDEnv is the BD value at the envelope line from Figure 2a (Equation 7). ... A value of Fdust = 1 may be referred to as a 'maximal foreground screen' geometry, and Fdust = 0 as a 'maximal distributed dust' geometry."
Fdust is defined as the vertical position of BD between the Case B value (2.86) and the empirically fitted upper envelope BDEnv (Eq. 7), and the same passage labels Fdust=1 'maximal foreground screen.' The abstract's claim that starburst galaxies support the maximal foreground screen model therefore reduces to saying that high-sSFR galaxies lie near the fitted envelope. The envelope is an empirical characterisation fitted to the same BD-Md dataset, and the paper itself warns it may differ for other samples or Md estimators; thus the physical label 'foreground screen' is assigned to the fit by construction rather than derived from an independent geometry test.
full rationale
The central circularity is localized to Fdust. Equation 17 normalizes BD by an envelope (Eq. 7) fitted to the same BD-Md data, and Fdust=1 is then named 'maximal foreground screen.' Consequently, the headline conclusion that high-sSFR galaxies support the maximal foreground screen model is a restatement of the fact that those galaxies lie near the fitted envelope, with the geometry label imposed by definition. The paper's Fig. 9 provides a separate, non-circular empirical argument that high-Hdust galaxies are better described by distributed dust, and the authors explicitly address the shared-BD concern in the Hα-deficit correlation by stating it persists with uncorrected Hα luminosities. Hdust is definitionally related to the foreground-screen attenuation factor, but it is not the main source of the headline circularity. No load-bearing self-citation or imported uniqueness theorem was found. Because the underlying data correlation is real but the physical interpretation of the central diagnostic is assigned by construction, the overall circularity score is 6.
Assumptions & free parameters
free parameters (3)
- BD-Md envelope slope and intercept =
0.185, -0.481 (Eq. 7)
- BD-SigmaMd envelope slope and intercept =
0.459, -1.801 (Eq. 8)
- Stellar absorption equivalent width EWc =
2.5 Angstrom
assumptions (4)
- domain assumption The Balmer decrement is sensitive only to optically thin dust along the line of sight, while Md traces the total dust content including optically thick regions.
- ad hoc to paper The upper envelope of the BD-Md diagram traces a foreground screen geometry with increasing optical depth.
- domain assumption The intrinsic Case B Balmer decrement Halpha/Hbeta = 2.86 corresponds to zero obscuration.
- domain assumption The Calzetti et al. (2000) attenuation law and the E(B-V) to BD conversion (Eq. 14) are valid for this galaxy sample.
invented entities (2)
-
Fdust
-
Hdust
Cite this review
Pith. "Pith review of Galaxy And Mass Assembly: A new approach to quantifying dust in galaxies." pith.science (2026). https://pith.science/paper/XHKJQPZ5
@misc{pith2026250513797,
  author       = {Pith},
  title        = {Pith review of: Galaxy And Mass Assembly: A new approach to quantifying dust in galaxies},
  year         = {2026},
  howpublished = {\url{https://pith.science/paper/XHKJQPZ5}},
  note         = {Machine review of arXiv:2505.13797}
}
abstract
We introduce a new approach to quantifying dust in galaxies by combining information from the Balmer decrement (BD) and the dust mass ($M_d$). While there is no explicit correlation between these two properties, they jointly probe different aspects of the dust present in galaxies. We explore two new parameters that link BD with $M_d$ by using star formation rate sensitive luminosities at several wavelengths (ultraviolet, H$\alpha$, and far-infrared). This analysis shows that combining the BD and $M_d$ in these ways provides new metrics that are sensitive to the degree of optically thick dust affecting the short wavelength emission. We show how these new ''dust geometry'' parameters vary as a function of galaxy mass, star formation rate, and specific star formation rate. We demonstrate that they are sensitive probes of the dust geometry in galaxies, and that they support the ''maximal foreground screen'' model for dust in starburst galaxies.
Figures


Figures from the paper (12 more)


Reference graph
Works this paper leans on
-
[3]
https: //academic.oup.com/mnras/article- lookup/doi/10.1111/j.1365- 2966.2008.13535.x
https://doi.org/10.1111/j.1365- 2966.2008.13535.x. https: //academic.oup.com/mnras/article- lookup/doi/10.1111/j.1365- 2966.2008.13535.x. De Vis, P., L. Dunne, S. Maddox, H. L. Gomez, C. J. R. Clark, A. E. Bauer, S. Viaene, et al. 2017. Herschel -A TLAS: revealing dust build-up and decline across gas, dust and stellar mass selected samples – I. Scaling re...
arXiv 2008
-
[4]
https://doi.org/10.1093/mnras/stw2501. https://academic.oup. com/mnras/article-lookup/doi/10.1093/mnras/stw2501. Driver, S. P., D. T. Hill, L. S. Kelvin, A. S. G. Robotham, J. Liske, P. Norberg, I. K. Baldry, et al. 2011. Galaxy and Mass Assembly (GAMA): survey diagnostics and core data release: GAMA [in en]. Monthly Notices of the Royal Astronomical Soci...
arXiv 2011
-
[7]
https://iopscience.iop.org/article/ 10.1086/379608
https://doi.org/10.1086/379608. https://iopscience.iop.org/article/ 10.1086/379608. 18 B. Farley et al. Kauffmann, Guinevere, Timothy M. Heckman, Christy Tremonti, Jarle Brinchmann, Stéphane Charlot, Simon D. M. White, Susan E. Ridg- way, et al. 2003. The host galaxies of active galactic nuclei [in en]. Monthly Notices of the Royal Astronomical Society346...
-
[8]
https: //academic.oup.com/mnras/article- lookup/doi/10.1111/j.1365- 2966.2011.18615.x
https://doi.org/10.1111/j.1365- 2966.2011.18615.x. https: //academic.oup.com/mnras/article- lookup/doi/10.1111/j.1365- 2966.2011.18615.x. Witt, Adolf N., Harley A. Thronson Jr., and John M. Capuano Jr. 1992. Dust and the transfer of stellar radiation within galaxies [in en]. The Astro- physical Journal 393 (July): 611. ISSN: 0004-637X, 1538-4357, accessed...
arXiv 2011
-
[296]
ISSN: 00046256, accessed October 16, 2023. https://doi.org/10. 1086/321113. https://iopscience.iop.org/article/10.1086/321113. Hopkins, A. M., C. J. Miller, R. C. Nichol, A. J. Connolly, M. Bernardi, P. L. Gomez, T. Goto, et al. 2003. Star Formation Rate Indicators in the Sloan Digital Sky Survey [in en]. The Astrophysical Journal 599, no. 2 (December): 9...
doi:10.1086/321113 2023
-
[2023]
http://iopscience.iop.org/article/ 10.1086/324269
https://doi.org/10.1086/324269. http://iopscience.iop.org/article/ 10.1086/324269. . 2001b. The effects of dust on the spectral energy distribution of star-forming galaxies [in en]. New Astronomy Reviews 45, nos. 9-10 (October): 601–607. ISSN: 13876473, accessed February 27, 2023. https: //doi.org/10.1016/S1387-6473(01)00144-0. https://linkinghub.elsevier...
-
[2025]
https://doi.org/10.1093/mnras/stw2749. https://academic.oup. com/mnras/article-lookup/doi/10.1093/mnras/stw2749. Calzetti, Daniela. 2001a. The Dust Opacity of Star-forming Galaxies [in en]. Publications of the Astronomical Society of the Pacific 113, no. 790 (Decem- ber): 1449–1485. ISSN: 0004-6280, 1538-3873, accessed November 8,
Reviewed August 15, 2026 · model on record in the stance chip above.
Discussion (0). Continue with ORCID to comment.