REVIEW 3 major objections 7 minor 12 references
A High-Flux Electron Detector System to Measure Non-linear Compton Scattering at LUXE
T0 review · 3 major / 7 minor · reviewed 2026-08-15 · deepseek-v4-flash
Pith's one-line read A two-channel electron detector resolves the nonlinear Compton edge near 8 GeV.
desk verdict Useful prototype detector paper with first E-320 beam data; the claimed Compton edge is plausible but rests on an unvalidated background subtraction and an uncalibrated energy axis. read the letter →
The pith
A machine-rendered reading of the paper's core claim, the machinery that carries it, and where it could break.
The reading
What carries the argument
The load-bearing mechanism is energy-to-position conversion by a spectrometer dipole followed by two spatially segmented readouts. The screen detector converts electron flux into scintillation light with intensity proportional to the number of electrons at each energy, giving about 2% relative energy resolution from sub-millimeter spatial resolution. The straw detector uses the Cherenkov effect: in a medium of refractive index $n$, the number of photons emitted per unit length along an electron track is $dN/dx = \int_{f_1}^{f_2} \frac{2\pi\alpha z^2}{c} \sin^2\Theta_C\, df$ with $\cos\Theta_C = 1/(\beta n)$, so the light yield tags the electron's velocity and hence its energy. Because the expected flux per straw varies strongly across the spectrum, air and quartz glass provide two Cherenkov media with different thresholds and yields, and tilting the straws tunes the light collection, extending the dynamic range of a single detector system.
What would settle it
Take a dedicated run in which the laser is off for all bunches but every bunch is analyzed with the same alternating 'signal' and 'background' labels; if the difference spectrum still shows a sharp structure near 8 GeV, the Compton edge claim is refuted. More directly, scan the laser intensity from zero upward and check that the edge amplitude and position vary monotonically with $a_0$ and disappear at zero intensity.
Extended reading notes
Core claim
The central claim is that a detector built from two complementary principles—a thin scintillating screen with a camera and segmented Cherenkov straws with silicon-photomultiplier readout—can act as an electron energy spectrometer for nonlinear Compton scattering in the high-flux regime. After a dipole magnet sorts electrons by energy, the screen records the full spectrum through position-dependent scintillation light, while the straws, filled with air or quartz glass, count electrons through Cherenkov light whose yield depends on velocity. In first collision data, the screen shows a Compton edge near 8 GeV, visible as the difference between electron-laser shots and background shots taken without the laser. The paper presents this as a demonstration that the system can reveal the energy features of non-perturbative QED and that it is ready for further development toward a final detector for the LUXE experiment.
Load-bearing premise
The load-bearing premise is that the laser-off background bunches recorded every 10 bunches are identical to the laser-on bunches except for the absence of the collision, so subtracting them leaves only the Compton signal; if the beam or detector baseline drifts between the two shot types, the apparent 8 GeV edge could be an artifact rather than physics.
Editorial extensions
If this is right
- The screen and straw readouts independently sample the same spectrum, so their combination can cross-calibrate gains and reduce systematic uncertainties in the reconstructed electron energies.
- By switching the Cherenkov medium between air and quartz glass and by adjusting the straw tilt, the detector can cover the large flux variation expected across the Compton spectrum, from roughly $10^4$ to $10^7$ electrons per bunch crossing.
- A clear Compton edge in the background-subtracted screen signal is a direct, in-situ signature of nonlinear Compton scattering, providing a testable observable for strong-field QED models.
- The observed roughly 50% loss of SiPM signal over nine days of operation sets a concrete radiation-hardness requirement for a high-luminosity experiment and identifies the components that need shielding or redesign.
- With high statistics and full Monte Carlo comparison, the same detector could resolve the shift of the Compton edge and the harmonic structure predicted as the laser intensity parameter $a_0$ increases.
Reading between the lines
- A natural consequence the paper leaves implicit: the position of the 8 GeV edge encodes the effective laser intensity seen by the beam, so the same background-subtracted screen measurement could be used as a bunch-by-bunch diagnostic of the laser-electron overlap.
- Because the laser-off background is recorded only once every 10 bunches, systematic drifts in beam charge, pointing, or screen response between those shots and the laser-on shots would masquerade as spectral structure; an interleaved laser-off test with identical timing would separate real Compton signal from such drifts.
- The Cherenkov threshold in the straws, where only electrons above a velocity threshold produce light, gives a natural two-threshold readout when combined with the screen: comparing the two could separate the low-energy tail from the hard Compton edge.
- If the nonlinear-QED interpretation is right, scanning laser power should move the edge upward and develop harmonic shoulders at higher $a_0$; that is a directly accessible experimental prediction that would distinguish nonlinear from linear Compton scattering.
Signed reviews
Editorial analysis
A structured set of objections, weighed in public.
Referee Report
Summary. The paper describes the Electron Detection System (EDS) proposed for the LUXE experiment, comprising a scintillating screen with a camera and a segmented Cherenkov straw detector with SiPM readout. Prototype tests at the E-320/FACET-II facility are reported: a pencil-beam scan of the straw detector, SiPM radiation damage observed over about nine days, and screen-detector measurements of electron-laser collisions. From the difference between laser-on and laser-off shots, the authors claim a Compton edge near 8 GeV and conclude that the EDS works as a high-flux electron energy spectrometer.
Significance. If substantiated, the result is valuable for LUXE detector design: a two-technology EDS with complementary scintillation and Cherenkov readout, and the first demonstration of a Compton electron spectrum in a running strong-field QED experiment, would be significant. The paper has clear strengths: an independent LED pulser is used to monitor SiPM gain, the measured beam width is consistent with machine expectations, and the radiation damage is explicitly documented. However, the claimed Compton-edge observation currently rests on an unvalidated background subtraction and an uncalibrated energy axis, so the significance as presented is not yet established.
major comments (3)
- [Section 4, Fig. 8] The claim that a Compton edge is visible near 8 GeV rests entirely on the difference between electron-laser shots and background shots taken every 10 bunches without the laser. The paper does not demonstrate that the two bunch types have identical beam energy, charge, position, and luminosity, nor that the background spectrum is stable over the O(10) shots averaged, and it does not provide a null test using only background shots. Since the paper itself documents response drift for the SiPMs (Fig. 7) and a similar drift is not ruled out for the screen/camera chain, a baseline drift could produce the apparent excess. This is load-bearing because the headline physics result is the difference spectrum. Please add a background-stability test, a bunch-by-bunch beam monitor comparison, a null test using only laser-off shots, and an uncertainty band propagated into the difference.
- [Section 4, Fig. 8] The energy axis of Fig. 8 is not calibrated. No measurement is shown that converts the vertical screen position to electron energy, and no spectrometer transfer function or dispersion calibration is described. The quoted 'around roughly 8 GeV' is therefore based on an assumed mapping. Please provide the calibration or at least state the assumed magnetic/optical model and quote an energy-scale uncertainty.
- [Section 4, Fig. 8] The raw spectra in Fig. 8 overlap substantially, and the difference is shown on a logarithmic scale without an uncertainty band. To support the statement that a 'clear' Compton edge is present, the authors should show the difference on a linear scale with a zero line and estimate its statistical significance (for example, a chi-square relative to a flat zero baseline, including systematic uncertainties).
minor comments (7)
- [Section 3, Eq. (2)] Equation (2) is garbled: the Cherenkov angle relation should be cos theta_C = 1/(beta n), so sin^2 theta_C = 1 - 1/(beta^2 n^2), and the integral notation with 'Z f2/f1' is not standard. Please rewrite this equation.
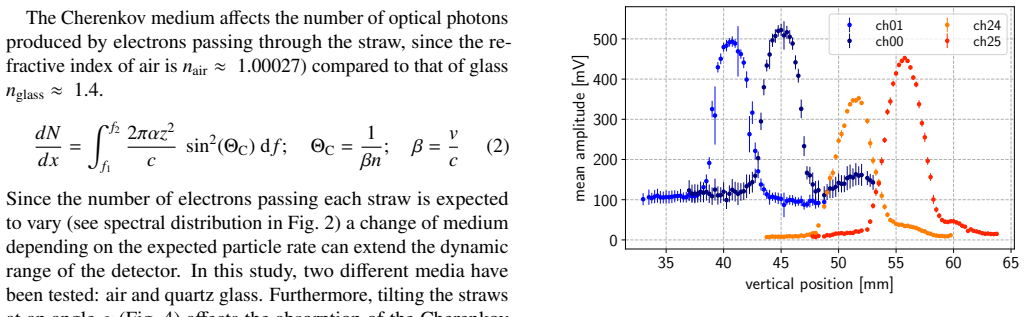
- [Section 4, Fig. 6] The amplitude points in Fig. 6 have no error bars, and the quoted beam width (1.3 +/- 0.2) mm is not derived from a shown fit. Please specify the fit function, whether the offset background was included, and how the uncertainty was obtained.
- [Section 4, Fig. 7] Fig. 7 has no uncertainty bars or fit. Please state how the normalized signal was computed and add uncertainties, since the radiation-damage claim is quantitative.
- [Section 4, Fig. 8] The figure caption says the background is generated every 10 bunches, but the number of shots averaged is vague as O(10). Please give the exact numbers of laser-on and laser-off shots used.
- [Section 4, Fig. 8] Because the difference is plotted on a logarithmic scale, negative differences are not visible. A linear-scale plot with a zero line would be more informative.
- [Section 2, Fig. 2] The Ptarmigan simulation parameters (beam energy, laser wavelength, and the a0 values) are not given in the caption; please list them so the reader can reproduce the curves.
- [Section 5] The conclusion mentions future combination of straw and screen data, but the present data show no straw-detector spectrum from collisions. Please clarify that the Compton-edge result comes from the screen detector only.
Circularity Check
No significant circularity: the paper reports calibrated detector measurements, and the Compton-edge claim is an experimental background subtraction rather than a fit or self-citation disguised as a prediction.
full rationale
The manuscript is an instrumentation and detector-characterization paper, not a derivation of physics parameters from a fitted model. The calibration chain is independent of the target result: SiPM gains and beam-profile measurements use an LED pulser and a mono-energetic pencil beam (Section 4, Figs. 6 and 7), and the Cherenkov-light description uses the standard textbook formula in Eq. (2). The claimed 8 GeV Compton edge in Fig. 8 is presented directly as the difference between electron-laser shots and no-laser background shots, and the gray curve is explicitly labeled 'difference'. That is an experimental background subtraction, not a fitted parameter renamed as a prediction: no parameter of the subtraction is tuned to place the edge at 8 GeV, and the no-laser bunches are described as a separate data-taking condition rather than as an output of the analysis. The energy axis is not derived from the Compton edge; the edge is located on an assumed spectrometer energy mapping. Whether the no-laser baseline is stable enough for this subtraction is a legitimate experimental systematic concern, and the paper would be strengthened by bunch-by-bunch beam matching and a null test, but that is a data-quality critique rather than circularity under the definitions used here. References to the LUXE Technical Design Report [5] and the E-320 progress report [3] include overlapping authors, but they are used to document detector geometry and the background cadence, not to prove the existence of the Compton edge; the measured edge is a direct experimental observation. No uniqueness theorem is imported, no self-definitional equation is present, and no fit-then-predict construction appears. Therefore no significant circularity is found.
Assumptions & free parameters
assumptions (3)
- domain assumption Background bunches with no laser are otherwise identical to electron-laser bunches, so subtracting them isolates the Compton signal.
- domain assumption The screen position maps linearly to electron energy after the dipole, with a resolution better than 0.5 mm giving about 2% energy resolution.
- standard math The Cherenkov light production formula (Eq. 2) describes the signal in the straws, and the refractive indices used are correct for the media.
Cite this review
Pith. "Pith review of A High-Flux Electron Detector System to Measure Non-linear Compton Scattering at LUXE." pith.science (2026). https://pith.science/paper/WSCOMBYL
@misc{pith2026250514720,
  author       = {Pith},
  title        = {Pith review of: A High-Flux Electron Detector System to Measure Non-linear Compton Scattering at LUXE},
  year         = {2026},
  howpublished = {\url{https://pith.science/paper/WSCOMBYL}},
  note         = {Machine review of arXiv:2505.14720}
}
read the original abstract
Recently, advancements in high-intensity laser technology have enabled the exploration of non-perturbative Quantum Electrodynamics (QED) in strong-field regimes. Notable aspects include non-linear Compton scattering and Breit-Wheeler pair production, observable when colliding high-intensity laser pulses and relativistic electron beams. The LUXE experiment at DESY and the E-320 experiment at SLAC aim to study these phenomena by measuring the created high-flux Compton electrons and photons. We propose a novel detector system featuring a segmented gas-filled Cherenkov detector with a scintillator screen and camera setup, designed to efficiently detect high-flux Compton electrons. Preliminary results from E-320 measurement campaigns demonstrate methods for reconstructing electron energy spectra, aiming to reveal crucial features of non-perturbative QED.
Figures


Figures from the paper (3 more)


Reference graph
Works this paper leans on
-
[1]
Di fferential measurement of trident production in strong electromagnetic fields
Nielsen, C.F., Holtzapple, R., Lund, M.M., Surrow, J.H., Sørensen, A.H., Sørensen, M.B., et al. Di fferential measurement of trident production in strong electromagnetic fields. Physical Review D 2023;108(5):052013. URL: https://link.aps.org/doi/10.1103/ PhysRevD.108.052013. doi:10.1103/PhysRevD.108.052013
-
[2]
Advances in QED with intense background fields
Fedotov, A., Ilderton, A., Karbstein, F., King, B., Seipt, D., Taya, H., et al. Advances in QED with intense background fields. Physics Reports 2023;1010:1–138. URL: https://linkinghub. elsevier.com/retrieve/pii/S0370157323000352. doi: 10.1016/ j.physrep.2023.01.003
work page 2023
-
[3]
E-320 Progress in FY24 and Plans for FY25
Reis, D., Meuren, S.. E-320 Progress in FY24 and Plans for FY25
-
[4]
Conceptual design report for the LUXE experiment
Abramowicz, H., Acosta, U., Altarelli, M., Aßmann, R., Bai, Z., Behnke, T., et al. Conceptual design report for the LUXE experiment. The European Physical Journal Special Topics 2021;230(11):2445–2560. doi:10.1140/epjs/s11734-021-00249-z
-
[5]
Technical Design Report for the LUXE experiment
LUXE Collaboration, , Abramowicz, H., Almanza Soto, M., Altarelli, M., Aßmann, R., Athanassiadis, A., et al. Technical Design Report for the LUXE experiment. The European Physical Journal Special Topics 2024;doi:10.1140/epjs/s11734-024-01164-9
-
[6]
Blackburn, T.G., King, B., Tang, S.. Simulations of laser-driven strong- field QED with Ptarmigan: Resolving wavelength-scale interference and gamma-ray polarization. Physics of Plasmas 2023;30(9):093903. URL: https://pubs.aip.org/pop/article/30/9/093903/2911813/ Simulations-of-laser-driven-strong-field-QED-with . doi:10.1063/5.0159963
-
[7]
Basler AG, . Basler acA1920-40gm. 2025. URL: https://docs. baslerweb.com/aca1920-40gm
work page 2025
-
[8]
Hamamatsu MPPC S14160 Datasheet
HAMAMATSU PHOTONICS K.K., . Hamamatsu MPPC S14160 Datasheet. 2023. URL: https://www.hamamatsu.com/content/ dam/hamamatsu-photonics/sites/documents/99_SALES_ LIBRARY/ssd/s14160-1310ps_etc_kapd1070e.pdf
work page 2023
Show all 12 references
-
[9]
Principles of Radiation Interaction in Matter and Detection
Leroy, C., Rancoita, P.G.. Principles of Radiation Interaction in Matter and Detection. 4 ed.; WORLD SCIENTIFIC; 2016. ISBN 9789814603188 9789814603195. URL: https://www.worldscientific.com/ worldscibooks/10.1142/9167. doi:10.1142/9167
2016 doi
-
[10]
Radiation damage of SiPMs
Garutti, E., Musienko, Y .. Radiation damage of SiPMs. Nuclear Instruments and Methods in Physics Research Section A: Accelera- tors, Spectrometers, Detectors and Associated Equipment 2019;926:69–
2019
-
[84]
doi:10.1016/j.nima.2018.10.191
URL: https://linkinghub.elsevier.com/retrieve/pii/ S0168900218315055. doi:10.1016/j.nima.2018.10.191. 4
2018 doi
-
[2024]
URL: https://indico.slac.stanford.edu/event/9280/ contributions/10855/attachments/4822/12981/2024_NOV_ E320_FACET.pdf
Reviewed August 15, 2026 · model on record in the stance chip above.
Discussion (0). Continue with ORCID to comment.