REVIEW 4 major objections 4 minor 37 references
Quasar Negative Feedback to Surrounding Galaxies Probed with Ly$\alpha$ Emitters and Continuum-Selected Galaxies
T0 review · 4 major / 4 minor · reviewed 2026-08-07 · deepseek-v4-flash
Pith's one-line read Quasars at z~2.2 leave a >5-sigma deficit of young galaxies within ~2.5 pMpc, pointing to photoevaporation.
desk verdict A solid new differential measurement of LAE deficits around quasars, but the feedback interpretation leans on a halo-mass-matched control whose assumptions are not yet nailed down. read the letter →
The pith
A machine-rendered reading of the paper's core claim, the machinery that carries it, and where it could break.
The reading
What carries the argument
The analysis rests on stacking quasar fields with spatial scales normalized so that each quasar's proximity radius, computed from its Lyman-limit luminosity and the assumed UV background intensity ($J_{21}=1.0$), maps to the median value of 5.2 arcmin (about 2.5 pMpc). Within the stacked fields, the surface densities of LAEs and continuum-selected galaxies are measured in radial bins and normalized at 20 arcmin. The differential between the two populations, the split of LAEs into high- and low-EW subsamples at EW$_0=75$ Å, and a control experiment using continuum-selected galaxies with quasar-matched halo masses are what carry the photoevaporation argument: the LAE deficit is strongest precisely where quasar radiation dominates over the UV background.
What would settle it
Stack a comparable sample of quasars at $z\sim2.2$ with deep spectroscopy of LAE candidates inside the proximity region: if LAEs with rest-frame EW above 150 Å are found within about 1 pMpc of active quasars, or if the density deficit disappears once photometric-redshift interlopers are removed, the photoevaporation claim would be contradicted.
Extended reading notes
Core claim
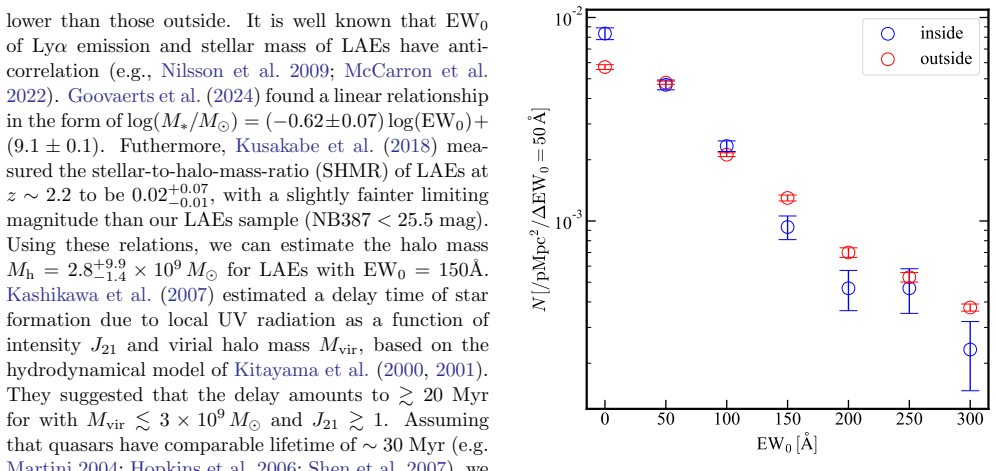
The central claim is that quasar UV radiation suppresses the formation or visibility of low-mass galaxies within a few pMpc of the quasar at $z\sim2.2$, with the effect strongest for the smallest halos. The evidence is a stacked analysis of 18 SDSS quasars in HSC-SSP Deep/UltraDeep fields: after normalizing each field by its proximity radius, LAEs are $\gtrsim5\sigma$ less dense than continuum-selected galaxies inside the proximity region, high-EW LAEs are about $3\sigma$ less dense than low-EW ones, and LAEs with rest-frame EW $\gtrsim150$ Å are almost entirely absent. The authors also show that both LAEs and continuum-selected galaxies are more clustered around halo-mass-matched control galaxies than around quasars, which they interpret as a signature of quasar activity rather than a pre-existing environmental difference.
Load-bearing premise
The conclusion that quasar activity causes the observed deficit assumes that the continuum-selected galaxies used as controls really have the same halo masses and live in the same large-scale environments as the quasars; if the halo-mass matching fails, the weaker clustering around quasars could reflect a pre-existing environmental difference rather than feedback.
Editorial extensions
If this is right
- Quasar activity at $z\sim2.2$ should leave a measurable deficit of low-mass galaxies within roughly 2.5 pMpc, not just of LAEs.
- High-EW LAEs act as a diagnostic of active quasar feedback: their scarcity inside the proximity region marks where UV radiation has stripped or heated halo gas.
- The inferred halo-mass threshold for photoevaporation lies near $M_h\sim3\times10^9\,M_\odot$, consistent with theoretical delay-time estimates for gas removal.
- The effect may extend to halos as massive as about $10^{12}\,M_\odot$, implying quasar feedback shapes galaxy populations over a wide mass range.
- Environment studies that rely only on LAEs will systematically undercount neighbors around quasars, biasing clustering measurements if the effect is real.
Reading between the lines
- A direct test of the photoevaporation interpretation would compare LAE deficits around quasars of different UV luminosities: if the deficit scales with ionizing flux or quasar lifetime, feedback is the likely cause; if not, an evolved-galaxy explanation becomes more plausible.
- The same stacked approach could be applied at $z>6$, where the UV background is weaker and halos are less massive, predicting an even stronger LAE deficit around the earliest quasars.
- Spectroscopic follow-up of continuum-selected galaxies inside the proximity region could separate photoevaporation from environmental effects: if their stellar masses are similar to those outside, the deficit is less likely to be a mass-dependent selection artifact.
Editorial analysis
A structured set of objections, weighed in public.
Referee Report
Summary. This paper stacks 18 SDSS quasars at z~2.2 in the HSC-SSP Deep/UltraDeep fields, using the proximity radius to rescale each field before stacking, and compares the radial surface density profiles of Ly-alpha emitters (LAEs) from Kikuta et al. (2023) with continuum-selected galaxies from Desprez et al. (2023). The main results are: (1) within the quasar proximity region (~5 arcmin), the LAE density is more than 5 sigma lower than that of continuum-selected galaxies; (2) high-EW LAEs (EW0 >~75 Angstrom) are less abundant than low-EW LAEs at ~3 sigma, and LAEs with EW0 >~150 Angstrom are especially scarce; and (3) both LAEs and continuum-selected galaxies are less clustered around quasars than around control galaxies selected to have similar halo masses. The authors interpret these findings as evidence for quasar photoevaporation of low-mass haloes, with weaker effects on more massive haloes.
Significance. If the interpretation is correct, this is one of the cleanest statistical demonstrations of quasar negative feedback at z~2.2, using a homogeneous, large-area dataset and a simple empirical stacking methodology. The paper benefits from using public catalogs and clearly describing the selection cuts. The central 5-sigma deficit between LAEs and continuum-selected galaxies is a robust empirical pattern, and the EW dependence is an interesting and potentially discriminating observable. However, the causal attribution to photoevaporation depends on the control experiment in Figure 2, which is not yet established at the level needed to exclude environmental differences.
major comments (4)
- [Section 4, Figure 2] The claim that quasar activity, rather than pre-existing environment, causes the LAE deficit hinges entirely on the control experiment in Figure 2. The control galaxies are selected to match the mean quasar halo mass via the Harikane et al. (2022) UV luminosity-to-halo-mass relation, but this relation has intrinsic scatter (~0.2-0.3 dex) and the paper does not test how that scatter, or possible assembly bias, affects the expected clustering amplitude around the control centers. If the control galaxies preferentially reside in different large-scale environments than quasar hosts, the difference in Figure 2 would arise without any feedback. Please quantify the sensitivity of the control comparison to plausible scatter in the M_h-M_UV relation and to the known transient nature of quasar host environments, for example by varying the scatter, by using a clustering-based halo mass estimate for the control sample, or by comparing the quasar autocorrelation function with that of the control galaxies.
- [Section 3, Eq. (2) and normalization] The stacking procedure normalizes each quasar field by the individual proximity radius, r_prox, so that all fields contribute with the same physical scale. This implicitly assumes that the radial distribution of the putative photoevaporation effect scales self-similarly with r_prox. If the efficiency of feedback does not scale linearly with the ionizing luminosity, or if quasar lifetimes vary with luminosity, the normalization could create or distort the observed profile shape. A simple test would be to split the sample by quasar luminosity (or by r_prox) and check that the stacked profile shape is invariant under the scaling; without such a test, the 5-sigma deficit within the normalized proximity region is not yet uniquely tied to the physical proximity effect.
- [Section 4, last paragraph] The paper acknowledges that the LAE and continuum-selected galaxy samples span different redshift path lengths (Delta z ~0.05 versus ~0.15) and that photo-z contamination affects the fainter continuum-selected galaxies, but it does not quantify the impact of these effects on the central comparison in Figure 1. Because the 5-sigma deficit is measured between two samples with different redshift selection functions, a null-feedback model could in principle produce a similar apparent deficit if, for example, the continuum-selected sample includes a radially varying contaminating population. Please provide a quantitative estimate (e.g., using the photo-z error distribution and the known redshift selection) or a simple mock catalog demonstrating that the measured difference cannot be explained by these selection effects alone.
- [Figure 2 and bootstrap errors] The bootstrap error bars for the control profiles in Figure 2 may be underestimated because the control galaxies are spatially correlated and multiple control centers fall within the same large-scale structure. The paper does not specify whether bootstrap resampling accounts for this correlation. I recommend using a block bootstrap over independent sightlines, or a jackknife over the 18 quasar fields, to verify that the apparent difference in clustering between quasars and control galaxies remains significant.
minor comments (4)
- [Figure captions] Typographical errors: 'calcurated' should be 'calculated' in the captions of Figures 1, 2, and 3, and 'devide' should be 'divide' in Section 3.
- [Section 4, Figure 4] The sentence 'Figure 4 shows that the density of continuum-selected galaxies.' is incomplete and should be rephrased to state what the figure demonstrates.
- [Section 2.2] The selection 'cmodel i < 25.0' is not precisely defined; please state whether this is the i-band cmodel magnitude and clarify the completeness limit in the context of the Desprez et al. (2023) catalog.
- [Figure 1] The axis labels mix arcmin and pMpc without clearly explaining that the physical scale is computed for the median proximity radius; please add a note clarifying that the pMpc scale is approximate and relies on the assumed cosmology.
Circularity Check
No significant circularity: the LAE deficit is an empirical stacking measurement whose interpretation is supported by external calibrations, not by a fitted or self-cited input.
full rationale
The paper's central measurement is a stacking analysis of external LAE and continuum-selected galaxy catalogs around 18 SDSS quasars. The claimed deficit is obtained by counting galaxies in radial bins after normalizing each field by a proximity radius computed from quasar spectra and an external UV-background intensity (Cooke et al. 1997); no parameter is fitted to the target result and the proximity radius is not derived from the LAE density. The Figure 2 control uses the external Harikane et al. (2022) UV-luminosity-to-halo-mass relation to select control galaxies with halo mass comparable to quasars; this is an astrophysical assumption about environment matching, and its validity is a systematic concern, but it is not a circular reduction because the control is not constructed from the measured LAE deficit. The EW and halo-mass interpretation uses independent external relations (Goovaerts et al. 2024; Kusakabe et al. 2018; Kashikawa et al. 2007), which supply calibrations rather than the result itself. Self-citations to Uchiyama et al. (2019) and Suzuki et al. (2024) are corroborative and not load-bearing; removing them would not change the empirical profile. The paper also acknowledges limitations such as photometric-redshift contamination and the different redshift volumes probed by LAEs and continuum-selected galaxies, but these are non-circular caveats. No step in the derivation is equivalent by construction to an input, so the circularity score is 0.
Assumptions & free parameters
assumptions (6)
- domain assumption The UV background intensity at the Lyman limit is J_bkg_21 = 1.0 (+0.5/-0.3) at z~2 (Cooke et al. 1997), used to compute r_prox in Eq. (2).
- domain assumption The LAE catalog of Kikuta et al. (2023) provides a complete and reliable sample of LAEs at z=2.2 in the HSC D/UD fields.
- domain assumption The photometric redshifts of Desprez et al. (2023) for continuum-selected galaxies are accurate, with outlier fraction less than 7% for i<25, so the selected galaxies are at z~2.2.
- domain assumption Quasars in the sample have halo mass comparable to the control continuum-selected galaxies selected via the Harikane et al. (2022) UV luminosity-halo mass relation.
- domain assumption The photoevaporation delay time model of Kitayama et al. (2000, 2001) and Kashikawa et al. (2007) applies at z~2.2 with a quasar lifetime of about 30 Myr.
- ad hoc to paper Stacking fields after scaling by r_prox assumes the feedback effect scales self-similarly with the proximity radius.
Cite this review
Pith. "Pith review of Quasar Negative Feedback to Surrounding Galaxies Probed with Ly$\alpha$ Emitters and Continuum-Selected Galaxies." pith.science (2026). https://pith.science/paper/Y7UDD3AQ
@misc{pith2026250517377,
  author       = {Pith},
  title        = {Pith review of: Quasar Negative Feedback to Surrounding Galaxies Probed with Ly$\alpha$ Emitters and Continuum-Selected Galaxies},
  year         = {2026},
  howpublished = {\url{https://pith.science/paper/Y7UDD3AQ}},
  note         = {Machine review of arXiv:2505.17377}
}
abstract
We report on the statistical analysis of quasar photoevaporation at $z\sim2.2$ by comparing the density of surrounding Ly$\alpha$ Emitters (LAEs) and continuum-selected galaxies, based on the imaging data of Hyper Suprime-Cam (HSC) Subaru Strategic Program (SSP) and CFHT Large Area $U$-band Deep Survey (CLAUDS). We select 18 quasars from Sloan Digital Sky Survey (SDSS) in the HSC Deep/UltraDeep fields, normalize the LAE/continuum-selected galaxy distribution around each quasar with the quasar proximity size, stack them, and then measure the average densities of the galaxies. As a result, we find that the density of LAEs is $\gtrsim 5 \sigma$ lower than that of continuum-selected galaxies within the quasar proximity region. Within the quasar proximity region, we find that the LAEs with high Ly$\alpha$ equivalent widths (EWs) are less dense than those with low EWs at the 3$\sigma$ level and that LAEs with EW of $\gtrsim150$ \AA (rest-frame) are predominantly scarce. Finally, we find that both LAEs and continuum-selected galaxies have smaller densities when they are closer to quasars. We argue that the photoevaporation effect is more effective for smaller dark matter haloes predominantly hosting LAEs, but that it may also affect larger haloes.
Figures


Figures from the paper (1 more)

Reference graph
Works this paper leans on
-
[1]
2018a, PASJ, 70, S4, doi: 10.1093/pasj/psx066
Aihara, H., Arimoto, N., Armstrong, R., et al. 2018a, PASJ, 70, S4, doi: 10.1093/pasj/psx066
-
[2]
2018b, PASJ, 70, S8, doi: 10.1093/pasj/psx081
Aihara, H., Armstrong, R., Bickerton, S., et al. 2018b, PASJ, 70, S8, doi: 10.1093/pasj/psx081
-
[3]
2019, PASJ, 71, 114, doi: 10.1093/pasj/psz103 —
Aihara, H., AlSayyad, Y., Ando, M., et al. 2019, PASJ, 71, 114, doi: 10.1093/pasj/psz103 —. 2022, PASJ, 74, 247, doi: 10.1093/pasj/psab122
-
[4]
Frenk, C. S. 2002, MNRAS, 333, 156, doi: 10.1046/j.1365-8711.2002.05387.x
arXiv 2002
-
[5]
Bosman, S. E. I., Kakiichi, K., Meyer, R. A., et al. 2020, ApJ, 896, 49, doi: 10.3847/1538-4357/ab85cd
-
[6]
2012, MNRAS, 421, 2543, doi: 10.1111/j.1365-2966.2012.20479.x
Dijkstra, M. 2012, MNRAS, 421, 2543, doi: 10.1111/j.1365-2966.2012.20479.x
arXiv 2012
-
[7]
Cooke, A. J., Espey, B., & Carswell, R. F. 1997, MNRAS, 284, 552, doi: 10.1093/mnras/284.3.552
-
[8]
2023, A&A, 670, A82, doi: 10.1051/0004-6361/202243363
Desprez, G., Picouet, V., Moutard, T., et al. 2023, A&A, 670, A82, doi: 10.1051/0004-6361/202243363
Show all 37 references
-
[9]
D., White, M., et al
Eftekharzadeh, S., Myers, A. D., White, M., et al. 2015, MNRAS, 453, 2779, doi: 10.1093/mnras/stv1763
2015 doi
- [10]
-
[11]
2024, A&A, 683, A184, doi: 10.1051/0004-6361/202348011
Goovaerts, I., Pello, R., Burgarella, D., et al. 2024, A&A, 683, A184, doi: 10.1051/0004-6361/202348011
2024 doi
-
[12]
2017, MNRAS, 470, L117, doi: 10.1093/mnrasl/slx088
Goto, T., Utsumi, Y., Kikuta, S., et al. 2017, MNRAS, 470, L117, doi: 10.1093/mnrasl/slx088
2017 doi
-
[13]
2022, ApJS, 259, 20, doi: 10.3847/1538-4365/ac3dfc
Harikane, Y., Ono, Y., Ouchi, M., et al. 2022, ApJS, 259, 20, doi: 10.3847/1538-4365/ac3dfc
2022 doi
-
[14]
F., Somerville, R
Hopkins, P. F., Somerville, R. S., Hernquist, L., et al. 2006, ApJ, 652, 864, doi: 10.1086/508503
2006 doi
-
[15]
K., Yamanaka, S., Ouchi, M., et al
Inoue, A. K., Yamanaka, S., Ouchi, M., et al. 2020, PASJ, 72, 101, doi: 10.1093/pasj/psaa100
2020 doi
-
[16]
2007, ApJ, 663, 765, doi: 10.1086/518410
Kashikawa, N., Kitayama, T., Doi, M., et al. 2007, ApJ, 663, 765, doi: 10.1086/518410
2007 doi
-
[17]
2018, PASJ, 70, 66, doi: 10.1093/pasj/psy056
Kawanomoto, S., Uraguchi, F., Komiyama, Y., et al. 2018, PASJ, 70, 66, doi: 10.1093/pasj/psy056
2018 doi
-
[18]
2017, ApJ, 841, 128, doi: 10.3847/1538-4357/aa72f0
Kikuta, S., Imanishi, M., Matsuoka, Y., et al. 2017, ApJ, 841, 128, doi: 10.3847/1538-4357/aa72f0
2017 doi
-
[19]
2023, ApJS, 268, 24, doi: 10.3847/1538-4365/ace4cb
Kikuta, S., Ouchi, M., Shibuya, T., et al. 2023, ApJS, 268, 24, doi: 10.3847/1538-4365/ace4cb
2023 doi
-
[20]
2001, MNRAS, 326, 1353, doi: 10.1111/j.1365-2966.2001.04669.x
Kitayama, T., Susa, H., Umemura, M., & Ikeuchi, S. 2001, MNRAS, 326, 1353, doi: 10.1111/j.1365-2966.2001.04669.x
2001
-
[21]
2000, MNRAS, 315, L1, doi: 10.1046/j.1365-8711.2000.03589.x
Ikeuchi, S. 2000, MNRAS, 315, L1, doi: 10.1046/j.1365-8711.2000.03589.x
2000
-
[22]
2018, PASJ, 70, S2, doi: 10.1093/pasj/psx069
Komiyama, Y., Obuchi, Y., Nakaya, H., et al. 2018, PASJ, 70, S2, doi: 10.1093/pasj/psx069
2018 doi
-
[23]
2018, PASJ, 70, 4, doi: 10.1093/pasj/psx148
Kusakabe, H., Shimasaku, K., Ouchi, M., et al. 2018, PASJ, 70, 4, doi: 10.1093/pasj/psx148
2018 doi
-
[24]
W., Higley, A
Lyke, B. W., Higley, A. N., McLane, J. N., et al. 2020, ApJS, 250, 8, doi: 10.3847/1538-4365/aba623
2020 doi
- [25]
-
[26]
P., Finkelstein, S
McCarron, A. P., Finkelstein, S. L., Chavez Ortiz, O. A., et al. 2022, ApJ, 936, 131, doi: 10.3847/1538-4357/ac8546
2022 doi
-
[27]
2002, PASJ, 54, 833, doi: 10.1093/pasj/54.6.833
Miyazaki, S., Komiyama, Y., Sekiguchi, M., et al. 2002, PASJ, 54, 833, doi: 10.1093/pasj/54.6.833
2002 doi
-
[28]
2018, PASJ, 70, S1, doi: 10.1093/pasj/psx063
Miyazaki, S., Komiyama, Y., Kawanomoto, S., et al. 2018, PASJ, 70, S1, doi: 10.1093/pasj/psx063
2018 doi
- [30]
-
[31]
2010, MNRAS, 402, 1580, doi: 10.1111/j.1365-2966.2009.16034.x
Ono, Y., Ouchi, M., Shimasaku, K., et al. 2010, MNRAS, 402, 1580, doi: 10.1111/j.1365-2966.2009.16034.x
2010
-
[32]
2021, ApJ, 911, 78, doi: 10.3847/1538-4357/abea15
Ono, Y., Itoh, R., Shibuya, T., et al. 2021, ApJ, 911, 78, doi: 10.3847/1538-4357/abea15
2021 doi
-
[33]
P., Taniguchi, Y., et al
Ota, K., Venemans, B. P., Taniguchi, Y., et al. 2018, ApJ, 856, 109, doi: 10.3847/1538-4357/aab35b Planck Collaboration, Aghanim, N., Akrami, Y., et al. 2020, A&A, 641, A6, doi: 10.1051/0004-6361/201833910
2018 doi
-
[34]
2019, MNRAS, 489, 5202, doi: 10.1093/mnras/stz2522
Sawicki, M., Arnouts, S., Huang, J., et al. 2019, MNRAS, 489, 5202, doi: 10.1093/mnras/stz2522
2019 doi
-
[35]
A., Oguri, M., et al
Shen, Y., Strauss, M. A., Oguri, M., et al. 2007, AJ, 133, 2222, doi: 10.1086/513517
2007 doi
-
[36]
2024, ApJ, 972, 82, doi: 10.3847/1538-4357/ad65d7
Suzuki, Y., Uchiyama, H., Matsuoka, Y., et al. 2024, ApJ, 972, 82, doi: 10.3847/1538-4357/ad65d7
2024 doi
-
[37]
2019, ApJ, 870, 45, doi: 10.3847/1538-4357/aaef7b
Uchiyama, H., Kashikawa, N., Overzier, R., et al. 2019, ApJ, 870, 45, doi: 10.3847/1538-4357/aaef7b
2019 doi
-
[38]
2010, ApJ, 721, 1680, doi: 10.1088/0004-637X/721/2/1680
Utsumi, Y., Goto, T., Kashikawa, N., et al. 2010, ApJ, 721, 1680, doi: 10.1088/0004-637X/721/2/1680
2010 doi
Reviewed August 7, 2026 · model on record in the stance chip above.
Discussion (0). Continue with ORCID to comment.