REVIEW 4 major objections 5 minor 1 cited by
A Dataset and Benchmarks for Deep Learning-Based Optical Microrobot Pose and Depth Perception
T0 review · 4 major / 5 minor · reviewed 2026-08-07 · deepseek-v4-flash
Pith's one-line read The paper introduces OTMR, the first publicly available image dataset for optical-microrobot perception, with 232,881 microscope images of 18 printed microrobot designs in 176 out-of-plane poses.
desk verdict A genuinely useful first public dataset for optical microrobot perception, but the benchmark numbers are likely inflated by temporal leakage in the frame-level split. read the letter →
The pith
A machine-rendered reading of the paper's core claim, the machinery that carries it, and where it could break.
The reading
What carries the argument
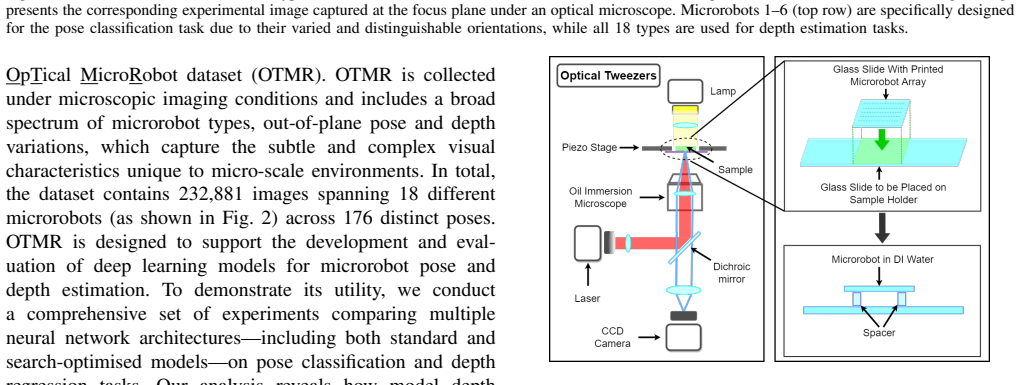
The dataset itself is the load-bearing object, and the two controlled generation mechanisms are what make it usable as a benchmark. Pose labels come from fabricating microrobots in defined pitch and roll orientations, while depth labels come from translating the robot along the z-axis with a piezo stage and recording the true depth at each frame. These mechanisms convert inherently ambiguous microscope images into supervised targets, and the five-fold cross-validation protocol turns the collection into a shared evaluation surface for comparing models.
What would settle it
Re-run the five-fold benchmark using sequence-aware folds so that all frames from one z-sweep stay in the same split; if pose accuracy and depth R2 drop markedly, the original frame-level split is inflating the reported generalization.
Extended reading notes
Core claim
The central discovery is OTMR itself: a public collection of 232,881 cropped grayscale images of 18 two-photon-polymerized microrobots, with ground-truth pitch and roll labels for 176 poses and depth labels obtained by moving a piezoelectric stage along the optical axis. On this dataset, the paper finds that the Vision Transformer achieves the highest pose classification accuracy, exceeding 99 percent on a simple robot, while deeper residual networks generally perform best for depth regression. Neural architecture search tuned to the two tasks finds a deeper model for depth regression than for pose classification, and the paper reports that increasing the training-data fraction consistently lowers depth MSE and raises R2.
Load-bearing premise
The reported benchmark numbers assume the 232,881 images are independent samples; because depth images are captured as time sequences from a moving stage, frames recorded close together are near-duplicates, so a random frame split can let training and test sets share almost identical images and make accuracy and R2 look higher than they are.
Editorial extensions
If this is right
- If OTMR becomes the standard benchmark, new perception algorithms for optical microrobots can be compared on identical data and metrics instead of single-robot demonstrations.
- The Vision Transformer's high pose accuracy suggests transformer-based models are strong candidates for real-time closed-loop microrobot control.
- Depth regression improves with deeper architectures and with more training data, so scaling both model depth and dataset size is a promising path.
- The NAS-found depth model has more convolutional layers than the pose model, indicating that the two tasks have different optimal architectures.
- Because CAD models and benchmark code are released with the dataset, future work can build sim-to-real transfer directly on OTMR.
Reading between the lines
- A sequence-aware re-split that keeps all frames from one z-sweep in the same fold would test whether the reported accuracies and R2 values are inflated by temporal near-duplicates in the training and test sets.
- The public CAD models allow synthetic images with known pose and depth to be generated, which could test whether models trained only on OTMR transfer to unseen microrobot designs.
- The observed transfer pattern, where structurally similar robots transfer better than dissimilar ones, suggests that a quantitative measure of design similarity could predict cross-robot generalization performance.
Editorial analysis
A structured set of objections, weighed in public.
Referee Report
Summary. The paper introduces OTMR, a dataset of 232,881 optical microscopy images of 18 microrobot designs across 176 poses, collected with an optical tweezer system and a piezo stage that generates depth-varying image sequences. The authors benchmark eight deep learning models on two tasks: pose classification (pitch/roll) and depth regression, reporting that ViT achieves the highest pose accuracy, deeper architectures generally improve depth regression, NAS-optimized CNNs outperform the baseline CNN, and increasing training data size improves depth performance. The dataset, CAD models, and benchmarking code are claimed to be publicly available.
Significance. If the evaluation concerns are addressed, OTMR fills a clear gap: it is, to the authors' knowledge, the first public dataset dedicated to microrobot pose and depth perception under optical microscopy, and its scale (232,881 images, 18 designs, 176 poses) is a substantial step beyond previous single-robot studies. The paper also contributes a reproducible benchmarking suite with eight architectures, computational cost comparisons, Grad-CAM analysis, and an open release of resources. The main significance is therefore as a community resource and reference point, provided the benchmark numbers are made trustworthy through a sequence-aware evaluation protocol.
major comments (4)
- [IV.A, III.B] The five-fold cross-validation described in Section IV.A ('the dataset is evenly partitioned into five subsets') does not group frames by acquisition sequence or by pose, yet Section III.B states that images were acquired by moving the piezoelectric stage along z, generating depth-varying image sequences, and Fig. 6 shows depth evolving continuously over time. Consecutive frames in such a sequence are near-duplicates with only slightly different depth labels, so a random frame-level split allows temporally correlated images to appear in both training and test folds. This can inflate the accuracy and R2 values in Tables II and IV and can bias the model ranking and the data-scaling conclusion in Fig. 9. Please implement a sequence-aware split that keeps each z-sweep sequence (or each pose) entirely within one fold, report per-sequence or per-pose performance, and quantify the difference between frame-level and sequence-level splits.
- [IV.F, Abstract] The abstract claims that increasing the size of the training dataset leads to 'substantial improvements across both tasks', but Section IV.F only evaluates depth regression (Robot Type 8 with ResNet50, Fig. 9); no pose classification experiment with varying data size is reported. Please either add a pose-classification scaling experiment or restrict the claim to depth regression.
- [Tables II and IV] All benchmark results are reported as single averages over five folds without standard deviations, confidence intervals, or per-fold breakdowns. Several model differences are small relative to the granularity of the metrics (e.g., Robot 1 pitch accuracy: ViT 0.999 vs. VGG16 0.996; Robot 10 R2: ResNet18 0.994, ResNet50 0.994, EfficientNet 0.995). Without fold-wise variance or a significance test, the claimed rankings (ViT best for pose, deeper architectures better for depth) are not established. Please report mean ± std across folds or include per-fold results.
- [IV.D] The transfer learning experiment tests a ViT trained on Robot Type 3 directly on Robots 1, 4, and 5, with no fine-tuning and no comparison to a model trained on each target robot or to a control model. The conclusion that structural similarity and horizontal orientation determine transfer performance (Fig. 7) is therefore not supported by the data as presented. Please add baseline comparisons (e.g., per-target training) or soften the interpretation to a descriptive observation.
minor comments (5)
- [III.C.1, Fig. 5] The text says pose angles vary from 0° to 90°, but the Fig. 5 caption shows pitch and roll variations from 0° to 70°; please reconcile these numbers.
- [References] Reference [17] (the JEFF-3.3 nuclear data library) appears unrelated to the sentence it supports about data scarcity limiting model development; this is likely a citation error and should be corrected.
- [Table III] The column header 'Params (MB)' is ambiguous: parameter counts are not normally measured in megabytes. Please clarify whether this is the model file size or the parameter count, and label accordingly.
- [Conclusion] The conclusion states that ViT achieved the highest pose classification accuracy 'exceeding 99%', but Table II shows Robot 3 ViT accuracy of 0.965 (pitch) and 0.971 (roll); please qualify this claim to avoid overstatement.
- [Data Availability] The dataset is referenced only via a project website in a footnote; a persistent identifier such as a DOI or a versioned repository link would make the 'publicly available' claim more robust for reproducibility.
Circularity Check
No circularity: OTMR is an empirical dataset/benchmark paper whose pose and depth labels come from independent experimental actuation, and whose benchmark claims do not reduce to fitted inputs or self-citations.
full rationale
The paper is a dataset contribution plus empirical benchmarking, not a derivation. Pose labels are generated by physically varying pitch and roll angles from 0 to 90 degrees (Section III.C.1), and depth labels are recorded from commanded piezoelectric-stage motion along the z-axis (Sections III.B and III.C.2); these are experimental ground truths independent of the model outputs. No parameter is fitted to the benchmark targets and then re-reported as a prediction, and no equation in the paper is shown to be equivalent to its own inputs by construction. The author-overlapping citations [6], [9], [26] are used only to motivate the problem and to describe earlier methods; they are not load-bearing evidence for the dataset's validity or for the benchmark conclusions. The frame-level five-fold split described in Section IV.A, combined with the temporally correlated z-trajectory sequences described in Section III.B, is a legitimate benchmark-validity concern (possible information leakage), but it is a statistical evaluation issue rather than circularity: the reported accuracies and R2 values could be inflated without the claims reducing to fitted input. Therefore the circularity score is 0.
Assumptions & free parameters
assumptions (5)
- domain assumption Pose labels equal the intended pitch and roll angles set during fabrication and manipulation, with no independent verification of the actual physical pose.
- domain assumption Depth ground truth equals the piezo stage z-position, taken as the true vertical displacement of the microrobot.
- domain assumption The five-fold split treats individual frames as independent samples, so temporal correlation between consecutive frames in a z-sweep sequence does not leak into training.
- domain assumption Twenty training epochs and the selected learning rates are sufficient for fair comparison across architectures.
- domain assumption No prior publicly available dataset exists for microscope microrobot pose and depth perception.
Cite this review
Pith. "Pith review of A Dataset and Benchmarks for Deep Learning-Based Optical Microrobot Pose and Depth Perception." pith.science (2026). https://pith.science/paper/WNSYBUBW
@misc{pith2026250518303,
  author       = {Pith},
  title        = {Pith review of: A Dataset and Benchmarks for Deep Learning-Based Optical Microrobot Pose and Depth Perception},
  year         = {2026},
  howpublished = {\url{https://pith.science/paper/WNSYBUBW}},
  note         = {Machine review of arXiv:2505.18303}
}
read the original abstract
Optical microrobots, manipulated via optical tweezers (OT), have broad applications in biomedicine. However, reliable pose and depth perception remain fundamental challenges due to the transparent or low-contrast nature of the microrobots, as well as the noisy and dynamic conditions of the microscale environments in which they operate. An open dataset is crucial for enabling reproducible research, facilitating benchmarking, and accelerating the development of perception models tailored to microscale challenges. Standardised evaluation enables consistent comparison across algorithms, ensuring objective benchmarking and facilitating reproducible research. Here, we introduce the OpTical MicroRobot dataset (OTMR), the first publicly available dataset designed to support microrobot perception under the optical microscope. OTMR contains 232,881 images spanning 18 microrobot types and 176 distinct poses. We benchmarked the performance of eight deep learning models, including architectures derived via neural architecture search (NAS), on two key tasks: pose classification and depth regression. Results indicated that Vision Transformer (ViT) achieve the highest accuracy in pose classification, while depth regression benefits from deeper architectures. Additionally, increasing the size of the training dataset leads to substantial improvements across both tasks, highlighting OTMR's potential as a foundational resource for robust and generalisable microrobot perception in complex microscale environments.
Figures


Figures from the paper (6 more)


Forward citations
Cited by 1 Pith paper
-
Physics-Informed Machine Learning with Adaptive Grids for Optical Microrobot Depth Estimation
Fusing adaptive-grid focus metrics with ResNet features improves depth estimation accuracy and data efficiency for optical microrobots in the reported experiments.
Reference graph
Works this paper leans on
-
[1]
A revolution in optical manipulation,
D. G. Grier, “A revolution in optical manipulation,” nature, vol. 424, no. 6950, pp. 810–816, 2003
2003
-
[2]
Automated manipulation of biological cells using gripper formations controlled by optical tweezers,
S. Chowdhury, A. Thakur, P. Švec, C. Wang, W. Losert, and S. K. Gupta, “Automated manipulation of biological cells using gripper formations controlled by optical tweezers,” IEEE Transactions on Automation Science and Engineering , vol. 11, no. 2, pp. 338–347, 2013
work page 2013
-
[3]
Fabrication and optical manipulation of micro-robots for biomedical applications,
D. Zhang, Y . Ren, A. Barbot, F. Seichepine, B. Lo, Z.-C. Ma, and G.-Z. Yang, “Fabrication and optical manipulation of micro-robots for biomedical applications,” Matter, vol. 5, no. 10, pp. 3135–3160, 2022
2022
-
[4]
Optical tweezers: Phototoxicity and thermal stress in cells and biomolecules,
A. Blázquez-Castro, “Optical tweezers: Phototoxicity and thermal stress in cells and biomolecules,” Micromachines, vol. 10, no. 8, p. 507, 2019
work page 2019
-
[5]
J. Li, Z. Chen, Y . Liu, P. S. Kollipara, Y . Feng, Z. Zhang, and Y . Zheng, “Opto-refrigerative tweezers,” Science Advances , vol. 7, no. 26, p. eabh1101, 2021
work page 2021
-
[6]
Distributed force control for microrobot manipulation via planar multi-spot optical tweezer,
D. Zhang, A. Barbot, B. Lo, and G.-Z. Yang, “Distributed force control for microrobot manipulation via planar multi-spot optical tweezer,” Advanced Optical Materials , vol. 8, no. 21, p. 2000543, 2020
2020
-
[7]
Reconfigurable magnetic microrobot swarm: Multimode trans- formation, locomotion, and manipulation,
H. Xie, M. Sun, X. Fan, Z. Lin, W. Chen, L. Wang, L. Dong, and Q. He, “Reconfigurable magnetic microrobot swarm: Multimode trans- formation, locomotion, and manipulation,” Science robotics , vol. 4, no. 28, p. eaav8006, 2019
work page 2019
-
[8]
Measurement of van der waals force using oscillating optical tweezers,
A. Kundu, S. Paul, S. Banerjee, and A. Banerjee, “Measurement of van der waals force using oscillating optical tweezers,” Applied Physics Letters, vol. 115, no. 12, 2019
work page 2019
Show all 43 references
-
[9]
Micro-object pose estimation with sim-to-real transfer learning using small dataset,
D. Zhang, A. Barbot, F. Seichepine, F. P.-W. Lo, W. Bai, G.-Z. Yang, and B. Lo, “Micro-object pose estimation with sim-to-real transfer learning using small dataset,” Communications Physics, vol. 5, no. 1, p. 80, 2022
2022
-
[10]
A review on micro- scopic visual servoing for micromanipulation systems: Applications in micromanufacturing, biological injection, and nanosensor assembly,
X. Sha, H. Sun, Y . Zhao, W. Li, and W. J. Li, “A review on micro- scopic visual servoing for micromanipulation systems: Applications in micromanufacturing, biological injection, and nanosensor assembly,” Micromachines, vol. 10, no. 12, p. 843, 2019
2019
-
[11]
Reinforce- ment learning with artificial microswimmers,
S. Muiños-Landin, A. Fischer, V . Holubec, and F. Cichos, “Reinforce- ment learning with artificial microswimmers,”Science Robotics, vol. 6, no. 52, p. eabd9285, 2021
2021
-
[12]
Deep learning for visual localization and mapping: A survey,
C. Chen, B. Wang, C. X. Lu, N. Trigoni, and A. Markham, “Deep learning for visual localization and mapping: A survey,” IEEE Trans- actions on Neural Networks and Learning Systems , 2023
2023
-
[13]
Three-dimensional optical microrobot orientation estimation and tracking using deep learning,
S. Choudhary, F. Sadak, E. Gerena, and S. Haliyo, “Three-dimensional optical microrobot orientation estimation and tracking using deep learning,” Robotica, pp. 1–22, 2024
2024
-
[14]
Control of self-winding microrobot using an electromagnetic drive system: integration of movable electromagnetic coil and permanent magnet,
H. Li, Z. Zhang, X. Yi, S. Jin, and Y . Chen, “Control of self-winding microrobot using an electromagnetic drive system: integration of movable electromagnetic coil and permanent magnet,” Micromachines, vol. 15, no. 4, p. 438, 2024
2024
-
[15]
Machine learning for micro-and nanorobots,
L. Yang, J. Jiang, F. Ji, Y . Li, K.-L. Yung, A. Ferreira, and L. Zhang, “Machine learning for micro-and nanorobots,” Nature Machine Intel- ligence, vol. 6, no. 6, pp. 605–618, 2024
2024
-
[16]
Self-supervised learning methods and applications in medical imaging analysis: A survey,
S. Shurrab and R. Duwairi, “Self-supervised learning methods and applications in medical imaging analysis: A survey,” PeerJ Computer Science, vol. 8, p. e1045, 2022
2022
-
[17]
The joint evaluated fission and fusion nuclear data library, jeff-3.3,
A. J. Plompen, O. Cabellos, C. de Saint Jean, M. Fleming, A. Algora, M. Angelone, P. Archier, E. Bauge, O. Bersillon, A. Blokhin, et al. , “The joint evaluated fission and fusion nuclear data library, jeff-3.3,” The European Physical Journal A , vol. 56, pp. 1–108, 2020
2020
-
[18]
Invited review article: review of post-process optical form metrology for industrial-grade metal additive manufactured parts,
P. Stavroulakis and R. K. Leach, “Invited review article: review of post-process optical form metrology for industrial-grade metal additive manufactured parts,” Review of Scientific instruments , vol. 87, no. 4, 2016
2016
-
[19]
Different thresholding tech- niques in image processing: A review,
R. Seelaboyina and R. Vishwakarma, “Different thresholding tech- niques in image processing: A review,” in ICDSMLA 2021: Proceed- ings of the 3rd International Conference on Data Science, Machine Learning and Applications . Springer, 2023, pp. 23–29
2021
-
[20]
Image seg- mentation using morphological operations,
D. Chudasama, T. Patel, S. Joshi, and G. I. Prajapati, “Image seg- mentation using morphological operations,” International Journal of Computer Applications, vol. 117, no. 18, 2015
2015
-
[21]
Kanatani, Y
K. Kanatani, Y . Sugaya, and Y . Kanazawa, Ellipse fitting for com- puter vision: implementation and applications . Morgan & Claypool Publishers, 2016
2016
-
[22]
Optical microsphere nano-imaging: progress and challenges,
G. Wu and M. Hong, “Optical microsphere nano-imaging: progress and challenges,” Engineering, 2024
2024
-
[23]
Advancements in machine learning for microrobotics in biomedicine,
A. Salehi, S. Hosseinpour, N. Tabatabaei, M. Soltani Firouz, N. Zade- bana, R. Nauber, and M. Medina-Sánchez, “Advancements in machine learning for microrobotics in biomedicine,” Advanced Intelligent Sys- tems, p. 2400458, 2024
2024
-
[24]
An accurate perception method for low contrast bright field microscopy in heterogeneous microenvironments,
K. Rajasekaran, E. Samani, M. Bollavaram, J. Stewart, and A. G. Banerjee, “An accurate perception method for low contrast bright field microscopy in heterogeneous microenvironments,” Applied Sciences , vol. 7, no. 12, p. 1327, 2017
2017
-
[25]
Three-dimensional pose estimation of optically transparent microrobots,
M. Grammatikopoulou and G.-Z. Yang, “Three-dimensional pose estimation of optically transparent microrobots,” IEEE Robotics and Automation Letters, vol. 5, no. 1, pp. 72–79, 2019
2019
-
[26]
Data-driven microscopic pose and depth estimation for optical microrobot manipulation,
D. Zhang, F. P.-W. Lo, J.-Q. Zheng, W. Bai, G.-Z. Yang, and B. Lo, “Data-driven microscopic pose and depth estimation for optical microrobot manipulation,” Acs Photonics , vol. 7, no. 11, pp. 3003– 3014, 2020
2020
-
[27]
Finer features for functional microdevices,
S. Kawata, H.-B. Sun, T. Tanaka, and K. Takada, “Finer features for functional microdevices,” Nature, vol. 412, no. 6848, pp. 697–698, 2001
2001
-
[28]
Sculpting the object,
J. Glückstad, “Sculpting the object,” Nature Photonics, vol. 5, no. 1, pp. 7–8, 2011
2011
-
[29]
Numerical modelling of optical trapping,
T. A. Nieminen, H. Rubinsztein-Dunlop, N. R. Heckenberg, and A. Bishop, “Numerical modelling of optical trapping,” Computer Physics Communications, vol. 142, no. 1-3, pp. 468–471, 2001
2001
-
[30]
Two-dimensional signal and image processing,
J. S. Lim, “Two-dimensional signal and image processing,” Englewood Cliffs, 1990
1990
-
[31]
A computational approach to edge detection,
J. Canny, “A computational approach to edge detection,” IEEE Trans- actions on pattern analysis and machine intelligence , no. 6, pp. 679– 698, 1986
1986
-
[32]
Very deep convolutional networks for large-scale image recognition,
K. Simonyan, “Very deep convolutional networks for large-scale image recognition,” arXiv preprint arXiv:1409.1556 , 2014
2014 arXiv
-
[33]
Deep residual learning for image recognition,
K. He, X. Zhang, S. Ren, and J. Sun, “Deep residual learning for image recognition,” in Proceedings of the IEEE Conference on Computer Vision and Pattern Recognition , 2016, pp. 770–778
2016
-
[34]
Efficientnet: Rethinking model scaling for convolutional neural networks,
M. Tan and Q. V . Le, “Efficientnet: Rethinking model scaling for convolutional neural networks,” 2020. [Online]. Available: https://arxiv.org/abs/1905.11946
2020 arXiv
-
[35]
Mobilenetv2: Inverted residuals and linear bottlenecks,
M. Sandler, A. Howard, M. Zhu, A. Zhmoginov, and L.-C. Chen, “Mobilenetv2: Inverted residuals and linear bottlenecks,” 2019. [Online]. Available: https://arxiv.org/abs/1801.04381
2019 arXiv
-
[36]
An image is worth 16x16 words: Transformers for image recognition at scale,
A. Dosovitskiy, “An image is worth 16x16 words: Transformers for image recognition at scale,” arXiv preprint arXiv:2010.11929 , 2020
2010 arXiv
-
[37]
Optuna: A next-generation hyperparameter optimization framework,
T. Akiba, S. Sano, T. Yanase, T. Ohta, and M. Koyama, “Optuna: A next-generation hyperparameter optimization framework,” in Pro- ceedings of the 25th ACM International Conference on Knowledge Discovery & Data Mining , 2019, pp. 2623–2631
2019
-
[38]
Torchvision: Pytorch’s computer vision library
“Torchvision: Pytorch’s computer vision library.” [Online]. Available: https://github.com/pytorch/vision
-
[39]
Imagenet: A large-scale hierarchical image database,
J. Deng, W. Dong, R. Socher, L.-J. Li, K. Li, and L. Fei-Fei, “Imagenet: A large-scale hierarchical image database,” in 2009 IEEE conference on computer vision and pattern recognition . Ieee, 2009, pp. 248–255
2009
-
[40]
Grad-cam: Visual explanations from deep networks via gradient-based localization,
R. R. Selvaraju, M. Cogswell, A. Das, R. Vedantam, D. Parikh, and D. Batra, “Grad-cam: Visual explanations from deep networks via gradient-based localization,” in Proceedings of the IEEE international conference on computer vision , 2017, pp. 618–626
2017
-
[41]
Digital twin modeling,
F. Tao, B. Xiao, Q. Qi, J. Cheng, and P. Ji, “Digital twin modeling,” Journal of Manufacturing Systems , vol. 64, pp. 372–389, 2022
2022
-
[42]
Generative adversarial net- works,
I. Goodfellow, J. Pouget-Abadie, M. Mirza, B. Xu, D. Warde-Farley, S. Ozair, A. Courville, and Y . Bengio, “Generative adversarial net- works,” Communications of the ACM , vol. 63, no. 11, pp. 139–144, 2020
2020
-
[43]
Diffusion models in vision: A survey,
F.-A. Croitoru, V . Hondru, R. T. Ionescu, and M. Shah, “Diffusion models in vision: A survey,” IEEE Transactions on Pattern Analysis and Machine Intelligence , vol. 45, no. 9, pp. 10 850–10 869, 2023
2023
Reviewed August 7, 2026 · model on record in the stance chip above.
Discussion (0). Sign in to comment.