REVIEW 4 major objections 8 minor 2 references
Pan-tropical plant functional trait variation from space
T0 review · 4 major / 8 minor · reviewed 2026-08-07 · deepseek-v4-flash
Pith's one-line read Using the PRISMA spaceborne imaging spectrometer, this paper provides the first consistent pan-tropical view of leaf economics spectrum traits, showing that the tropical moist forests of Africa, Asia, and the Americas occupy different…
desk verdict The paper delivers a genuinely new pan-tropical trait dataset and a plausible continental signal, but the NEON-to-tropics calibration transfer is the soft spot a referee should probe. read the letter →
The pith
A machine-rendered reading of the paper's core claim, the machinery that carries it, and where it could break.
The reading
What carries the argument
The mechanism is PRISMA, a spaceborne imaging spectrometer launched by the Italian Space Agency, acquiring 30 x 30 km scenes at 30 m resolution with 239 spectral channels from 400 to 2500 nm. Pixels are co-added into 120 m superpixels to raise signal-to-noise; surface reflectance is derived via radiative transfer; and leaf mass per area, nitrogen, and chlorophyll are retrieved with partial least squares regression models trained on NEON sites spanning temperate to Hawaiian tropical vegetation. Functional diversity is measured as the area of a convex hull enclosing 75% of the data in standard-deviation-scaled LMA–nitrogen space, and topography is indexed by the standard deviation of elevation within each scene. The central object is the leaf economics spectrum itself, retrieved consistently from the upper sunlit canopy, which allows cross-continental comparison unmediated by plot networks.
What would settle it
Collect in situ upper-canopy leaf trait data (LMA, nitrogen, chlorophyll) from African and Asian tropical forests along topographic gradients and compare them with coincident PRISMA retrievals; if the retrieved continental differences—especially Africa's narrow amplitude—do not reproduce the field-measured trait ranges and their topographic relationships, the reported continental separation is an artifact of calibration transfer or atmospheric correction rather than biology.
Extended reading notes
Core claim
The paper's central claim is that the three tropical continents show somewhat different, though strongly overlapping, leaf economics spectrum trait distributions when sampled consistently from space. The Americas always have the highest amplitude in trait variation, Africa the lowest; the continents differ markedly in leaf mass per area and chlorophyll distributions, and are more similar in nitrogen content. A linear relationship between topographic diversity (the standard deviation of elevation within a scene) and scene-level functional diversity explains about half of the observed global range in functional diversity ($R^2 = 0.48$). The authors conclude that tropical forests should not be treated as functional replicates on three continents, and that landforms play a major role in the development and maintenance of diverse strategies.
Load-bearing premise
The PLSR trait retrieval models, trained mostly on temperate NEON sites with a single Hawaiian tropical site, produce unbiased trait estimates when applied to pan-tropical PRISMA spectra, so that residual atmospheric, canopy-structural, and sun-sensor geometry effects do not vary systematically by continent.
Editorial extensions
If this is right
- Tropical moist forests should be represented in models by more than one or a few functional types; continental differences in trait distributions and LES relationships imply different accessible response ranges to environmental change.
- Upscaling trait estimates from sparse plot networks will alias local topographic variation into continental patterns; about half of functional diversity variation is associated with landforms, so sampling and covariates must capture elevation gradients.
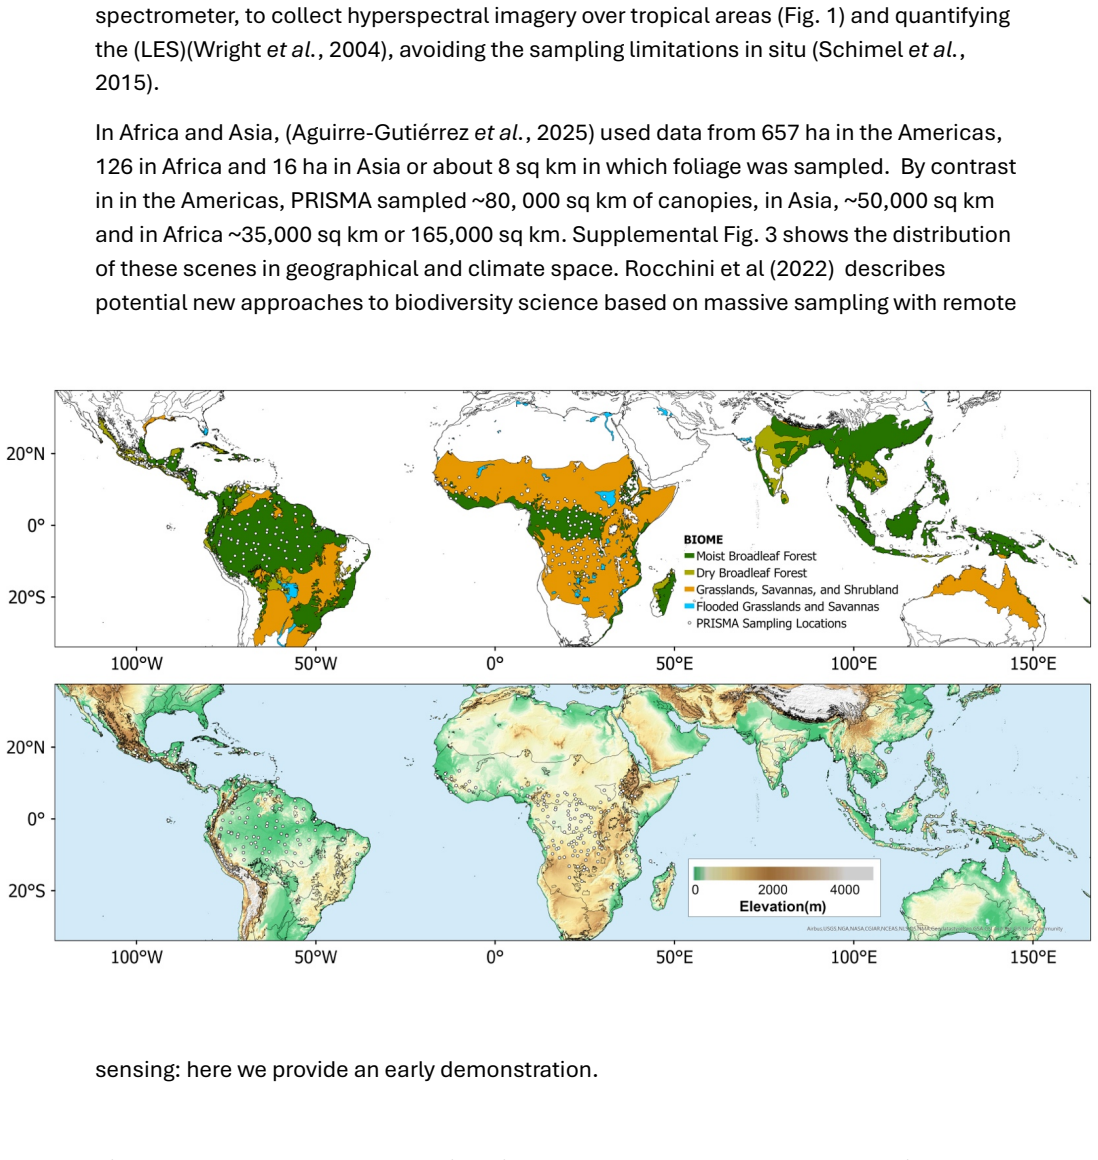
- Spaceborne imaging spectrometers can provide a consistent, large-area baseline for functional traits and functional diversity, sampling roughly five orders of magnitude more area than existing plot compilations and enabling seasonal and long-term monitoring with future sensors.
- Functional diversity saturates after combining roughly 10–20 scenes (9,000–18,000 square kilometers), and continental functional diversity patterns parallel known species-diversity gradients, with Africa lowest.
- Differences in pNUE (chlorophyll-to-nitrogen ratio) suggest continents differ in nitrogen allocation to photosynthesis versus other uses, potentially reflecting defense strategies.
Reading between the lines
- If topography drives roughly half of functional diversity, mountainous tropical regions such as the Andes and Southeast Asian archipelagos may respond to climate change through range-shift constraints and local adaptation rather than simple migration of trait distributions; this is a testable prediction for species distribution models.
- The paper leaves open the role of herbivory; because LES traits link to food quality and leaf toughness, one could test whether continental differences in herbivore pressure select for the observed pNUE and LMA patterns using trait data from exclosure or herbivore-density gradients.
- The saturation of functional diversity at roughly 10–20 scenes suggests an efficient sampling design for future spectroscopy missions: fewer, well-placed scenes across topographic gradients may capture most functional diversity, an implication the authors did not draw explicitly.
- Continental differences in trait amplitude could also be tested against independent spaceborne sensors (e.g., EMIT or future SBG) to verify that the patterns are not sensor-specific; such cross-sensor consistency would strengthen the claim that continents are not functional replicates.
Signed reviews
Editorial analysis
A structured set of objections, weighed in public.
Referee Report
Summary. This manuscript uses PRISMA spaceborne imaging spectroscopy to retrieve leaf traits (leaf mass per area, nitrogen, and chlorophyll) across the tropical moist forest biome on three continents, covering roughly 1% of the biome. The authors calibrate partial least squares regression models using NEON data that are mostly temperate plus one Hawaiian tropical site, apply these models to pan-tropical PRISMA scenes, and report that tropical forests in Asia, Africa, and the Americas occupy different parts of the leaf economics spectrum, with Africa showing the least variation and the Americas the most. They further report that topographic variation within scenes explains about half of the variation in their scene-level functional diversity metric, and that functional diversity scales with area similarly to species diversity, saturating at roughly 10-20 scenes. The paper concludes that tropical continents should not be treated as functional replicates and that orography plays a major role in maintaining functional diversity.
Significance. If the trait retrievals are unbiased across continents, this study represents a very significant scaling advance: it provides the first pan-tropical, satellite-based view of functional traits at a sampling density orders of magnitude greater than plot networks, with a clear commitment to open data. The paper also makes a concrete, falsifiable claim (continental trait distributions differ; topography explains ~50% of functional diversity) that can be tested as spectroscopic missions with better calibration data become available. The authors are transparent about the limitations of their training data and validation, and the PLSR calibration shows standard internal validations. However, the central scientific claim depends on transferability of a temperate/Hawaiian calibration to tropical canopies, and for that the evidence is currently thin; the single-continent, non-coincident, outlier-curtailed Peru comparison does not resolve the risk that continental differences are retrieval artifacts.
major comments (4)
- [Materials and Methods, Trait Retrieval Methods; Table 2] The PLSR models are trained on NEON AOP spectra aggregated to 120 m and applied to PRISMA scenes across the pan-tropics, but the training sites include only one tropical site (Pu'u maka'ala, Hawai'i). The text acknowledges this limitation, but the continental comparisons in Figs. 3-5 and 7 depend entirely on the assumption that residual retrieval errors do not differ systematically by continent. Atmospheric correction, canopy structure, sun-sensor geometry, and background composition can all vary systematically between temperate NEON scenes and tropical PRISMA scenes, and among the three tropical continents. As written, the Evidence for transferability is internal NEON validation and a single non-coincident comparison in Peru. I do not see a load-bearing demonstration that retrieval bias is approximately equal across Amazonia, Africa, and Southeast Asia. The authors need to address this directly, for example by (i) withholding the Hawaiian site and testing whether it lies on the same calibration surface, (ii) comparing retrievals in overlapping areas against independent airborne or field data on more than one continent, or (iii) performing a synthetic scene experiment that quantifies how known atmospheric/structural differences propagate to trait estimates. Without such evidence, the statement that the three continents occupy different parts of trait space (Results and Discussion) remains an unsupported assumption about the model residuals.
- [Materials and Methods, Evaluating bias and uncertainty; Figure 2] The Peru validation is the only tropical ground-truth comparison, and it applies two exclusion steps: 'excluded occurrences of anomalously low chlorophyll content and excluded all outliers above a z-score of 3 as these result from incompletely corrected atmospheric effects (Townsend, pers comm)'. This is concerning because the excluded pixels may be exactly the pixels carrying systematic retrieval bias, and the exclusion is justified by an unpublished personal communication rather than by an a priori rule or a direct sensitivity analysis. The comparison to the Asner and TRY distributions is also only qualitative; no overlap statistic or error metric is given. The authors should report the validation without exclusions as a sensitivity case, quantify the agreement with a standard test (e.g., Kolmogorov-Smirnov or a distribution overlap measure), and either replace the personal communication with a published reference or show that the exclusion does not materially affect the continental comparisons.
- [Results and Discussion, Figure 7; Materials and Methods, Functional diversity] The claim that topography explains about half of the observed range in functional diversity is based on a regression of median functional diversity on medians of within-scene elevation standard deviation, with R^2 = 0.48. This statistic does not account for uncertainty in either the trait retrievals or the functional-diversity estimates, and smoothing into bins can inflate apparent explained variance. The trait retrieval precisions cited in the text (25%, 24%, 20% for LMA, N, chlorophyll) are not propagated into the continental distribution comparisons, the LES regressions, or the FD-topography regression. The authors should propagate retrieval uncertainty into the reported statistics or provide a null-model analysis showing that the observed continental differences and the FD-topography relationship are not an artifact of retrieval noise. Without this, the quantitative strength of the central claims is not established.
- [Results and Discussion, Continental comparisons and pNUE] The interpretation of pNUE (chlorophyll:magnesium) as 'investment of a key nutrient in growth' and the statements about Africa 'compensating' by allocating proportionately more N to chlorophyll are made without direct physiological validation from the retrieved data. The pNUE index is a ratio of two retrieved traits, and retrieval errors that are correlated across bands or traits could create artificial differences in this ratio among continents. Given that the PLSR calibration did not include a pNUE target, the authors should either acknowledge the ratio's construction explicitly in the interpretation or test whether the continental pNUE patterns are robust to retrieval error, for example by comparing pNUE from PRISMA with coincident field measurements in at least one region.
minor comments (8)
- [Abstract] There is a typo: 'Informaiton' in the first sentence should be 'Information'.
- [Abstract] The final sentence of the abstract is grammatically incomplete: 'Knowledge of trait variation, and its environmental can inform models...' should likely be 'Knowledge of trait variation and its environmental controls can inform models...'.
- [Materials and Methods, PRISMA instrument] The paragraph describing superpixel SNR contains a duplicate sentence: 'While PRISMA's achieved signal-to-noise ratio (SNR) often exceeds the nominal values shown in Table 1 (Buongiorno et al., 2021), confident retrieval of plant traits requires high SNR (Raiho et al., 2023a).' appears twice with only a minor wording difference. One occurrence should be removed.
- [Materials and Methods, Evaluating bias and uncertainty] The text cites 'Thompson, pers comm' and 'Townsend, pers comm' for the precision estimates and outlier exclusion, but personal communications are not listed in the references. The authors should either provide a formal citation or move these to acknowledgments with the permission of those researchers.
- [Results and Discussion, first paragraph] The phrase 'The three continents show somewhat different, though strongly overlapping LES trait distributions' is repeated in the abstract and later in the text; consider varying the wording to avoid redundancy.
- [Figure 7] The figure axis label reads 'Functinal diversity (sd 2)' and should be corrected to 'Functional diversity (sd 2)'.
- [Materials and Methods, Functional diversity] The description of the convex hull threshold says it captures '75% of the datapoints' but the abridgement 'as the area of a convex hull encompassing (all) the minimal area(s) capturing 75% of the datapoints' is confusing; a more precise definition or a reference to Schneider et al. (2023) would help.
- [References] The reference list is generally well curated, but the reference to 'Asner et al. 2017a' and 'Asner et al. 2017b' appears twice for the same paper; the duplicated entry should be removed or renumbered.
Circularity Check
No significant circularity: trait retrievals are calibrated on external NEON field/AOP data and validated against Peruvian in-situ compilations; the continental and topographic comparisons are downstream empirical analyses, not assumed by the retrieval model.
full rationale
The paper's derivation chain is not circular. Trait values are produced by PLSR models trained on NEON canopy trait maps and spectra (Wang et al. 2020; Keller et al. 2008) and applied to PRISMA reflectance; the calibration target is external to the tropical comparison. The two validation routes—held-out NEON pixels and Peruvian in-situ data (Asner et al. 2017; TRY/Kattge et al. 2020)—provide independent checks, even if not spatially and temporally coincident. The continental trait-distribution comparisons and the FD-topography regression (R2 = 0.48) are empirical outputs of those retrievals; nothing in the PLSR construction, the pNUE ratio definition, or the functional-richness metric presupposes that continents differ or that topography explains half the variance. The paper explicitly acknowledges limitations—one Hawaiian tropical training site, non-coincident Peruvian validation, and exclusion of outliers attributed to atmospheric effects—but these are transfer-bias and uncertainty concerns, not circular reduction of conclusions into inputs. Self-citations (e.g., Raiho et al. 2023a,b; Schneider et al. 2023; Schimel et al. 2015, 2019) are methodological or contextual prior work with independent content and do not carry the central claim by construction. No equation defines the conclusions in terms of the fitted parameters, and no fitted parameter is renamed as a prediction. Hence score 0.
Assumptions & free parameters
free parameters (5)
- PLSR latent variable counts for LMA, N, and chlorophyll =
chosen by PRESS minimization, not reported in the preprint
- Vegetation cover threshold for pixel retention =
90%
- Z-score outlier threshold in Peru validation =
3
- Functional diversity hull threshold =
75% of data points
- Superpixel size =
120 m (4x4 pixels)
assumptions (3)
- domain assumption NEON spectra-trait relationships generalize to tropical forest canopies.
- domain assumption PRISMA reflectance after atmospheric correction is comparable to NEON AOP reflectance used in training.
- domain assumption Retrieved upper-canopy traits are comparable to in-situ leaf traits for validation.
Cite this review
Pith. "Pith review of Pan-tropical plant functional trait variation from space." pith.science (2026). https://pith.science/paper/JEVTTPOT
@misc{pith2026250519199,
  author       = {Pith},
  title        = {Pith review of: Pan-tropical plant functional trait variation from space},
  year         = {2026},
  howpublished = {\url{https://pith.science/paper/JEVTTPOT}},
  note         = {Machine review of arXiv:2505.19199}
}
read the original abstract
Plant functional trait variation in tropical forests is central to predicting ecosystem responses to change. Informaiton on traits is limited relative to the diversity of climate, landforms, disturbance regimes and species present. These traits are central to modeled predictions of ecosystem change. We used a new spaceborne imagining spectrometer from the Italian Space Agency to sample roughly 1% of the tropical moist forest biome for traits along the Leaf Economics Spectrum, as well as data to contrast them with adjacent biomes. we used these data to examine LES traits between tropical moist forests on three continents. Knowledge of trait variation and its environmental controls can inform models of ecosystem response in a changing environment, allowing biological detail in models of biophysical and biogeochemical processes.
Figures
Reference graph
Works this paper leans on
-
[1]
superpixels
Jet Propulsion Lab, California Institute of Technology, Pasadena, CA 91101 2) University of Maryland, Department of Geographical Sciences, College Park, MD 20742 3) Goddard Space Flight Center, 8800 Greenbelt Road, Greenbelt, Maryland 20771 4) University of Wisconsin, Russell Labs, 1630 Linden Drive, Madison, WI 53706 5) Aarhus University, Ny Munkegade 11...
2022
-
[2]
Level 1 and 2 30m radiance and reflectance are available from ASI: https://www.asi.it/en/earth-science/prisma/ 2) Level 3 (gridded reflectance) will be available at the time of publication at the Oak Ridge Distributed Active Access Center: https://daac.ornl.gov/ 3) Level 4 (gridded plant functional traits) along with location and elevation, will be availabl...
Reviewed August 7, 2026 · model on record in the stance chip above.
Discussion (0). Continue with ORCID to comment.