REVIEW 3 major objections 3 minor 100 references
The Quasar-associated 2175 \AA\ Dust Absorbers in the SDSS DR16 Quasar Catalog
T0 review · 3 major / 3 minor · reviewed 2026-08-07 · deepseek-v4-flash
Pith's one-line read The paper claims that 843 quasar-associated 2175 Å dust absorbers show a statistically significant decline in bump strength with redshift, which would imply dust evolution in quasar environments.
desk verdict Valuable catalog, real sample, but the two headline claims—weak bump strengths and the redshift decline—need normalization and bias corrections before they can be believed. read the letter →
The pith
A machine-rendered reading of the paper's core claim, the machinery that carries it, and where it could break.
The reading
What carries the argument
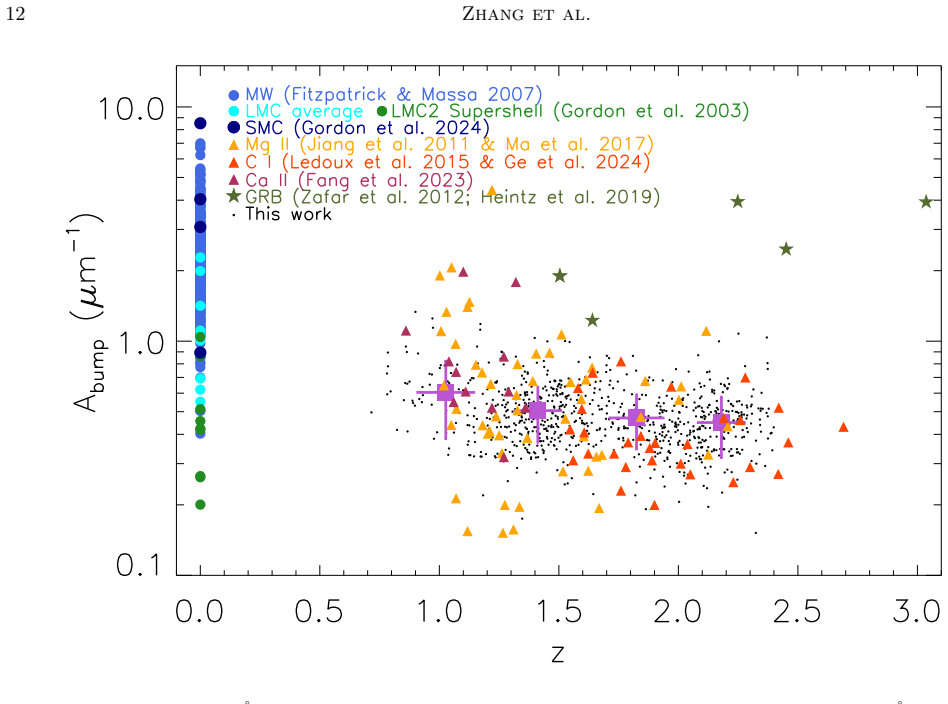
The argument runs on a parametric extinction-curve fit in inverse wavelength $x=\lambda^{-1}$, following a standard Fitzpatrick–Massa form $A(\lambda)=c_1+c_2x+c_3D(x,x_0,\gamma)$, where the 2175 Å feature is modelled by a Drude profile $D(x,x_0,\gamma)=x^2/((x^2-x_0^2)^2+x^2\gamma^2)$ with peak position $x_0$, width $\gamma$, and bump strength $A_{\rm bump}=\pi c_3/2\gamma$. The observed spectrum is compared with a fixed quasar composite (optical composite plus near-infrared extension), so the derived extinction and $A_{\rm bump}$ are unnormalized. A three-stage least-squares procedure fits the linear extinction first, then the bump parameters, then rejects $>3\sigma$ outliers and refits; because continuum features like broad Fe II emission can mimic a bump, each candidate is tested against control quasar spectra at similar redshift and only $>3\sigma$ detections are kept. The key comparison that carries the redshift-evolution claim is the distribution of the fitted $A_{\rm bump}$ against quasar redshift, with completeness caveats at low redshift and near $z\sim1.7$ documented in the same section.
What would settle it
Recover the bump strength from simulated quasar spectra that have a known Drude bump injected and then run them through the same pipeline at many redshifts; if the recovery of $A_{\rm bump}$ varies with redshift, the claimed trend is an artifact. A simpler check is to recompute the Spearman correlation using only absorbers whose rest-frame coverage brackets the entire bump on both sides; if the null probability rises above $10^{-3}$, the evolutionary claim would not survive.
Extended reading notes
Core claim
The paper's central discovery is that quasar-associated 2175 Å dust absorbers are common enough to be studied statistically, and their fitted Drude-bump parameters evolve with redshift. From 843 absorbers in the range $0.7\le z\le2.4$, the authors derive mean bump strength $A_{\rm bump}=0.49\pm0.15\,\mu m^{-1}$ and width $\gamma=0.81\pm0.14\,\mu m^{-1}$, with peak positions $\lambda^{-1}=x_0$ spread from 4.2 to $4.84\,\mu m^{-1}$; the average extinction curve is LMC-like but shallower. A Spearman correlation between bump strength and redshift has null probability $Pr\sim10^{-10}$, and the binned trend has slope $-0.13$, which the paper interprets as grains growing or otherwise changing in quasar environments at later cosmic epochs. The paper also finds that over one third of the absorbers reside in BAL quasars, and that in those systems the bump peaks at systematically lower $x_0$, a shift it attributes to environmental differences in dust grain properties.
Load-bearing premise
The whole redshift-evolution result depends on the assumption that the measured bump strength means the same thing at every redshift, even though the observed wavelength window and the quasar selection both change sharply across the sample's redshift range.
Editorial extensions
If this is right
- With 843 confirmed absorbers, quasar-associated 2175 Å dust can be compared across redshift bins, something the roughly 18 earlier detections could not support.
- If the $A_{\rm bump}$–$z$ correlation is unbiased, dust in quasar environments was systematically different at $z\sim2.4$ than at $z\sim0.7$, meaning quasar hosts participate in dust evolution rather than always destroying the bump carriers.
- The excess of BAL quasars among the absorbers (more than a third, versus typical optically selected fractions) connects the 2175 Å feature to outflow activity, with BAL bumps peaking at lower $x_0$.
- The average LMC-like but shallower extinction curves provide a local benchmark for dust models of quasar environments and imply the strong Milky Way-type bump is not typical there.
Reading between the lines
- Editorial inference: the redshift trend could be tested against selection effects by computing the recovery fraction of injected synthetic bumps as a function of $z$; if recovery declines at high $z$, part of the $Pr\sim10^{-10}$ signal would be an artifact.
- Editorial inference: because the paper's own completeness notes show fewer detections at $z<1.2$ and a dip near $z\sim1.7$, combining the quasar-associated sample with the authors' forthcoming intervening-absorber sample would provide an independent check of whether bump strength genuinely rises toward the local universe.
- Editorial inference: a photometry-only search for reddened quasars missed by SDSS target selection could test whether the absence of very strong bumps in quasar-associated absorbers is physical or a selection effect, since heavily reddened quasars are underrepresented.
Editorial analysis
A structured set of objections, weighed in public.
Referee Report
Summary. The paper presents a systematic search for 2175 \AA absorption bumps in the spectra of 557,674 SDSS DR16 quasars at 0.7 \leq z \leq 2.4. The analysis fits each quasar with a reddened composite plus a Drude profile, applies a 3\sigma significance test against control spectra, and reports 843 quasar-associated absorbers. The paper reports mean bump strength Abump = 0.49 \pm 0.15 \um^-1, width gamma = 0.81 \pm 0.14 \um^-1, peak positions x0 = 4.2 to 4.84 \um^-1, an over-representation of BAL quasars, BAL-dependent peak shifts, and a statistically significant negative correlation between Abump and redshift (Spearman Pr \approx 10^-10), interpreted as dust evolution.
Significance. If robust, the catalog is a major enlargement (roughly 50x) of known quasar-associated 2175 Angstrom absorbers and would provide a homogeneous sample for studying dust in quasar environments. The paper uses an established pair/composite method, a control-sample significance estimator, explicit masking of strong lines, and it recovers 12 of 18 previously known absorbers, which are notable strengths. However, the headline quantitative claims, namely weak bump strength relative to the Milky Way and the redshift evolution of Abump, currently rest on unnormalized measurements and on completeness/coverage effects that the authors acknowledge but do not quantitatively correct. The significance of the scientific conclusions is therefore lower than presented.
major comments (3)
- [Section 4, Figure 6 (with Figure 2)] The claim of a redshift evolution of bump strength is not supported by the presented analysis because the measurement is not corrected for the strong redshift dependence of rest-frame wavelength coverage and detection completeness. At z \approx 0.7 the BOSS window covers only to x \approx 4.78 \um^-1 on the blue side of the 2175 Angstrom feature, while at z \approx 2.4 it reaches x \approx 9.55 \um^-1; a Drude profile with a truncated blue wing is degenerate with the linear slope c2 and biases the fitted c3, x0, and gamma. The authors themselves document a detection-rate deficit at z < 1.2 and a dip at z \approx 1.7 (Figure 2), and no completeness or bias correction is applied to the binned means and Spearman test in Figure 6. Because detection probability at fixed true Abump is expected to increase with redshift as more of the bump becomes covered, the observed negative slope (and its Pr \approx 10^-10) can arise as a selection artifact. An injection-recovery calibration using synthetic bumps embedded in real quasar spectra is required before the evolutionary interpretation can be accepted.
- [Section 3 and Section 4] The comparison of the measured mean Abump = 0.49 \pm 0.15 \um^-1 with the Milky Way value Abump = 2.48 \pm 1.15 \um^-1 is not well posed. In Section 3 the authors correctly state that their Abump is an unnormalized relative quantity, whereas the Fitzpatrick & Massa (2007) and Gordon et al. (2003) values are normalized to E(B-V) or to a conventional extinction curve. With no normalization or stated relative-to-continuum definition, the abstract and summary statements that these absorbers exhibit weak bump strengths and that the curves resemble an LMC-like but shallower extinction curve do not follow from the data. The authors should either define an appropriate normalization or rephrase the claim as a relative comparison between quasar-associated absorbers at different redshifts, not as an absolute comparison with Local Group measurements.
- [Section 4, Figure 5] The reported peak-position difference between BAL and non-BAL quasars is confounded by the hard lower boundary x0 = 4.2 \um^-1 imposed in fitting. The authors note that a substantial fraction of the sample clusters at x0 = 4.2 to 4.36 \um^-1 and that this clustering may not fully reflect the true distribution; because the BAL subsample is preferentially found at low x0, the comparison in Figure 5 is affected by the same truncation. The physical interpretation of larger PAH molecules in BAL quasars is therefore premature until the x0 boundary and its effect on the BAL/non-BAL comparison are modeled or otherwise accounted for.
minor comments (3)
- [Section 3] Please state the exact parameter bounds and priors for x0 and gamma, including the x0 = 4.2 lower limit mentioned only in Section 4, and provide the full masking list, so that the fitting procedure can be reproduced from the text.
- [Abstract and Table 1] The units reported for Abump appear to be inconsistent: since Abump is defined as the integral of c3 times the Drude profile over x, the natural units are mag \um^-1 rather than \um^-1 as written in the abstract and table.
- [Figure 6] Please report the Spearman rank correlation coefficient and the uncertainty on the fitted slope, rather than only the null probability; the four binned means with a slope of -0.13 are not presented as a formal fit and their uncertainties are not given.
Circularity Check
No significant circularity: the paper is an empirical template-fit catalog, and its central claims are measured correlations rather than derivations that reduce to their inputs.
full rationale
The derivation chain is: composite spectra (Vanden Berk 2001; Glikman 2006) are reddened by the Fitzpatrick-Massa parameterization; each quasar spectrum is fit with linear plus Drude terms; candidates are screened by a control-sample 3-sigma significance test; fitted bump parameters are then summarized and correlated with redshift. Each stage is a measurement, not a derivation. The 3-sigma threshold is supported by a self-cited prior simulation study (Zhang et al. 2015), but that study is an externally published, independent simulation not fitted to this sample, so it is real evidence rather than a circular load. The paper explicitly records its measurement limitations (x0=4.2 fit boundary, low detection rate at z<1.2, the dip near z~1.7, and SDSS selection against red quasars), and the unnormalized Abump is not comparable to normalized MW values; these are validity and comparability concerns, not circular reductions. No equation or fitted parameter in the paper is equivalent by construction to the claimed output, so the paper is not circular in the sense defined here.
Assumptions & free parameters
free parameters (6)
- c1, intercept of the relative extinction curve =
per quasar, e.g., 7.19 to 9.47 mag in Table 1
- c2, linear slope of the relative extinction curve =
per quasar, e.g., -0.17 to +0.37 um in Table 1
- c3, Drude bump amplitude =
per quasar, 0.14 to 0.40 mag in Table 1 excerpts
- x0, Drude peak position =
fitted within 4.20 to 4.84 um^-1
- gamma, Drude width =
fitted within about 0.54 to 0.99 um^-1
- per-quasar photometric recalibration polynomial =
three coefficients per quasar from a second-order polynomial
assumptions (6)
- domain assumption The Vanden Berk et al. (2001) optical plus Glikman et al. (2006) NIR composite is an adequate unreddened template for every quasar up to a linear correction c1+c2x.
- domain assumption Residuals that survive the linear correction and resemble a Drude profile are dust extinction rather than Fe II or other line artifacts.
- domain assumption The DR16Q catalog redshifts are correct and correspond to the dust location.
- domain assumption The Fitzpatrick and Massa (2007) parametric form, with the FUV c4 term dropped, describes quasar extinction over the observed window.
- domain assumption Control quasars have the same intrinsic SED distribution as absorber quasars, so subtracting control-sample average curves yields an unbiased average extinction curve.
- standard math The Schlegel et al. (1998) dust map with the Fitzpatrick (1999) reddening curve correctly removes Galactic foreground extinction.
Cite this review
Pith. "Pith review of The Quasar-associated 2175 \AA\ Dust Absorbers in the SDSS DR16 Quasar Catalog." pith.science (2026). https://pith.science/paper/JI2WTYCY
@misc{pith2026250520706,
  author       = {Pith},
  title        = {Pith review of: The Quasar-associated 2175 \AA\ Dust Absorbers in the SDSS DR16 Quasar Catalog},
  year         = {2026},
  howpublished = {\url{https://pith.science/paper/JI2WTYCY}},
  note         = {Machine review of arXiv:2505.20706}
}
abstract
We present, for the first time, a systematic study of quasar-associated 2175 \AA\ dust absorbers using spectroscopic data from the Sloan Digital Sky Survey (SDSS) Data Release 16 (DR16). By analyzing the optical spectra and multi-band magnitudes of 557,674 quasars in the redshift range of $0.7 \le z \le 2.4$, we identify 843 absorbers that share the same redshifts as quasars and are believed to originate from dust in the quasar nuclei, the host galaxies, or their surrounding environments. These absorbers exhibit weak bump strengths ($A\rm_{bump}=0.49\pm0.15~\mu m^{-1}$) and narrow widths ($\gamma\rm=0.81\pm0.14~\mu m^{-1}$), while their peak positions span a broad range from $x_0 = 4.2$ to $4.84~ \mu m^{-1}$. Their average extinction curves resemble those of the Large Magellanic Cloud (LMC) but exhibit a shallower slope. In broad absorption line (BAL) quasars, the absorption bumps show systematic shifts in peak positions. Although further confirmation is needed, this may suggest environmental differences in dust grain properties. We find a statistically significant negative correlation between bump strength and redshift, suggesting possible evolution in dust properties. These findings highlight the changing composition and physical conditions of dust in quasar environments, likely influenced by factors such as metallicity, radiation fields, and dust processing mechanisms. Future studies incorporating ultraviolet and infrared data will be essential for refining the dust evolution models. Machine learning techniques and high-resolution spectroscopic follow-ups could enhance sample completeness and provide deeper insights into the chemical properties of the dust absorbers.
Figures


Figures from the paper (3 more)


Reference graph
Works this paper leans on
-
[1]
doi:10.1088/0004-637X/736/2/82
Alonso-Herrero, A., Ramos Almeida, C., Mason, R., et al.\ 2011, , 736, 82. doi:10.1088/0004-637X/736/2/82
-
[2]
Anand, A., Nelson, D., & Kauffmann, G.\ 2021, , 504, 65. doi:10.1093/mnras/stab871
-
[3]
doi:10.1146/annurev.aa.31.090193.002353
Antonucci, R.\ 1993, , 31, 473. doi:10.1146/annurev.aa.31.090193.002353
arXiv 1993
- [4]
-
[5]
L., & Gry, C.\ 1994, , 284, 956
Boulanger, F., Prevot, M. L., & Gry, C.\ 1994, , 284, 956
1994
-
[6]
Bregman, J. & Temi, P.\ 2005, , 621, 831. doi:10.1086/427738
-
[7]
doi:10.1051/0004-6361/201219405
Buat, V., Noll, S., Burgarella, D., et al.\ 2012, , 545, A141. doi:10.1051/0004-6361/201219405
-
[8]
Bless, R. C. & Savage, B. D.\ 1970, Ultraviolet Stellar Spectra and Related Ground-Based Observations, 36, 28
1970
Show all 100 references
-
[9]
L., & Storchi-Bergmann, T.\ 1994, , 429, 582
Calzetti, D., Kinney, A. L., & Storchi-Bergmann, T.\ 1994, , 429, 582. doi:10.1086/174346
1994 doi
-
[10]
doi:10.1093/mnras/stac308
Cappellazzo, E., Zafar, T., Corcho-Caballero, P., et al.\ 2022, , 517, 6022. doi:10.1093/mnras/stac308
2022 doi
-
[11]
A., Clayton, G
Cardelli, J. A., Clayton, G. C., & Mathis, J. S.\ 1989, , 345, 245. doi:10.1086/167900
1989 doi
-
[12]
doi:10.1051/0004-6361/202244806
Garc \' a-Bernete, I., Rigopoulou, D., Alonso-Herrero, A., et al.\ 2022, , 666, L5. doi:10.1051/0004-6361/202244806
2022 doi
-
[13]
R., et al.\ 2024, , 691, A162
Garc \' a-Bernete, I., Rigopoulou, D., Donnan, F. R., et al.\ 2024, , 691, A162. doi:10.1051/0004-6361/202450086
2024 doi
-
[14]
M., Kraemer, S
Crenshaw, D. M., Kraemer, S. B., Bruhweiler, F. C., et al.\ 2001, , 555, 633. doi:10.1086/321522
2001 doi
-
[15]
doi:10.1051/0004-6361:20035741
Czerny, B., R \'o \.z a \'n ska, A., Dov c iak, M., et al.\ 2004, , 420, 1. doi:10.1051/0004-6361:20035741
2004 doi
-
[16]
S., Kneib, J.-P., Percival, W
Dawson, K. S., Kneib, J.-P., Percival, W. J., et al.\ 2016, , 151, 44. doi:10.3847/0004-6256/151/2/44
2016 doi
-
[17]
T.\ 1989, Infrared Spectroscopy in Astronomy, 93
Draine, B. T.\ 1989, Infrared Spectroscopy in Astronomy, 93
1989
-
[18]
T.\ 2003, , 41, 241
Draine, B. T.\ 2003, , 41, 241. doi:10.1146/annurev.astro.41.011802.094840
2003 arXiv
-
[19]
El \' asd \'o ttir, \'A ., Fynbo, J. P. U., Hjorth, J., et al.\ 2009, , 697, 1725. doi:10.1088/0004-637X/697/2/1725
2009 doi
-
[21]
doi:10.3847/1538-4357/aabcbc
Esparza-Arredondo, D., Gonz \'a lez-Mart \' n, O., Dultzin, D., et al.\ 2018, , 859, 124. doi:10.3847/1538-4357/aabcbc
2018 doi
-
[22]
doi:10.1093/mnras/stac3473
Fang, H., Xia, I., Ge, J., et al.\ 2023, , 518, 5590. doi:10.1093/mnras/stac3473
2023 doi
-
[23]
doi:10.1088/0004-637X/717/2/868
Farrah, D., Urrutia, T., Lacy, M., et al.\ 2010, , 717, 868. doi:10.1088/0004-637X/717/2/868
2010 doi
- [24]
-
[25]
L., & Massa, D.\ 1986, , 307, 286
Fitzpatrick, E. L., & Massa, D.\ 1986, , 307, 286. doi:10.1086/164415
1986 doi
-
[26]
Fitzpatrick, E. L. & Massa, D.\ 2007, , 663, 320. doi:10.1086/518158
2007 doi
-
[27]
M., Goosmann, R
Gaskell, C. M., Goosmann, R. W., Antonucci, R. R. J., et al.\ 2004, , 616, 147. doi:10.1086/423885
2004 doi
- [28]
-
[29]
doi:10.1093/mnras/stae799
Ge, J., Willis, K., Chao, K., et al.\ 2024, , 531, 387. doi:10.1093/mnras/stae799
2024 doi
-
[30]
R., Jiang, L., Brandt, W
Gibson, R. R., Jiang, L., Brandt, W. N., et al.\ 2009, , 692, 758. doi:10.1088/0004-637X/692/1/758
2009 doi
-
[31]
doi:10.1051/0004-6361/202449659
Greiner, J., Kr \"u hler, T., Bolmer, J., et al.\ 2024, , 691, A158. doi:10.1051/0004-6361/202449659
2024 doi
-
[32]
J., & White, R
Glikman, E., Helfand, D. J., & White, R. L.\ 2006, , 640, 579. doi:10.1086/500098
2006 doi
- [33]
-
[34]
D., Clayton, G
Gordon, K. D., Clayton, G. C., Misselt, K. A., et al.\ 2003, , 594, 279. doi:10.1086/376774
2003 doi
-
[35]
D., Fitzpatrick, E
Gordon, K. D., Fitzpatrick, E. L., Massa, D., et al.\ 2024, , 970, 51. doi:10.3847/1538-4357/ad4be1
2024 doi
-
[36]
Hao, L., Spoon, H. W. W., Sloan, G. C., et al.\ 2005, , 625, L75. doi:10.1086/431227
2005 doi
-
[37]
E., Zafar, T., De Cia, A., et al.\ 2019, , 486, 2063
Heintz, K. E., Zafar, T., De Cia, A., et al.\ 2019, , 486, 2063. doi:10.1093/mnras/stz1012
2019 doi
- [38]
-
[39]
F., Strauss, M
Hopkins, P. F., Strauss, M. A., Hall, P. B., et al.\ 2004, , 128, 1112. doi:10.1086/423291
2004 doi
-
[40]
J., H \"o nig, S
Jensen, J. J., H \"o nig, S. F., Rakshit, S., et al.\ 2017, , 470, 3071. doi:10.1093/mnras/stx1447
2017 doi
-
[41]
X., et al.\ 2010a, , 720, 328
Jiang, P., Ge, J., Prochaska, J. X., et al.\ 2010a, , 720, 328. doi:10.1088/0004-637X/720/1/328
-
[42]
X., et al.\ 2010b, , 724, 1325
Jiang, P., Ge, J., Prochaska, J. X., et al.\ 2010b, , 724, 1325. doi:10.1088/0004-637X/724/2/1325
-
[43]
doi:10.1088/0004-637X/732/2/110
Jiang, P., Ge, J., Zhou, H., et al.\ 2011, , 732, 110. doi:10.1088/0004-637X/732/2/110
2011 doi
-
[44]
T., Cohen, R
Junkkarinen, V. T., Cohen, R. D., Beaver, E. A., et al.\ 2004, , 614, 658. doi:10.1086/423777
2004 doi
-
[45]
& Conroy, C.\ 2013, , 775, L16
Kriek, M. & Conroy, C.\ 2013, , 775, L16. doi:10.1088/2041-8205/775/1/L16
2013 doi
-
[46]
J., Almaini, O., et al.\ 2007, , 379, 1599
Lawrence, A., Warren, S. J., Almaini, O., et al.\ 2007, , 379, 1599. doi:10.1111/j.1365-2966.2007.12040.x
2007
-
[47]
J., & Li, A.\ 2023, , 525, 2380
Lin, Q., Yang, X. J., & Li, A.\ 2023, , 525, 2380. doi:10.1093/mnras/stad2405
2023 doi
- [48]
-
[49]
doi:10.1051/0004-6361/201424122
Ledoux, C., Noterdaeme, P., Petitjean, P., et al.\ 2015, , 580, A8. doi:10.1051/0004-6361/201424122
2015 doi
-
[50]
Liang, S. L. & Li, A.\ 2010, , 710, 648. doi:10.1088/0004-637X/710/1/648
2010 doi
-
[51]
J., et al.\ 2007, , 661, L25
Lutz, D., Sturm, E., Tacconi, L. J., et al.\ 2007, , 661, L25. doi:10.1086/518537
2007 doi
-
[52]
W., Higley, A
Lyke, B. W., Higley, A. N., McLane, J. N., et al.\ 2020, , 250, 8. doi:10.3847/1538-4365/aba623
2020 doi
-
[53]
doi:10.1093/mnras/stv2073
Ma, J., Caucal, P., Noterdaeme, P., et al.\ 2015, , 454, 1751. doi:10.1093/mnras/stv2073
2015 doi
-
[54]
doi:10.1093/mnras/stx2117
Ma, J., Ge, J., Zhao, Y., et al.\ 2017, , 472, 2196. doi:10.1093/mnras/stx2117
2017 doi
-
[55]
doi:10.3847/2041-8213/aabc51
Ma, J., Brammer, G., Ge, J., et al.\ 2018, , 857, L12. doi:10.3847/2041-8213/aabc51
2018 doi
-
[56]
doi:10.1093/mnras/staa2061
Ma, X.-Y., Zhu, Y.-Y., Yan, Q.-B., et al.\ 2020, , 497, 2190. doi:10.1093/mnras/staa2061
2020 doi
-
[57]
10.1051/0004-6361:20000177
Maiolino, R., Marconi, A., & Oliva, E.\ 2001, , 365, 28. 10.1051/0004-6361:20000177
2001 doi
-
[58]
C., Fanson, J., Schiminovich, D., et al.\ 2005, , 619, L1
Martin, D. C., Fanson, J., Schiminovich, D., et al.\ 2005, , 619, L1. doi:10.1086/426387
2005 doi
-
[59]
D., & Fitzpatrick, E
Massa, D., Gordon, K. D., & Fitzpatrick, E. L.\ 2022, , 925, 19. doi:10.3847/1538-4357/ac3825
2022 doi
-
[60]
A., et al.\ 2002, , 574, 719
Motta, V., Mediavilla, E., Mu \ n oz, J. A., et al.\ 2002, , 574, 719. doi:10.1086/341118
2002 doi
-
[61]
M., Nikutta, R., et al.\ 2008, , 685, 160
Nenkova, M., Sirocky, M. M., Nikutta, R., et al.\ 2008, , 685, 160. doi:10.1086/590483
2008 doi
-
[62]
doi:10.1146/annurev-astro-082214-122302
Netzer, H.\ 2015, , 53, 365. doi:10.1146/annurev-astro-082214-122302
2015 doi
-
[63]
doi:10.1051/0004-6361:20077067
Noll, S., Pierini, D., Pannella, M., et al.\ 2007, , 472, 455. doi:10.1051/0004-6361:20077067
2007 doi
-
[64]
doi:10.1051/0004-6361/200912330
Noterdaeme, P., Ledoux, C., Srianand, R., et al.\ 2009, , 503, 765. doi:10.1051/0004-6361/200912330
2009 doi
-
[65]
doi:10.3847/1538-4357/835/2/218
Pan, X., Zhou, H., Ge, J., et al.\ 2017, , 835, 218. doi:10.3847/1538-4357/835/2/218
2017 doi
-
[66]
M., Clayton, G
Pitman, K. M., Clayton, G. C., & Gordon, K. D.\ 2000, , 112, 537. doi:10.1086/316551
2000 doi
-
[67]
X., Worseck, G., & O'Meara, J
Prochaska, J. X., Worseck, G., & O'Meara, J. M.\ 2009, , 705, L113. doi: 10.1088/0004-637X/705/2/L113
2009 doi
-
[68]
X., Sheffer, Y., Perley, D
Prochaska, J. X., Sheffer, Y., Perley, D. A., et al.\ 2009, , 691, L27. doi:10.1088/0004-637X/691/1/L27
2009 doi
-
[69]
T., Fan, X., Newberg, H
Richards, G. T., Fan, X., Newberg, H. J., et al.\ 2002, , 123, 2945. doi:10.1086/340187
2002 doi
-
[70]
T., Hall, P
Richards, G. T., Hall, P. B., Vanden Berk, D. E., et al.\ 2003, , 126, 1131. doi:10.1086/377014
2003 doi
-
[71]
& Mazzalay, X.\ 2006, , 367, L57
Rodr \' guez-Ardila, A. & Mazzalay, X.\ 2006, , 367, L57. doi:10.1111/j.1745-3933.2006.00139.x
2006
-
[72]
J., Finkbeiner, D
Schlegel, D. J., Finkbeiner, D. P., & Davis, M.\ 1998, , 500, 525. doi:10.1086/305772
1998 doi
-
[73]
doi:10.1088/0004-637X/800/2/108
Scoville, N., Faisst, A., Capak, P., et al.\ 2015, , 800, 108. doi:10.1088/0004-637X/800/2/108
2015 doi
-
[74]
cao ., Pan, X., Dou, L.-
Shi, X.-. cao ., Pan, X., Dou, L.-. ming ., et al.\ 2020, , 44, 196. doi:10.1016/j.chinastron.2020.05.004
2020 doi
-
[75]
W., & Li, A.\ 2017, , 840, 27
Shao, Z., Jiang, B. W., & Li, A.\ 2017, , 840, 27. doi:10.3847/1538-4357/aa6ba4
2017 doi
-
[76]
doi:10.1093/mnras/stac1313
Shivaei, I., Boogaard, L., D \' az-Santos, T., et al.\ 2022, , 514, 1886. doi:10.1093/mnras/stac1313
2022 doi
-
[77]
Siebenmorgen, R., Kr \"u gel, E., & Spoon, H. W. W.\ 2004, , 414, 123. doi:10.1051/0004-6361:20031633
2004 doi
-
[78]
F., Cutri, R
Skrutskie, M. F., Cutri, R. M., Stiening, R., et al.\ 2006, , 131, 1163. doi:10.1086/498708
2006 doi
-
[79]
Sparke, L. S. & Gallagher, J. S.\ 2007, Galaxies in the Universe: An Introduction. Second Edition. By Linda S. Sparke and John S. Gallagher, III. ISBN-13 978-0-521-85593-8 (HB); ISBN-13 978-0-521-67186-6 (PB). Published by Cambridge University Press, Cambridge, UK, 2007
2007
-
[80]
Spoon, H. W. W., Marshall, J. A., Houck, J. R., et al.\ 2007, , 654, L49. doi:10.1086/511268
2007 doi
-
[81]
doi:10.1111/j.1745-3933.2008.00558.x
Srianand, R., Gupta, N., Petitjean, P., et al.\ 2008, , 391, L69. doi:10.1111/j.1745-3933.2008.00558.x
2008
- [82]
-
[83]
M., & Padovani, P.\ 1995, , 107, 803
Urry, C. M., & Padovani, P.\ 1995, , 107, 803. doi:10.1086/133630
1995 doi
-
[84]
E., Richards, G
Vanden Berk, D. E., Richards, G. T., Bauer, A., et al.\ 2001, , 122, 549. doi:10.1086/321167
2001 doi
- [85]
-
[86]
M., Smette, A., Fruchter, A
Vreeswijk, P. M., Smette, A., Fruchter, A. S., et al.\ 2006, , 447, 145. doi:10.1051/0004-6361:20053795
2006 doi
-
[87]
B., Ge, J., et al.\ 2004, , 609, 589
Wang, J., Hall, P. B., Ge, J., et al.\ 2004, , 609, 589. doi:10.1086/421240
2004 doi
-
[88]
doi:10.1088/0004-637X/760/1/42
Wang, J.-G., Zhou, H.-Y., Ge, J., et al.\ 2012, , 760, 42. doi:10.1088/0004-637X/760/1/42
2012 doi
-
[89]
J., Morris, S
Weymann, R. J., Morris, S. L., Foltz, C. B., et al.\ 1991, , 373, 23. doi:10.1086/170020
1991 doi
-
[90]
Whittet, D. C. B.\ 2003, Dust in the galactic environment
2003
-
[91]
L., Eisenhardt, P
Wright, E. L., Eisenhardt, P. R. M., Mainzer, A. K., et al.\ 2010, , 140, 1868. doi:10.1088/0004-6256/140/6/1868
2010 doi
-
[92]
doi:10.1051/0004-6361:20030608
Wucknitz, O., Wisotzki, L., Lopez, S., et al.\ 2003, , 405, 445. doi:10.1051/0004-6361:20030608
2003 doi
-
[93]
Y., Li, A., & Zhong, J
Xiang, F. Y., Li, A., & Zhong, J. X.\ 2011, , 733, 91. doi:10.1088/0004-637X/733/2/91
2011 doi
-
[94]
Zafar, T., Watson, D., Fynbo, J. P. U., et al.\ 2011, , 532, A143. doi:10.1051/0004-6361/201116663
2011 doi
-
[95]
doi:10.1088/0004-637X/753/1/82
Zafar, T., Watson, D., El \' asd \'o ttir, \'A ., et al.\ 2012, , 753, 82. doi:10.1088/0004-637X/753/1/82
2012 doi
-
[96]
E., Fynbo, J
Zafar, T., Heintz, K. E., Fynbo, J. P. U., et al.\ 2018, , 860, L21. doi:10.3847/2041-8213/aaca3f
2018 doi
-
[97]
doi:10.1088/0004-637X/714/1/367
Zhang, S., Wang, T.-G., Wang, H., et al.\ 2010, , 714, 367. doi:10.1088/0004-637X/714/1/367
2010 doi
-
[98]
doi:10.1088/0004-637X/802/2/92
Zhang, S., Ge, J., Jiang, P., et al.\ 2015, , 802, 92. doi:10.1088/0004-637X/802/2/92
2015 doi
-
[99]
doi:10.1051/0004-6361/202142476
Zhang, S., Ge, J., Ji, T., et al.\ 2022, , 663, A63. doi:10.1051/0004-6361/202142476
2022 doi
-
[100]
doi:10.1088/0004-637X/708/1/742
Zhou, H., Ge, J., Lu, H., et al.\ 2010, , 708, 742. doi:10.1088/0004-637X/708/1/742
2010 doi
-
[101]
doi:10.3847/1538-4357/aca085
Zhou, Y., Hao, L., Jiang, P., et al.\ 2022, , 941, 111. doi:10.3847/1538-4357/aca085
2022 doi
Reviewed August 7, 2026 · model on record in the stance chip above.
Discussion (0). Continue with ORCID to comment.