REVIEW 3 major objections 5 minor 34 references
Construction, Commissioning, and Installation of the Cylindrical GEM Inner Tracker of the BESIII Experiment
T0 review · 3 major / 5 minor · reviewed 2026-08-07 · deepseek-v4-flash
Pith's one-line read The three-layer cylindrical GEM inner tracker built for BESIII met its upgrade targets in cosmic-ray commissioning — efficiency above 95%, r-phi residuals near 200 µm — and was powered at nominal voltage inside the experiment on 19…
desk verdict Strong engineering thesis; the construction and failure-analysis work is genuinely solid, but the 'meets requirements' performance claim rests on a stereo-angle assumption that is never directly tested. read the letter →
The pith
A machine-rendered reading of the paper's core claim, the machinery that carries it, and where it could break.
The reading
What carries the argument
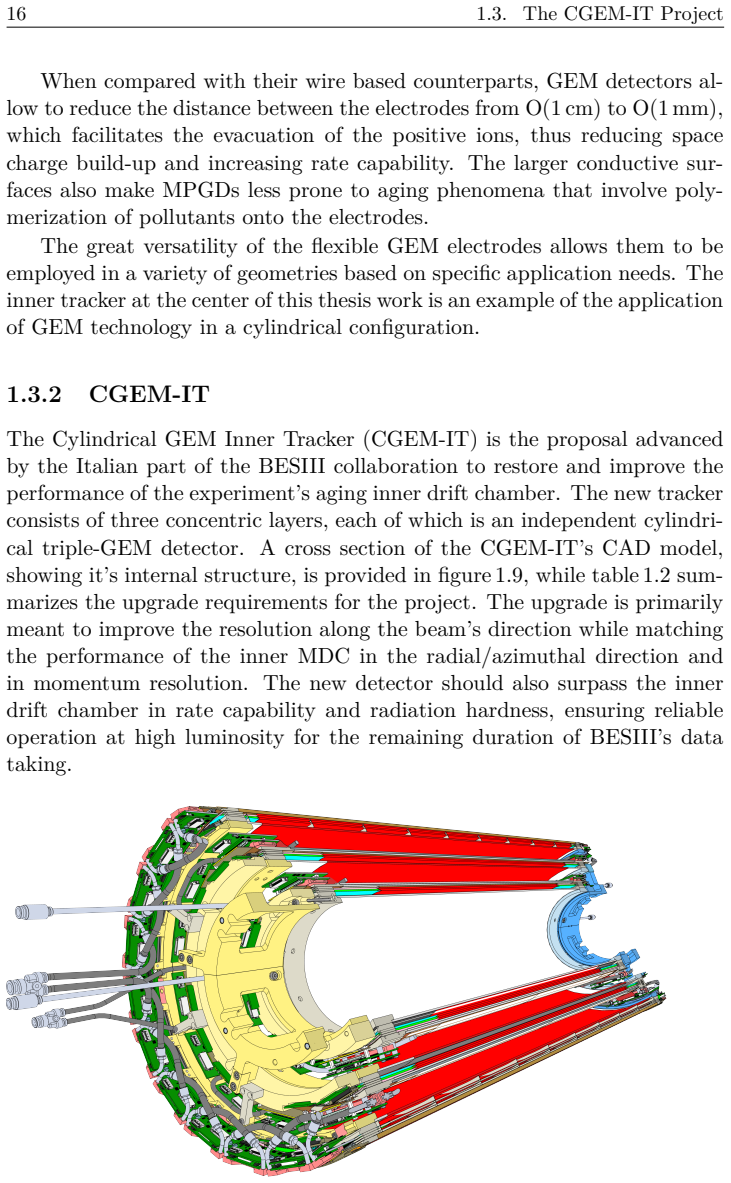
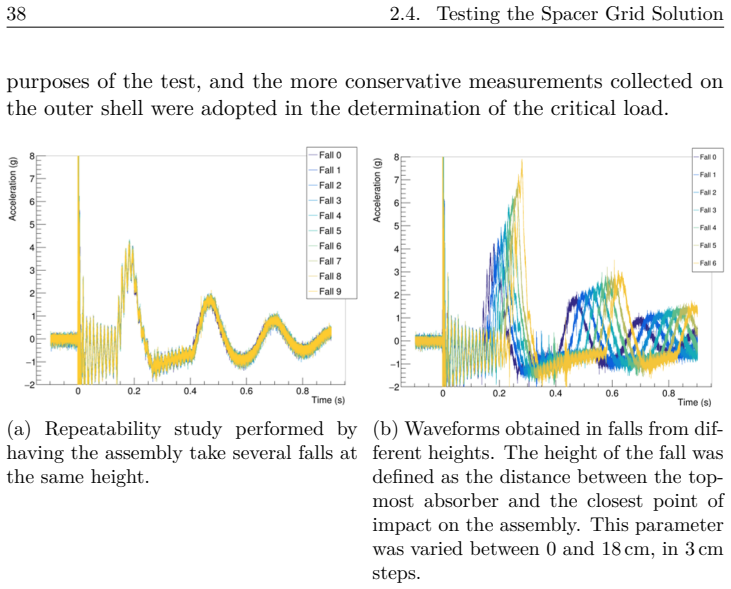
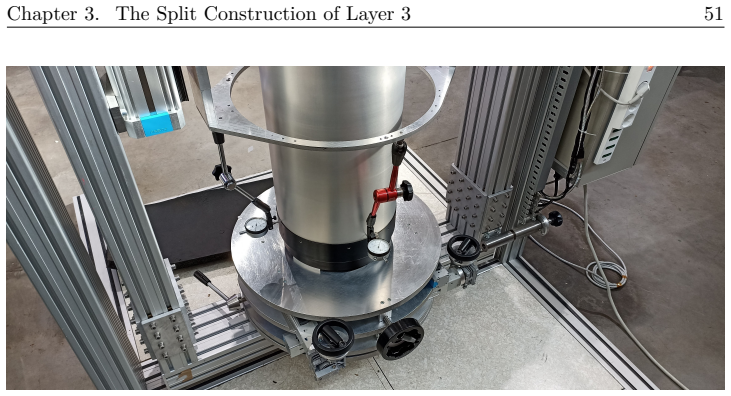
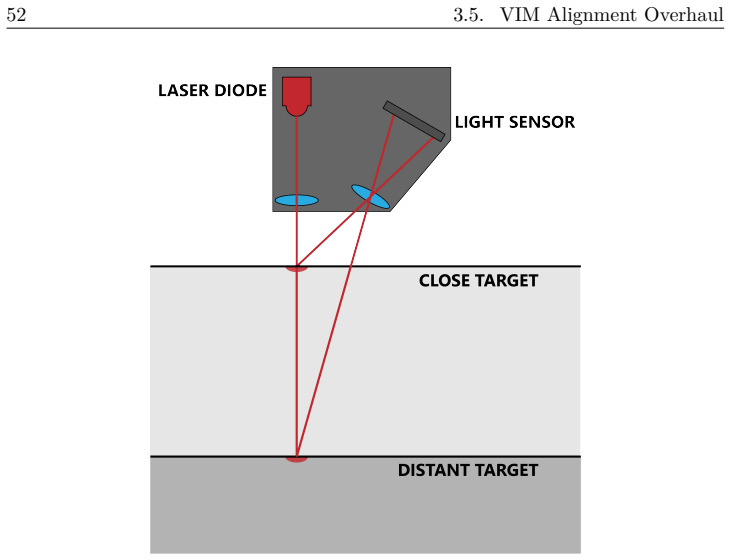
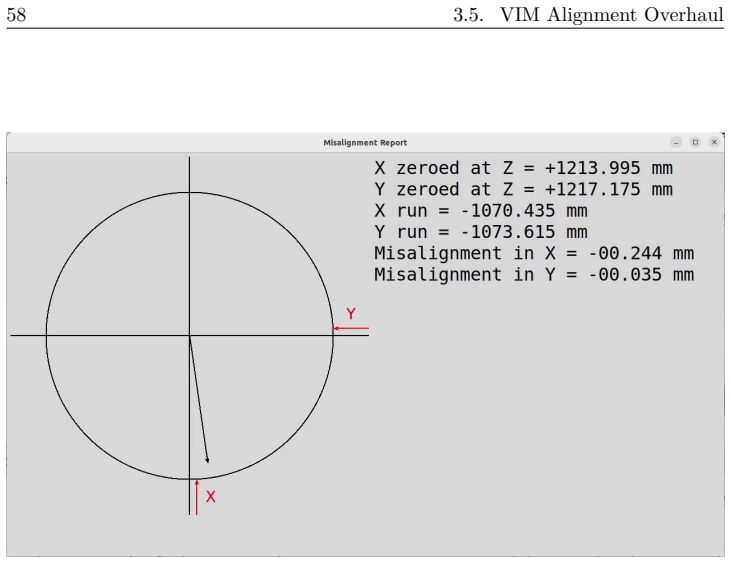
The load-bearing objects are the three cylindrical triple-GEM layers themselves, whose performance claim rests on large-angle stereo strip readout: X strips run parallel to the beam while V strips sit at stereo angles of about 47°, −31°, and 33°, so the beam-direction coordinate is recovered from charge-sharing patterns rather than drift time, which is the mechanism promised to double the $z$ resolution. Two engineered mechanisms carry the construction story. PEEK (polyether ether ketone) spacer grids — axial rods and rings placed in the transfer and drift gaps — contain the amplitude of buckling lobes that had collapsed the floating electrodes of the first Layer 3, with their effectiveness established by computed-tomography scans of a dropped mock-up and a measured critical load of 7.5 g. A contactless alignment system using four laser triangulation sensors on the Vertical Insertion Machine replaced dial gauges, allowing the five mandrels to be aligned within tolerance without touching the delicate electrodes and making the split construction feasible.
What would settle it
Measure the beam-direction resolution in collision data: reconstruct tracks with the outer drift chamber in the 1 T magnetic field, take the CGEM-IT hit positions, and compute the residual width in $z$; the central claim fails if the unfolded $\sigma_z$ exceeds 1 mm or if the unfolded $r\phi$ residuals of most half-layers exceed 150 µm.
Extended reading notes
Core claim
The paper's central claim is that the CGEM-IT — three concentric, independent cylindrical triple-GEM detectors with analog strip readout, each anode carrying X strips parallel to the beam and V strips at large stereo angles of about 47°, −31°, and 33° — fulfills the BESIII upgrade requirements: $\sigma_{r\phi} \le 150\,\mu$m, $\sigma_z \le 1$ mm, efficiency above 95%, and stable operation. In cosmic-ray commissioning the residual distributions for tracks near perpendicular incidence have standard deviations near 200 µm for most half-layers (300–400 µm for two degraded halves), and efficiencies exceed 95% in the azimuthal direction; the paper argues the true resolution is better because the tracking system itself contributes to the measured width. The thesis also claims that the initially failing Layer 3 was diagnosed, through X-ray computed tomography, as buckling-induced collapse of the floating GEM electrodes, and that the cure — PEEK spacer grids inserted between the electrodes — was validated by instrumented drop tests on a representative mock-up, raising the critical load to 7.5 g. It claims that the resulting split construction, with electrodes built in Italy and assembled in China, was enabled by a contactless alignment system based on laser triangulation sensors mounted on the assembly machine, and that two full-scale insertion tests with redesigned tooling validated the installation procedure. The culminating claim is that the detector was installed and powered at nominal high voltage inside BESIII on 19 October 2024, with electronics noise comparable to the laboratory cosmic-ray setup.
Load-bearing premise
The whole case rests on assuming that cosmic-ray tests taken without the experiment's 1 T magnet — where the beam-direction resolution was never measured directly and the angled-track reconstruction was still being tuned — carry over to real operation, so that the large readout angles deliver the promised 1 mm beam-direction resolution and the roughly 200-micron residual widths, which include tracking errors, bound the true resolution.
Editorial extensions
If this is right
- BESIII can keep taking data until 2030 with a functioning inner tracker instead of the aging wire chamber, and the physics program in charmonium, tau, and light-hadron spectroscopy gains the promised improvement in beam-direction resolution.
- A large-format GEM detector that fails to power on can be recovered: CT imaging locates buckling collapse, PEEK spacer grids contain it, and electrical cleaning restores pathological high-voltage sectors.
- Because the measured residual widths near 200 µm include tracking-system contributions, the single-layer $r\phi$ resolution should lie within the 150 µm requirement for most half-layers, with the two wider halves (300–400 µm) attributed to suspected gas leaks rather than intrinsic detector limits.
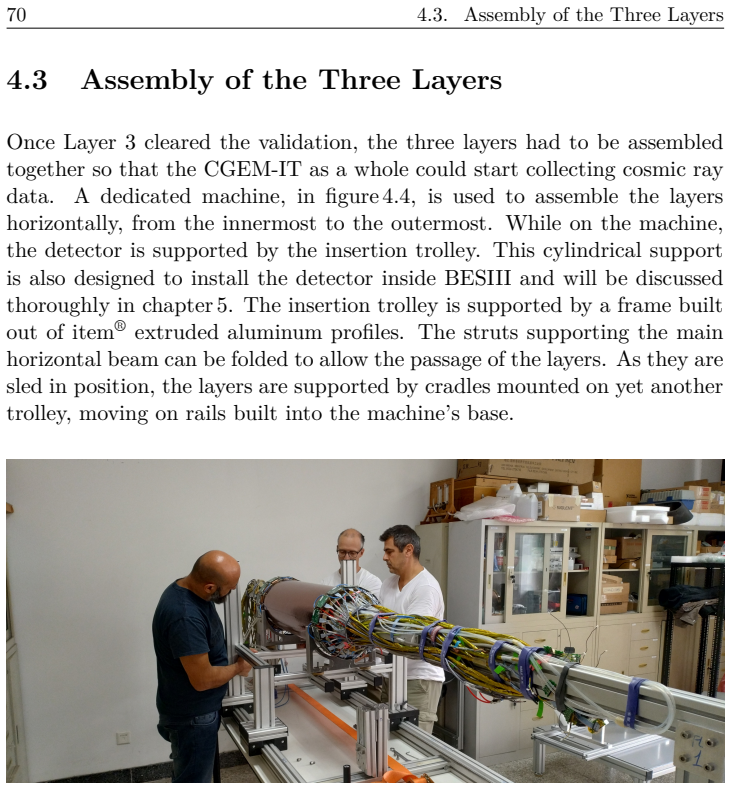
- The validated insertion and cabling procedures — the redesigned trolley, the guard ring with contact sensors, and the mock-up cabling studies — provide a reusable method for installing fragile cylindrical detectors into a closed spectrometer within a fixed time window.
Reading between the lines
- The cosmic-ray campaign left two questions that only collision data can settle: whether the beam-direction resolution reaches the 1 mm target once the large-angle stereo readout runs inside the 1 T field, and whether the angled-track reconstruction algorithm, still being tuned at the time of writing, extends the good small-angle results to inclined tracks.
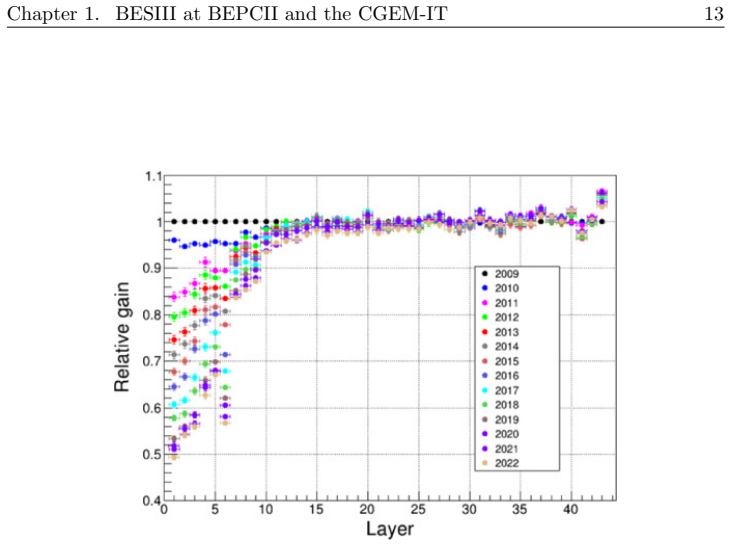
- The bottom-half charge asymmetry in Layers 2 and 3, tentatively attributed to gas leaks, was partly corrected by raising the gas flow; the installed detector with the final gas system may therefore show more uniform gain than the commissioning data did.
- Since the stated residual widths include the tracking-system contribution, the paper's own numbers imply the unfolded single-layer $r\phi$ resolution sits below 150 µm; a dedicated measurement of that unfolded value, using the outer drift chamber as reference, would confirm the headroom directly.
- The engineering solutions are transferable to any future cylindrical micropattern-gaseous-detector tracker: the buckling risk grows with the radius-to-length ratio of the electrodes, the shipping fragility is universal, and the mock-up rehearsal method does not depend on the specific machine.
Editorial analysis
A structured set of objections, weighed in public.
Referee Report
Summary. This thesis reports the final three years of the CGEM-IT project: the diagnosis (by CT imaging) of a buckling-induced collapse of the electrodes of the largest layer, the design and validation of a PEEK spacer-grid solution via a controlled drop test on a mock-up, the split construction of the layer with a new laser-triangulation alignment system for the assembly machine, the commissioning of the three-layer tracker in a cosmic-ray telescope, and the installation into BESIII with first power-on at nominal HV in October 2024. The central performance claim is that the cosmic-ray data show the CGEM-IT meets the upgrade requirements (sigma_rphi <= 150 um, sigma_z <= 1 mm, efficiency > 95%, operational stability).
Significance. If the performance claim holds, the CGEM-IT would constitute a successful MPGD-based upgrade for BESIII, delivering the advertised factor-of-2 improvement in z-resolution and securing the continuation of data taking. The mechanical failure diagnosis and the spacer-grid mitigation are convincing and well evidenced: the drop test uses accelerometers, a realistic mock-up, and CT scans, and the 7.5 g peak acceleration is directly measured. The contactless laser-alignment system for the Vertical Insertion Machine is a practical and transferable contribution to cylindrical GEM construction, and the two insertion tests and the cabling mock-up demonstrate careful systems engineering. These positive elements stand independently of the resolution claim. The weak point is that the headline sigma_z <= 1 mm requirement is never directly measured: only transverse residuals are presented, and the cosmic-ray tests were performed without the 1 T solenoid field, with the muTPC algorithm still under development. Thus the paper's central validation claim is only partially supported by the data shown.
major comments (3)
- [Section 4.5.1, Fig. 4.12 and Table 1.2] The sentence 'The performance reached by the CGEM-IT in the cosmic ray data taking meets the requirements for the upgrade' is not substantiated for the sigma_z <= 1 mm requirement of Table 1.2. The residuals shown in Fig. 4.12 are for the transverse coordinate only, obtained with the charge-centroid algorithm for tracks within 5 deg of normal incidence. No z-coordinate residual, no sigma_z value, and no comparison with the MDC's ~2 mm z-resolution are presented anywhere in the thesis. The conclusion therefore depends on the additional, unverified assumption that the large stereo angles of Table 1.3 deliver the required z-resolution in situ. The text should either present such a measurement or explicitly state that the sigma_z requirement is only projected, not yet validated.
- [Section 4.5.1 (muTPC; cosmic-ray setup)] The performance validation was carried out outside the 1 T solenoid field of BESIII, and the text states that the muTPC algorithm 'does not yet reach its target performance'. Since the in-situ z-resolution relies on the stereo-angle reconstruction in the magnetic field, and the resolution for inclined tracks relies on muTPC, the presented data do not establish performance under the intended operating conditions. At minimum, the manuscript should state these two limitations explicitly in the abstract and conclusions, and the 'meets the requirements' claim should be qualified as applying only to the no-field, small-angle regime with the CC algorithm.
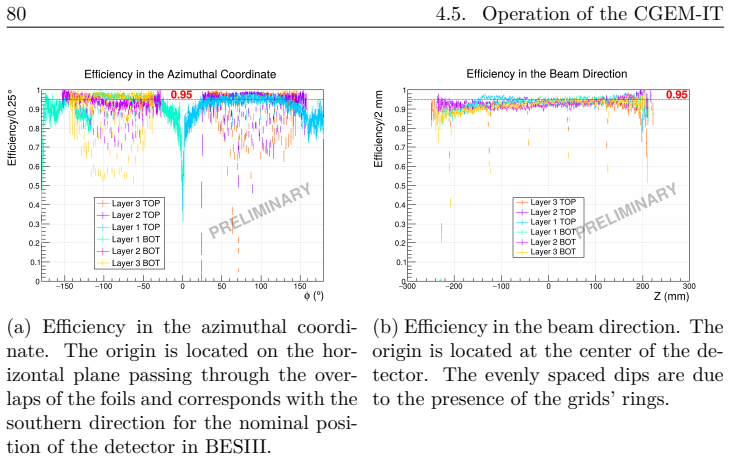
- [Section 4.5.1, Fig. 4.13] The efficiency in the beam direction is visibly lower than in the azimuthal coordinate, with regularly spaced dips attributed to the PEEK grid rings, yet the text quotes only the azimuthal efficiency (greater than 95%) as meeting requirements. If an overall efficiency requirement is intended, the thesis should quote the measured acceptance-corrected efficiency in both coordinates and compare it with that requirement. As written, the claim that the efficiency requirement is met is ambiguous and not supported by the figure.
minor comments (5)
- [Section 2.4.4] The phrase 'having raised the critical load sustainable by the detector to 7.5 g' overstates what was measured: the 7.5 g value was obtained on a mock-up with 3D-printed rings and a reduced stack, and the extrapolation to the real Layer 3 is based on the mock-up being representative. It would be more precise to write 'the mock-up withstood a 7.5 g inertial load'.
- [Section 4.2] The text says 'the nominal resistance between the micro and maro-sector' — 'maro-sector' should be 'macro-sector'.
- [Section 3.2 and Section 5.2.1] Minor typos: 'accomodate' should be 'accommodate', and 'phisiically' should be 'physically'. The caption of Figure 3.2 contains 'begininning' instead of 'beginning'.
- [Section 5.3] The word 'sprectrometer' should be 'spectrometer'. Throughout the thesis, a few instances of 'the the' and 'it's' instead of 'its' should be corrected in a final proofread.
- [Section 4.5.1] The text 'wothwile' should be 'worthwhile'.
Circularity Check
No circularity: performance claims trace to direct cosmic-ray measurements; the unmeasured z-resolution is an unverified extrapolation, not a circular reduction.
full rationale
The paper's central claims are direct measurements: cosmic-ray residual widths of about 200 um (Section 4.5.1), efficiency >95%, HV stability, and successful installation are read out from data and operations logs, not generated by a fitted model. The only calibration in the chain is the drop-test scaling factor between the preliminary CGEM-like assembly and the Layer-3 mock-up (Section 2.4.4); that factor only selects fall parameters, and the 7.5 g value quoted as the sustained load is a measured accelerometer peak, with the conclusion drawn from CT scans before/after. No equation reduces to a prior equation, and no fitted parameter is renamed as a prediction. The sigma_z <= 1 mm requirement is carried by the stereo-angle design argument, but the thesis never reports a z-resolution; this is an unverified extrapolation, acknowledged by the statement in Section 4.5.1 that the muTPC algorithm is still being fine-tuned, and absence of verification is not circularity. The only self-citations (the author's master's thesis for construction details, collaboration software references) are procedural and do not support the performance claim. The derivation chain is therefore self-contained.
Assumptions & free parameters
free parameters (1)
- Drop-test scaling factor =
Angular coefficient derived from first two calibration falls
assumptions (4)
- domain assumption FEM simulation critical loads for CGEM layers are provisionally correct (8.7 g for Layer 1, 4.0 g for Layer 2, 2.5 g for Layer 3) and informative for interpreting the drop test.
- domain assumption The mock-up used in the drop test is representative of the real Layer 3, being intentionally slightly weaker.
- domain assumption Cosmic-ray data taken without the 1 T magnetic field and with the muTPC algorithm not at target performance are representative enough to establish that the upgrade requirements are met.
- domain assumption The measured residual distributions of about 200 um for most half-layers imply the spatial resolution meets the sigma_rphi <= 150 um requirement once tracking-system contributions are removed.
Cite this review
Pith. "Pith review of Construction, Commissioning, and Installation of the Cylindrical GEM Inner Tracker of the BESIII Experiment." pith.science (2026). https://pith.science/paper/4ZHZN3XO
@misc{pith2026250520952,
  author       = {Pith},
  title        = {Pith review of: Construction, Commissioning, and Installation of the Cylindrical GEM Inner Tracker of the BESIII Experiment},
  year         = {2026},
  howpublished = {\url{https://pith.science/paper/4ZHZN3XO}},
  note         = {Machine review of arXiv:2505.20952}
}
abstract
BESIII (BEijing Spectrometer III) is a particle physics experiment with a vast physics program centered around the study of charmonium and the $\tau$ lepton. The performance of the spectrometer's inner tracker, the innermost part of a large drift chamber, has been degrading due to aging phenomena related to the large particle rate. Planned upgrades to the BEPCII (Beijing Electron Positron Collider II) collider, servicing the experiment, may further aggravate the problem, with the risk of disrupting the data taking. The Italian component of the BESIII collaboration proposed a detector based on cylindrical GEM (Gas Electron Multiplier) technology to replace the aging inner tracker. The new detector aims to improve the current tracker's spatial resolution in the beam direction at least a factor 2 and to ensure the continuation of BESIII's data taking until its end in 2030. After more than 10 years of design, development, and construction the three layers of the CGEM-IT (Cylindrical GEM Inner Tracker) are finally being installed in the spectrometer. This thesis describes the three final years of the detector's development, which led from diagnosing and resolving mechanical issues preventing the largest layer from powering on to securing the approval of the experiment's internal review committee for installation. Particular focus is given to the technological solutions adopted to overcome the challenges encountered during the development process, which often required a complete rethinking of previous methods and procedures. The thesis concludes with a snapshot of the ongoing installation of the detector, commenting on the results of the preparatory work undertaken to ensure its success.
Figures


Figures from the paper (88 more)















Reference graph
Works this paper leans on
-
[1]
Bepc ii: construction and commissioning,
F. B. I. Team, “Bepc ii: construction and commissioning,”Chinese Physics C, vol. 33, p. 60, jun 2009
work page 2009
-
[2]
Future Physics Programme of BESIII,
M. Ablikimet al., “Future Physics Programme of BESIII,”Chin. Phys. C, vol. 44, no. 4, p. 040001, 2020
work page 2020
-
[3]
Design and Construction of the BESIII Detector,
M. Ablikimet al., “Design and Construction of the BESIII Detector,” Nucl. Instrum. Meth. A, vol. 614, pp. 345–399, 2010
work page 2010
-
[4]
Precision measurement of the mass of theτlepton,
M. Ablikimet al., “Precision measurement of the mass of theτlepton,” Phys. Rev. D, vol. 90, no. 1, p. 012001, 2014
work page 2014
-
[5]
Measurement of thee +e−→π +π− cross section between 600 and 900 MeV using initial state radiation,
M. Ablikimet al., “Measurement of thee +e−→π +π− cross section between 600 and 900 MeV using initial state radiation,”Phys. Lett. B, vol. 753, pp. 629–638, 2016. [Erratum: Phys.Lett.B 812, 135982 (2021)]
work page 2021
-
[6]
Measurement of the cross section fore +e− → Hadrons at energies from 2.2324 to 3.6710 gev,
M. Ablikimet al., “Measurement of the cross section fore +e− → Hadrons at energies from 2.2324 to 3.6710 gev,”Phys. Rev. Lett., vol. 128, p. 062004, Feb 2022
work page 2022
-
[7]
Observation of a Charged Charmoniumlike Struc- ture ine +e−→π +π−J/ψat √s=4.26 GeV,
M. Ablikimet al., “Observation of a Charged Charmoniumlike Struc- ture ine +e−→π +π−J/ψat √s=4.26 GeV,”Phys. Rev. Lett., vol. 110, p. 252001, 2013
work page 2013
-
[8]
Measurement of the Absolute Branching Fraction ofD + s →τ +ντ viaτ +→e +νe¯ντ,
M. Ablikimet al., “Measurement of the Absolute Branching Fraction ofD + s →τ +ντ viaτ +→e +νe¯ντ,”Phys. Rev. Lett., vol. 127, no. 17, p. 171801, 2021
work page 2021
Show all 34 references
-
[9]
Observation of an Isoscalar Resonance with Exotic JPC=1-+ Quantum Numbers in J/ψ→γηη’,
M. Ablikimet al., “Observation of an Isoscalar Resonance with Exotic JPC=1-+ Quantum Numbers in J/ψ→γηη’,”Phys. Rev. Lett., vol. 129, no. 19, p. 192002, 2022. [Erratum: Phys.Rev.Lett. 130, 159901 (2023)]
2023
-
[10]
Erratum: Observation of an isoscalar res- onance with exoticJ PC = 1−+ quantum numbers inj/ψ→γηη ′ [phys. rev. lett. 129, 192002 (2022)],
M. Ablikim and Anonymous, “Erratum: Observation of an isoscalar res- onance with exoticJ PC = 1−+ quantum numbers inj/ψ→γηη ′ [phys. rev. lett. 129, 192002 (2022)],”Phys. Rev. Lett., vol. 130, p. 159901, Apr 2023
2022
-
[11]
Search for the decayD 0→π 0ν¯ν,
M. Ablikimet al., “Search for the decayD 0→π 0ν¯ν,”Phys. Rev. D, vol. 105, no. 7, p. L071102, 2022
2022
-
[12]
The BESIII physics programme,
C.-Z. Yuan and S. L. Olsen, “The BESIII physics programme,”Nature Rev. Phys., vol. 1, no. 8, pp. 480–494, 2019
2019
-
[13]
Design and construction of the new BESIII endcap Time- of-Flight system with MRPC Technology,
P. Caoet al., “Design and construction of the new BESIII endcap Time- of-Flight system with MRPC Technology,”Nucl. Instrum. Meth. A, vol. 953, p. 163053, 2020
2020
-
[14]
Thin film field emission,
L. Malter, “Thin film field emission,”Phys. Rev., vol. 50, pp. 48–58, Jul 1936
1936
-
[15]
Aging phenomenon in BESIII drift chamber,
M. Y. Dong, L. H. Wu, L. L. Wang, Z. H. Qin, Q. Ouyang, Y. B. Chen, and S. S. Sun, “Aging phenomenon in BESIII drift chamber,”Nucl. Instrum. Meth. A, vol. 1066, p. 169582, 2024
2024
-
[16]
Gem: A new concept for electron amplification in gas detec- tors,
F. Sauli, “Gem: A new concept for electron amplification in gas detec- tors,”Nuclear Instruments and Methods in Physics Research Section A: Accelerators, Spectrometers, Detectors and Associated Equipment, vol. 386, no. 2, pp. 531–534, 1997
1997
-
[17]
The gas electron multiplier (GEM): Operating principles and applications,
F. Sauli, “The gas electron multiplier (GEM): Operating principles and applications,”Nucl. Instrum. Meth. A, vol. 805, pp. 2–24, 2016
2016
-
[18]
GEM detector performance with innovative micro- TPC readout in high magnetic field,
I. Garziaet al., “GEM detector performance with innovative micro- TPC readout in high magnetic field,”EPJ Web Conf., vol. 170, p. 01009, 2018
2018
-
[19]
Triple GEM performance in magnetic field,
M. Alexeevet al., “Triple GEM performance in magnetic field,”JINST, vol. 14, no. 08, p. P08018, 2019
2019
-
[20]
The CGEM-IT readout chain,
A. Amorosoet al., “The CGEM-IT readout chain,”JINST, vol. 16, no. 08, p. P08065, 2021
2021
-
[21]
Cossio,A mixed-signal ASIC for time and charge measurements with GEM detectors
F. Cossio,A mixed-signal ASIC for time and charge measurements with GEM detectors. PhD thesis, Turin Polytechnic, 2019
2019
-
[22]
Tofpet 2: A high-performance circuit for pet time- of-flight,
A. Di Francesco, R. Bugalho, L. Oliveira, A. Rivetti, M. Rolo, J. C. Silva, and J. Varela, “Tofpet 2: A high-performance circuit for pet time- of-flight,”Nuclear Instruments and Methods in Physics Research Sec- tion A: Accelerators, Spectrometers, Detectors and Associated Equi...
2016
-
[23]
A trigger system based on fast sampling adcs - implementation and tests,
P. Marciniewski, P. Plucinski, K. Fransson, L. Heijkenskojld, A. Kupsc, J. Zlomanczuk, M. Wolke, H. Calen, T. Johansson, B. Hoistad, W. Er- ven, and P. Wuestner, “A trigger system based on fast sampling adcs - implementation and tests,”IEEE Nuclear Science Symposium Confer- en...
2011
-
[24]
Technical Design Report of the Inner Tracker for the KLOE-2 experiment,
F. Archilliet al., “Technical Design Report of the Inner Tracker for the KLOE-2 experiment,” 2 2010
2010
-
[25]
The KLOE-2 experiment at DAΦNE,
P. Gauzzi and E. Perez del Rio, “The KLOE-2 experiment at DAΦNE,” EPJ Web Conf., vol. 212, p. 01002, 2019
2019
-
[26]
Aging of gaseous detectors: Assembly materials and pro- cedures,
M. Capeans, “Aging of gaseous detectors: Assembly materials and pro- cedures,”ICFA Instrum. Bull., vol. 24, pp. 85–109, 2002
2002
-
[27]
Gramigna,A Cylindrical GEM Inner Tracker for the BESIII Ex- periment: from Construction to Electronic Noise Studies
S. Gramigna,A Cylindrical GEM Inner Tracker for the BESIII Ex- periment: from Construction to Electronic Noise Studies. PhD thesis, University of Ferrara, 2 2022. Available athttps://jinst.sissa.it/ jinst/theses/2021_JINST_TH_004.pdf
2022
-
[28]
The CGEM-IT: An Upgrade for the BESIII Experiment,
I. Balossino, F. Cossio, R. Farinelli, and L. Lavezzi, “The CGEM-IT: An Upgrade for the BESIII Experiment,”Symmetry, vol. 14, no. 5, p. 905, 2022
2022
-
[29]
Construction and assembly of the CGEM-IT innermost layer,
S. Gramigna, “Construction and assembly of the CGEM-IT innermost layer,”Nuovo Cim. C, vol. 45, no. 5, p. 109, 2022
2022
-
[30]
De Oliveira
R. De Oliveira. private communication
-
[31]
F. M. Melendi,Development and Test of an Interlock System for the BESIII CGEM Detector. PhD thesis, University of Ferrara, 2023
2023
-
[32]
Bortone,Deployment of the readout electronics for the BESIII Cylin- drical GEM Inner Tracker
A. Bortone,Deployment of the readout electronics for the BESIII Cylin- drical GEM Inner Tracker. PhD thesis, Turin U., 2021
2021
-
[33]
Grafana’s website
G. Labs, “Grafana’s website. ”https://grafana.com/grafana/, 2022. Accessed: 20/11/2024
2022
-
[34]
Commissioning of the Cylindrical GEM Inner Tracker for the BESIII experiment,
S. Gramigna, “Commissioning of the Cylindrical GEM Inner Tracker for the BESIII experiment,”Nucl. Instrum. Meth. A, vol. 1069, p. 169821, 2024
2024
Reviewed August 7, 2026 · model on record in the stance chip above.
Discussion (0). Sign in to comment.