REVIEW 3 major objections 7 minor 108 references
The TYPHOON Stellar Population Synthesis Survey. II. Pushing Full Spectral Fitting to the Limit in the Nearby Grand Design Barred Spiral M83
T0 review · 3 major / 7 minor · reviewed 2026-08-07 · deepseek-v4-flash
Pith's one-line read Full spectral fitting of integrated galaxy light recovers the metallicity of M83's young stars to within 0.12 dex of individual stellar probes.
desk verdict The external validation against individual stellar probes is the real result and it is solid; the central metal-poor arc is the soft spot and should be treated as suggestive until an independent template check or a direct stellar probe inside the dip is shown. read the letter →
The pith
A machine-rendered reading of the paper's core claim, the machinery that carries it, and where it could break.
The reading
What carries the argument
The machinery is a linear combination of single stellar population (SSP) spectra, each with an age and metallicity, attenuated by a dust law with variable total-to-selective extinction R_V and color excess E(B−V). The model spectrum is M_λ = D_λ(R_V, E(B−V)) Σ_i b_i f_{λ,i}(t_i, [Z]_i) + b_a f^a_λ, with nonnegative coefficients b_i found by bounded variable least squares. What carries the argument is the separation of the fitted population into young (t_i ≤ 0.1 Gyr) and old (t_i ≥ 1.6 Gyr) components, and the conversion of fitted luminosity weights b_i into mass-of-metals metallicities via [Z] = log(Σ_i b_i γ_i Z_i / Σ_i b_i γ_i / Z_⊙) rather than a luminosity-weighted mean of [Z]_i. The validation against individual stellar probes is what licenses reading [Z]_y as a true metallicity.
What would settle it
Measure the metallicity of individual young stars or clusters inside the central metal-poor dip (within about 0.04 R25, where no stellar probe currently exists) and compare with the fitted [Z]_y in the same spatial bins; a systematic offset larger than the 0.12 dex scatter measured elsewhere would indicate the dip is a template-fitting artifact.
Extended reading notes
Core claim
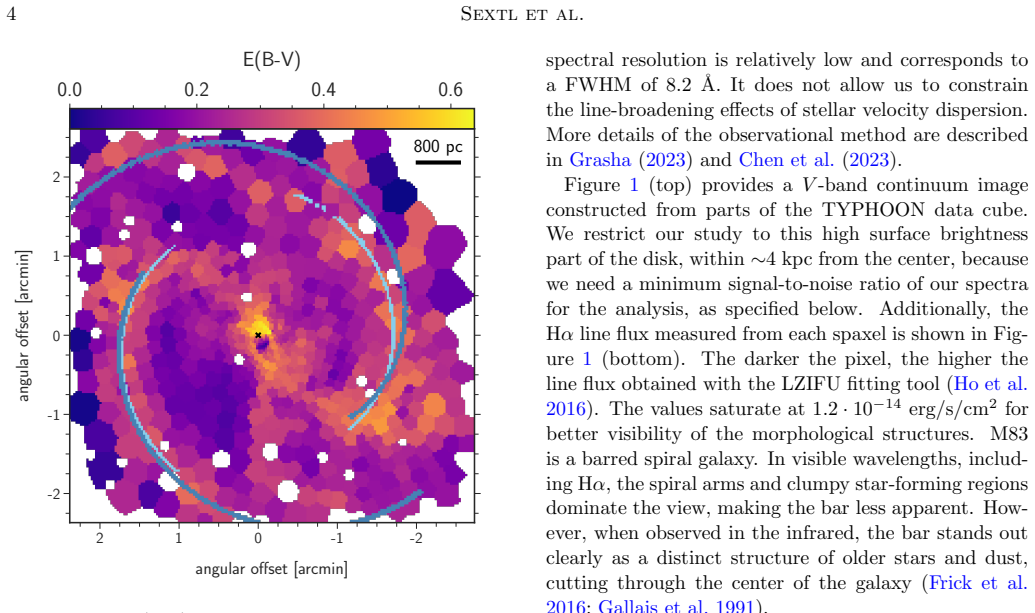
On the paper's own terms, the central discovery is that full spectral fitting of the 4000–7070 Å integrated spectra of M83, using a grid of single stellar populations with ages down to 0.1 Myr, recovers the metallicity of the young (age < 100 Myr) stellar population with an accuracy of about 0.1 dex. The comparison with individual blue supergiants, young massive clusters, and super star clusters yields a mean offset of 0.02 dex and a scatter of 0.12 dex, with no trend with age or the young-light fraction. This validation supports the subsequent results: the young population is supersolar at [Z]_y ≈ 0.2 dex with a flat radial distribution (slope −0.01 ± 0.06 per R/R25), there is a confined central region of lower metallicity along the circumnuclear x2 orbits, and the same fits reveal a 260 pc dust cavity near the center and an anticorrelation between R_V and the abundance of the photodissociation-region molecules CCH, CN, and CS. The paper also shows that cutting the blue end of the fitted spectrum (starting at 4600–4800 Å) produces spurious metallicity gradients, and that luminosity-weighted averages of logarithmic metallicity are biased by bright young stars, whereas its mass-of-metals averaging gives the chemically meaningful value.
Load-bearing premise
The template grid of model stellar spectra is complete enough to represent any real mix of stars in M83; if the real stars produce spectral features that no template combination can reproduce, the fitted coefficients, and hence the derived dust, ages, and metallicities, will be biased.
Editorial extensions
If this is right
- Integrated light from 4000–7070 Å can replace sparse individual-star spectroscopy for mapping young-population metallicity in nearby star-forming galaxies, at least to roughly 0.1 dex precision.
- The flat, supersolar metallicity of the young disk supports chemical evolution models with roughly constant ratios of mass loss and accretion to star formation.
- The central metal-poor region, if real, indicates recent dilution of circumnuclear gas by metal-poor infall or AGN-interrupted chemical evolution.
- Dust and molecular gas are spatially correlated, and regions with smaller dust grains (low R_V) are enriched in CCH, CN, and CS, linking grain size distributions to photodissociation-region chemistry.
- Surveys that lack blue coverage starting near 4800 Å will systematically misestimate young-population metallicity and can produce artificial radial gradients.
Reading between the lines
- Editorial inference: The success of the one-to-one validation implies the same fitting machinery could be applied to more distant galaxies where individual blue supergiants and clusters are unresolved, turning integrated-light surveys into a chemical mapping tool at distances where stellar probes are impossible.
- Editorial inference: The paper's attribution of the central metal-poor region to infall or AGN interruption is not uniquely proven; a discriminating test would be to compare old and young population metallicities in the same central bins—a young-only dip favors AGN-interrupted enrichment, while a dip in both populations favors recent gas infall or a merger.
- Editorial inference: The reported R_V anticorrelation with PDR molecules is correlational; a causal interpretation could be tested with photodissociation-region models that vary the grain size distribution and predict the observed column-density ratios of CCH, CN, and CS.
- Editorial inference: The demonstration that blue wavelength cuts create artificial metallicity gradients implies that existing metallicity maps derived from red-only IFU surveys of star-forming galaxies may need re-analysis, and that future surveys should push further to the blue.
Editorial analysis
A structured set of objections, weighed in public.
Referee Report
Summary. The paper applies the TYPHOON full-spectral-fitting population synthesis method to a central 5x5 square around the barred spiral M83. Using FSPS v3.2 SSPs built on the MILES library augmented with young massive star spectra, the authors fit each Voronoi-binned spectrum for dust attenuation (E(B-V), R_V), ages, star formation rates, and mass-weighted metallicities of young (<100 Myr) and old stellar populations. They report a flat young-metallicity radial gradient ([Z]_y = 0.20 ± 0.02 − 0.01 ± 0.06 R/R25), a confined central low-metallicity region along the x2 orbits, a 260 pc central dust cavity, a correlation between dust and CO, and an anticorrelation between R_V and molecular PDR tracers. The central validation claim is a one-to-one comparison of [Z]_y with metallicities of blue supergiant stars, young massive clusters, and super star clusters, giving a mean offset of 0.02 dex and a scatter of 0.12 dex. The paper also repeats the analysis with pPXF and with the C3K stellar library, and examines the effect of blue wavelength coverage.
Significance. If the validation holds, this is a significant methodological result: it is the first spatial one-to-one comparison of full-spectral-fitting metallicities with independent young stellar probes, and the reported agreement strongly supports the use of integrated light spectroscopy for young-population metallicities when blue coverage is available. The flat gradient and the central low-metallicity region speak directly to chemical evolution models and infall scenarios in barred galaxies. The paper deserves credit for testing the method with an alternative fitting algorithm (pPXF), an alternative stellar library (C3K), and a wavelength-coverage experiment (Section 7) that demonstrates a real risk in red-only fits. The re-derivation of the NGC 1365 result with mass-weighted rather than luminosity-weighted metallicities (Section 6) is also a useful correction. The main caveat is that the most novel physical conclusion, the central metal-poor arc, currently rests on internal and same-template checks rather than on independent stellar probes inside the dip, and the C3K test is reported only as global statistics.
major comments (3)
- [Section 4.2/4.3, Figs. 15 and 16] The central low-metallicity arc is the paper's most novel physical claim, but it lacks external validation inside the dip. The one-to-one comparison in Fig. 16 does not report any BSG, YMC, or SSC lying inside the low-metallicity region shown in Fig. 15; the pPXF rerun in Section 5 uses the same MILES-augmented FSPS SSP grid, so a template mismatch in the hot-star component would enter both fits alike. The independent C3K library is discussed only through global probe statistics (Fig. 18), not through a central map. Since the interpretation (metal-poor infall or AGN-interrupted chemical evolution) depends on the reality of this structure, the authors should either show that the C3K fit reproduces the central dip in map form, or explicitly characterize the dip as tentative pending independent stellar metallicity measurements in that region.
- [Section 3.1, Fig. 6] The R_V-PDR anticorrelation rests on 12 ALMA pointings, with Pearson coefficients of -0.70 ± 0.21 (CCH), -0.62 ± 0.16 (CN), and -0.52 ± 0.23 (CS). With n = 12 and three molecular species tested without multiple-comparison control, these correlations are marginal; the abstract states the anticorrelation as a result, while the text calls it an 'indication.' The authors should report p-values or bootstrap confidence intervals under a null of no correlation, add Spearman rank coefficients, and either strengthen or soften the claim in the abstract and Section 8 accordingly.
- [Section 5, Fig. 18] The C3K comparison shows a template-dependent zero point: with BVLS the mean offset moves from 0.02 to 0.10 dex and the scatter from 0.12 to 0.16 dex. This is a systematic uncertainty of order 0.1 dex that should be folded into the quoted accuracy of [Z]_y and into the interpretation of the flat gradient and the central dip. The paper currently presents the 0.02 dex offset as the headline validation without quantifying how much of the central dip amplitude (roughly 0.2–0.3 dex in Fig. 15) could be template-induced. Please add a systematic-error budget and state explicitly whether the central dip survives the C3K analysis.
minor comments (7)
- [Section 8] The acronym 'pPFX' in the Summary should be 'pPXF', as used elsewhere in the paper.
- [Title and front matter] There is an erroneous space in 'F ull Spectral Fitting' in the running title, and the typeset title has a space before the period in 'Survey . II'; these should be corrected.
- [Eq. (1), Section 2.2] The sentence 'Consequently, the sum over all b_i is also equal to unity' is terse; please spell out that both observed and template spectra are normalized to unity at 5500–5550 Å, so the fitted coefficients are normalized light fractions.
- [Section 4.1, Fig. 12] The quoted regression [Z]_y = 0.20 ± 0.02 − 0.01 ± 0.06 R/R25 does not state the radial range over which it was fitted; please state the range explicitly, especially since the central dip is excluded.
- [Section 3.1, Fig. 5] The statement 'No covariances between E(B-V) and RV were encountered' should specify whether this refers to the Monte Carlo error distributions of individual fits or to a spatial correlation in the maps, and how it was tested.
- [Section 4.3, Fig. 16] The 'weak indication of a small trend with Z_y' is not quantified; please provide the slope and significance, or state explicitly that it is driven by a single YMC point, as implied by the text.
- [Section 7, Fig. 21] The phrase 'age-divided mean stellar populations' is unclear; define it in terms of the b_y / b_o split used throughout the paper.
Circularity Check
No significant circularity; the central metallicity validation rests on independent stellar probes and the model comparisons are non-load-bearing.
full rationale
The paper's derivation chain is: observed TYPHOON spectra are fitted with FSPS/MILES-augmented SSP templates plus a dust attenuation law (Eq. 1), and the BVLS coefficients yield a mass-weighted young-population metallicity [Z]_y (Eqs. 3–7). The load-bearing validation in Section 4.3 compares [Z]_y with metallicities from BSGs, SSCs, and YMCs that are not constructed from the same fit; the quoted mean offset of 0.02 dex and scatter of 0.12 dex therefore test the fitting result against independent measurements rather than reproducing an input. The agreement with the Bresolin et al. (2016) chemical evolution model is a same-group citation, but the model is parameterized by azimuthally averaged stellar-to-gas mass ratios and is not fitted to the present [Z]_y values; moreover, the flat gradient is independently supported by H II region abundances. The pPXF re-analysis shares the SSP grid with BVLS, but the C3K run changes the stellar library, so the robustness tests are not reducible by construction. The central low-metallicity region lacks an individual stellar probe inside the dip, and the C3K check is reported only as global statistics; this is a validation-coverage caveat, not a circular-definition step. No equation in the paper defines the target result as an input or fits a parameter that is then renamed as a prediction.
Assumptions & free parameters
free parameters (5)
- t_y_lim =
0.1 Gyr
- t_o_lim =
1.6 Gyr
- Voronoi binning S/N target =
60 at 5000 A
- b_y minimum =
0.1
- b_o minimum =
0.2
assumptions (6)
- domain assumption Calzetti et al. (2000) attenuation law with variable R_V describes the dust attenuation toward the integrated stellar population in every bin.
- domain assumption FSPS v3.2 SSPs with MILES library augmented by young massive star spectra represent the stellar populations in M83 sufficiently accurately.
- domain assumption Nebular continuum contribution can be inferred from H-alpha/H-beta emission and included in the fit.
- domain assumption The 4000-7070 A window at R~800 is sufficient to break the age-metallicity degeneracy for young populations.
- domain assumption The chemical evolution model of Bresolin et al. (2016) (after Kudritzki et al. 2015) is a valid comparison for the observed metallicity profile.
- domain assumption Individual stellar probe metallicities (BSGs, YMCs, SSCs) share the same metallicity scale and trace the same young population as the fitted [Z]_y.
Cite this review
Pith. "Pith review of The TYPHOON Stellar Population Synthesis Survey. II. Pushing Full Spectral Fitting to the Limit in the Nearby Grand Design Barred Spiral M83." pith.science (2026). https://pith.science/paper/J2RETLAN
@misc{pith2026250521127,
  author       = {Pith},
  title        = {Pith review of: The TYPHOON Stellar Population Synthesis Survey. II. Pushing Full Spectral Fitting to the Limit in the Nearby Grand Design Barred Spiral M83},
  year         = {2026},
  howpublished = {\url{https://pith.science/paper/J2RETLAN}},
  note         = {Machine review of arXiv:2505.21127}
}
abstract
We apply population synthesis techniques to analyze TYPHOON long slit spectra of the starburst barred spiral galaxy M83. The analysis covers a central square of 5 arcmin side length. We determine the spatial distribution of dust through the analysis of reddening and extinction, together with star formation rates, ages, and metallicities of young and old stellar populations. For the first time, a spatial one-to-one comparison of metallicities derived from full-spectral fitting techniques with those obtained from individual young stellar probes has been carried out. The comparison with blue supergiant stars, young massive star clusters, and super star clusters shows a high degree of concordance when wavelength coverage in the $B$-band is available. The metallicity of the young population is supersolar and does not show a radial metallicity gradient along the investigated part of the disk, in agreement with our chemical evolution model. However, a notable decrease in metallicity is observed in a tightly confined region at the galaxy center, coinciding with circumnuclear orbits. We attribute this to matter infall either from the circumgalactic medium or a dwarf galaxy interloper or, alternatively, to AGN-interrupted chemical evolution. We confirm the presence of a dust cavity with a diameter of 260~pc close to the galaxy center. Dust absorption and molecular CO emission are spatially well correlated. We find an anticorrelation between R$_V$, the ratio of dust attenuation to reddening, and the emission strength of molecular species present in photo-dissociation regions. We confirm our results by using alternative fitting algorithms and stellar libraries.
Figures


Figures from the paper (17 more)


Reference graph
Works this paper leans on
-
[1]
Abel, N. P., van Hoof, P. A. M., Shaw, G., Ferland, G. J., & Elwert, T. 2008, ApJ, 686, 1125, doi: 10.1086/591505
doi:10.1086/591505 2008
-
[2]
Asplund, M., Grevesse, N., Sauval, A. J., & Scott, P. 2009, ARA&A, 47, 481, doi: 10.1146/annurev.astro.46.060407.145222
arXiv 2009
-
[3]
Bittner, A., S´ anchez-Bl´ azquez, P., Gadotti, D. A., et al. 2020, A&A, 643, A65, doi: 10.1051/0004-6361/202038450
-
[4]
2020, ApJ, 896, 13, doi: 10.3847/1538-4357/ab919d
Boecker, A., Alfaro-Cuello, M., Neumayer, N., Mart ´ ın-Navarro, I., & Leaman, R. 2020, ApJ, 896, 13, doi: 10.3847/1538-4357/ab919d
-
[5]
2009a, ApJ, 700, 309, doi: 10.1088/0004-637X/700/1/309
Bresolin, F., Gieren, W., Kudritzki, R.-P., et al. 2009a, ApJ, 700, 309, doi: 10.1088/0004-637X/700/1/309
-
[6]
Bresolin, F., Kennicutt, R. C., & Ryan-Weber, E. 2012, ApJ, 750, 122, doi: 10.1088/0004-637X/750/2/122
-
[7]
Bresolin, F., & Kennicutt, Jr., R. C. 2002, ApJ, 572, 838, doi: 10.1086/340371
doi:10.1086/340371 2002
-
[8]
Bresolin, F., Kudritzki, R.-P., & Urbaneja, M. A. 2022, ApJ, 940, 32, doi: 10.3847/1538-4357/ac9584
Show all 108 references
-
[9]
A., et al
Bresolin, F., Kudritzki, R.-P., Urbaneja, M. A., et al. 2016, ApJ, 830, 64, doi: 10.3847/0004-637X/830/2/64
2016 doi
-
[10]
2009b, ApJ, 695, 580, doi: 10.1088/0004-637X/695/1/580
Goddard, Q. 2009b, ApJ, 695, 580, doi: 10.1088/0004-637X/695/1/580
-
[11]
M., & Stasi´ nska, G
Bresolin, F., Schaerer, D., Gonz´ alez Delgado, R. M., & Stasi´ nska, G. 2005, A&A, 441, 981, doi: 10.1051/0004-6361:20053369
2005 doi
-
[12]
M., Stanway, E
Byrne, C. M., Stanway, E. R., Eldridge, J. J., McSwiney, L., & Townsend, O. T. 2022, MNRAS, 512, 5329, doi: 10.1093/mnras/stac807
2022 doi
-
[13]
N., Kruijssen, J
Callanan, D., Longmore, S. N., Kruijssen, J. M. D., et al. 2021, MNRAS, 505, 4310, doi: 10.1093/mnras/stab1527
2021 doi
- [14]
-
[15]
C., et al
Calzetti, D., Armus, L., Bohlin, R. C., et al. 2000, ApJ, 533, 682, doi: 10.1086/308692
2000 doi
-
[16]
C., Engelbracht, C
Calzetti, D., Kennicutt, R. C., Engelbracht, C. W., et al. 2007, ApJ, 666, 870, doi: 10.1086/520082
2007 doi
-
[17]
2015, Astronomy and Computing, 9, 20, doi: 10.1016/j.ascom.2014.10.004 —
Camps, P., & Baes, M. 2015, Astronomy and Computing, 9, 20, doi: 10.1016/j.ascom.2014.10.004 —. 2020, Astronomy and Computing, 31, 100381, doi: 10.1016/j.ascom.2020.100381
2015
-
[18]
2023, MNRAS, 526, 3273, doi: 10.1093/mnras/stad2597
Cappellari, M. 2023, MNRAS, 526, 3273, doi: 10.1093/mnras/stad2597
2023 doi
-
[19]
2003, MNRAS, 342, 345, doi: 10.1046/j.1365-8711.2003.06541.x TYPHOON: M83 23
Cappellari, M., & Copin, Y. 2003, MNRAS, 342, 345, doi: 10.1046/j.1365-8711.2003.06541.x TYPHOON: M83 23
2003
-
[20]
2004, PASP, 116, 138, doi: 10.1086/381875
Cappellari, M., & Emsellem, E. 2004, PASP, 116, 138, doi: 10.1086/381875
2004 doi
-
[21]
A., Clayton, G
Cardelli, J. A., Clayton, G. C., & Mathis, J. S. 1989, ApJ, 345, 245, doi: 10.1086/167900
1989 doi
-
[22]
Cardoso, L. S. M., Gomes, J. M., & Papaderos, P. 2017, A&A, 604, A99, doi: 10.1051/0004-6361/201630378
2017 doi
-
[23]
2020, MNRAS, 493, 4094, doi: 10.1093/mnras/staa397
Carrillo, A., Jogee, S., Drory, N., et al. 2020, MNRAS, 493, 4094, doi: 10.1093/mnras/staa397
2020 doi
-
[24]
Cezario, E., Coelho, P. R. T., Alves-Brito, A., Forbes, D. A., & Brodie, J. P. 2013, A&A, 549, A60, doi: 10.1051/0004-6361/201220336
2013 doi
-
[25]
J., et al
Chen, Q.-H., Grasha, K., Battisti, A. J., et al. 2023, MNRAS, 519, 4801, doi: 10.1093/mnras/stac3790
2023 doi
-
[26]
J., et al
Chen, Q.-H., Grasha, K., Battisti, A. J., et al. 2024, Monthly Notices of the Royal Astronomical Society, 534, 883, doi: 10.1093/mnras/stae2119
2024 doi
-
[27]
Clark, C. J. R., Verstocken, S., Bianchi, S., et al. 2018, A&A, 609, A37, doi: 10.1051/0004-6361/201731419
2018 doi
-
[28]
Conroy, C., & Gunn, J. E. 2010, ApJ, 712, 833, doi: 10.1088/0004-637X/712/2/833
2010 doi
-
[29]
E., & White, M
Conroy, C., Gunn, J. E., & White, M. 2009, ApJ, 699, 486, doi: 10.1088/0004-637X/699/1/486
2009 doi
-
[30]
P., Zaritsky, D., et al
Conroy, C., Naidu, R. P., Zaritsky, D., et al. 2019, ApJ, 887, 237, doi: 10.3847/1538-4357/ab5710
2019 doi
-
[31]
1989, A&A Rv, 1, 261, doi: 10.1007/BF00873080
Contopoulos, G., & Grosbol, P. 1989, A&A Rv, 1, 261, doi: 10.1007/BF00873080
1989 doi
-
[32]
M., Skrutskie, M
Cutri, R. M., Skrutskie, M. F., van Dyk, S., et al. 2003, VizieR Online Data Catalog: 2MASS All-Sky Catalog of Point Sources (Cutri+ 2003), VizieR On-line Data Catalog: II/246. Originally published in: University of Massachusetts and Infrared Processing and Analysis Center, (I...
2003 doi
-
[33]
2017, ApJ, 847, 112, doi: 10.3847/1538-4357/aa89ed de Vaucouleurs, G
Davies, B., Kudritzki, R.-P., Lardo, C., et al. 2017, ApJ, 847, 112, doi: 10.3847/1538-4357/aa89ed de Vaucouleurs, G. 1991, Science, 254, 1667 Della Bruna, L., Adamo, A., Amram, P., et al. 2022, A&A, 660, A77, doi: 10.1051/0004-6361/202142315 D ´ ıaz, R. J., Dottori, H., Aguer...
2017 doi
-
[34]
A., Kewley, L
Dopita, M. A., Kewley, L. J., Sutherland, R. S., & Nicholls, D. C. 2016, Ap&SS, 361, 61, doi: 10.1007/s10509-016-2657-8
2016 doi
-
[35]
A., Blair, W
Dopita, M. A., Blair, W. P., Long, K. S., et al. 2010, ApJ, 710, 964, doi: 10.1088/0004-637X/710/2/964
2010 doi
-
[36]
Draine, B. T. 1978, ApJS, 36, 595, doi: 10.1086/190513
1978 doi
-
[37]
2005, in American Institute of Physics Conference
Dwek, E. 2005, in American Institute of Physics Conference
2005
-
[38]
761, The Spectral Energy Distributions of Gas-Rich Galaxies: Confronting Models with Data, ed
Series, Vol. 761, The Spectral Energy Distributions of Gas-Rich Galaxies: Confronting Models with Data, ed. C. C. Popescu & R. J. Tuffs (AIP), 103–122, doi: 10.1063/1.1913921
-
[39]
2022, A&A, 659, A191, doi: 10.1051/0004-6361/202141727
Emsellem, E., Schinnerer, E., Santoro, F., et al. 2022, A&A, 659, A191, doi: 10.1051/0004-6361/202141727
2022 doi
- [40]
-
[41]
C., Babb, J
Forrey, R. C., Babb, J. F., Stancil, P. C., & McLaughlin, B. M. 2018, MNRAS, 479, 4727, doi: 10.1093/mnras/sty1739
2018 doi
-
[42]
M., et al
Franchetto, A., Mingozzi, M., Poggianti, B. M., et al. 2021, ApJ, 923, 28, doi: 10.3847/1538-4357/ac2510
2021 doi
-
[43]
2016, A&A, 585, A21, doi: 10.1051/0004-6361/201526796
Frick, P., Stepanov, R., Beck, R., et al. 2016, A&A, 585, A21, doi: 10.1051/0004-6361/201526796
2016 doi
-
[44]
A., S´ anchez-Bl´ azquez, P., Falc´ on-Barroso, J., et al
Gadotti, D. A., S´ anchez-Bl´ azquez, P., Falc´ on-Barroso, J., et al. 2019, MNRAS, 482, 506, doi: 10.1093/mnras/sty2666
2019 doi
-
[45]
1991, A&A, 243, 309
Vauglin, I. 1991, A&A, 243, 309
1991
-
[46]
Z., Kudritzki, R., Evans, C., et al
Gazak, J. Z., Kudritzki, R., Evans, C., et al. 2015, ApJ, 805, 182, doi: 10.1088/0004-637X/805/2/182
2015 doi
-
[48]
2023, in Resolving the Rise and Fall of Star Formation in Galaxies, ed
Grasha, K. 2023, in Resolving the Rise and Fall of Star Formation in Galaxies, ed. T. Wong & W.-T. Kim, Vol. 373, 234–241, doi: 10.1017/S174392132200429X
2023 doi
-
[49]
H., Battisti, A
Grasha, K., Chen, Q. H., Battisti, A. J., et al. 2022, ApJ, 929, 118, doi: 10.3847/1538-4357/ac5ab2
2022 doi
-
[50]
2023, MNRAS, 520, 4902, doi: 10.1093/mnras/stad114
Groves, B., Kreckel, K., Santoro, F., et al. 2023, MNRAS, 520, 4902, doi: 10.1093/mnras/stad114
2023 doi
-
[51]
2019, ApJ, 884, 100, doi: 10.3847/1538-4357/ab41ff
Harada, N., Sakamoto, K., Mart ´ ın, S., et al. 2019, ApJ, 884, 100, doi: 10.3847/1538-4357/ab41ff
2019 doi
-
[52]
J., & Smith, D
Harris, J., Calzetti, D., Gallagher, John S., I., Conselice, C. J., & Smith, D. A. 2001, AJ, 122, 3046, doi: 10.1086/324230
2001 doi
-
[53]
Herbst, E., & van Dishoeck, E. F. 2009, ARA&A, 47, 427, doi: 10.1146/annurev-astro-082708-101654
2009 doi
-
[54]
2018, MNRAS, 473, 826, doi: 10.1093/mnras/stx2397
Hernandez, S., Larsen, S., Trager, S., Kaper, L., & Groot, P. 2018, MNRAS, 473, 826, doi: 10.1093/mnras/stx2397
2018 doi
-
[55]
2019, ApJ, 872, 116, doi: 10.3847/1538-4357/ab017a
Hernandez, S., Larsen, S., Aloisi, A., et al. 2019, ApJ, 872, 116, doi: 10.3847/1538-4357/ab017a
2019 doi
-
[56]
L., et al
Hernandez, S., Aloisi, A., James, B. L., et al. 2021, ApJ, 908, 226, doi: 10.3847/1538-4357/abd6c4 24 Sextl et al
2021 doi
-
[57]
J., et al
Hernandez, S., Jones, L., Smith, L. J., et al. 2023, ApJ, 948, 124, doi: 10.3847/1538-4357/acc837
2023 doi
-
[58]
2008, ApJ, 683, 630, doi: 10.1086/589920
Vinciguerra, M. 2008, ApJ, 683, 630, doi: 10.1086/589920
2008 doi
-
[59]
2018, PASJ, 70, 73, doi: 10.1093/pasj/psy071
Hirota, A., Egusa, F., Baba, J., et al. 2018, PASJ, 70, 73, doi: 10.1093/pasj/psy071
2018 doi
-
[60]
T., Kudritzki, R.-P., Kewley, L
Ho, I. T., Kudritzki, R.-P., Kewley, L. J., et al. 2015, MNRAS, 448, 2030, doi: 10.1093/mnras/stv067
2015 doi
-
[61]
T., Medling, A
Ho, I. T., Medling, A. M., Groves, B., et al. 2016, Ap&SS, 361, 280, doi: 10.1007/s10509-016-2865-2
2016 doi
-
[62]
T., Seibert, M., Meidt, S
Ho, I. T., Seibert, M., Meidt, S. E., et al. 2017, ApJ, 846, 39, doi: 10.3847/1538-4357/aa8460
2017 doi
-
[63]
T., Meidt, S
Ho, I. T., Meidt, S. E., Kudritzki, R.-P., et al. 2018, A&A, 618, A64, doi: 10.1051/0004-6361/201833262
2018 doi
- [65]
-
[66]
2021, MNRAS, 502, 1967, doi: 10.1093/mnras/stab147
Kang, X., Chang, R., Kudritzki, R.-P., Gong, X., & Zhang, F. 2021, MNRAS, 502, 1967, doi: 10.1093/mnras/stab147
2021 doi
-
[67]
2023, A&A, 679, A83, doi: 10.1051/0004-6361/202347677
Kang, X., Kudritzki, R.-P., & Zhang, F. 2023, A&A, 679, A83, doi: 10.1051/0004-6361/202347677
2023 doi
-
[68]
1998, ApJ, 498, 541, doi: 10.1086/305588
Kennicutt, Robert C., J. 1998, ApJ, 498, 541, doi: 10.1086/305588
1998 doi
-
[69]
J., Dopita, M
Kewley, L. J., Dopita, M. A., Sutherland, R. S., Heisler, C. A., & Trevena, J. 2001, ApJ, 556, 121, doi: 10.1086/321545
2001 doi
-
[70]
H., Sharp, R
Knapen, J. H., Sharp, R. G., Ryder, S. D., et al. 2010, MNRAS, 408, 797, doi: 10.1111/j.1365-2966.2010.17180.x
2010
-
[71]
2023, ApJ, 949, 108, doi: 10.3847/1538-4357/acc65e
Koda, J., Hirota, A., Egusa, F., et al. 2023, ApJ, 949, 108, doi: 10.3847/1538-4357/acc65e
2023 doi
-
[72]
2008, MNRAS, 385, 1998, doi: 10.1111/j.1365-2966.2008.12908.x
Soubiran, C. 2008, MNRAS, 385, 1998, doi: 10.1111/j.1365-2966.2008.12908.x
2008
-
[73]
T., Blanc, G
Kreckel, K., Ho, I. T., Blanc, G. A., et al. 2019, ApJ, 887, 80, doi: 10.3847/1538-4357/ab5115
2019 doi
-
[74]
P., Castro, N., Urbaneja, M
Kudritzki, R. P., Castro, N., Urbaneja, M. A., et al. 2016, ApJ, 829, 70, doi: 10.3847/0004-637X/829/2/70
2016 doi
-
[75]
T., Schruba, A., et al
Kudritzki, R.-P., Ho, I. T., Schruba, A., et al. 2015, MNRAS, 450, 342, doi: 10.1093/mnras/stv522
2015 doi
-
[76]
A., Bresolin, F., et al
Kudritzki, R.-P., Urbaneja, M. A., Bresolin, F., et al. 2024, ApJ, 977, 217, doi: 10.3847/1538-4357/ad9279 —. 2008, ApJ, 681, 269, doi: 10.1086/588647
2024 doi
-
[77]
A., Gazak, Z., et al
Kudritzki, R.-P., Urbaneja, M. A., Gazak, Z., et al. 2012, ApJ, 747, 15, doi: 10.1088/0004-637X/747/1/15
2012 doi
-
[78]
P., et al
Lardo, C., Davies, B., Kudritzki, R. P., et al. 2015, ApJ, 812, 160, doi: 10.1088/0004-637X/812/2/160
2015 doi
-
[79]
H., Pak, M., Jeong, H., & Oh, S
Lee, J. H., Pak, M., Jeong, H., & Oh, S. 2023, MNRAS, 521, 4207, doi: 10.1093/mnras/stad814
2023 doi
-
[80]
K., Sandstrom, K
Leroy, A. K., Sandstrom, K. M., Lang, D., et al. 2019, ApJS, 244, 24, doi: 10.3847/1538-4365/ab3925
2019 doi
-
[81]
2022, ApJ, 932, 29, doi: 10.3847/1538-4357/ac69cc
Liu, C., Kudritzki, R.-P., Zhao, G., et al. 2022, ApJ, 932, 29, doi: 10.3847/1538-4357/ac69cc
2022 doi
-
[82]
S., Narayan, G., & Kirshner, R
Mandel, K. S., Narayan, G., & Kirshner, R. P. 2011, ApJ, 731, 120, doi: 10.1088/0004-637X/731/2/120 Mart ´ ın, S., Requena-Torres, M. A., Mart ´ ın-Pintado, J., &
2011 doi
-
[83]
2008, ApJ, 678, 245, doi: 10.1086/533409 Mart ´ ın, S., Kohno, K., Izumi, T., et al
Mauersberger, R. 2008, ApJ, 678, 245, doi: 10.1086/533409 Mart ´ ın, S., Kohno, K., Izumi, T., et al. 2015, A&A, 573, A116, doi: 10.1051/0004-6361/201425105 Moll´ a, M., D ´ ıaz,´A. I., Ascasibar, Y., & Gibson, B. K. 2017, MNRAS, 468, 305, doi: 10.1093/mnras/stx419 Moll´ a, M....
2008 doi
-
[84]
2021, MNRAS, 502, 5508, doi: 10.1093/mnras/stab449
Parikh, T., Thomas, D., Maraston, C., et al. 2021, MNRAS, 502, 5508, doi: 10.1093/mnras/stab449
2021 doi
-
[85]
2023, A&A, 673, A147, doi: 10.1051/0004-6361/202245673
Pessa, I., Schinnerer, E., Sanchez-Blazquez, P., et al. 2023, A&A, 673, A147, doi: 10.1051/0004-6361/202245673
2023 doi
-
[86]
D., Ilha, G
Riffel, R., Mallmann, N. D., Ilha, G. S., et al. 2021, MNRAS, 501, 4064, doi: 10.1093/mnras/staa3907
2021 doi
-
[87]
L., Raimundo, S
Robbins, S. L., Raimundo, S. I., & Malkan, M. A. 2025, ApJ, 980, 64, doi: 10.3847/1538-4357/ada294 R¨ ollig, M., Szczerba, R., Ossenkopf, V., & Gl¨ uck, C. 2013, A&A, 549, A85, doi: 10.1051/0004-6361/201118190
2025 doi
-
[88]
H., et al
Rosado-Belza, D., Falc´ on-Barroso, J., Knapen, J. H., et al. 2020, A&A, 644, A116, doi: 10.1051/0004-6361/202039530 S´ anchez, S. F., Rosales-Ortega, F. F., Iglesias-P´ aramo, J., et al. 2014, A&A, 563, A49, doi: 10.1051/0004-6361/201322343 S´ anchez-Bl´ azquez, P., Peletier,...
2020
-
[89]
F., & Finkbeiner, D
Schlafly, E. F., & Finkbeiner, D. P. 2011, ApJ, 737, 103, doi: 10.1088/0004-637X/737/2/103
2011 doi
-
[90]
K., Cacho, R., Ruiz-Lara, T., et al
Seidel, M. K., Cacho, R., Ruiz-Lara, T., et al. 2015, MNRAS, 446, 2837, doi: 10.1093/mnras/stu2295
2015 doi
-
[91]
2021, ApJ, 914, 94, doi: 10.3847/1538-4357/abfafa TYPHOON: M83 25
Weiss, A. 2021, ApJ, 914, 94, doi: 10.3847/1538-4357/abfafa TYPHOON: M83 25
2021 doi
-
[92]
J., & Ho, I
Sextl, E., Kudritzki, R.-P., Zahid, H. J., & Ho, I. T. 2023, ApJ, 949, 60, doi: 10.3847/1538-4357/acc579
2023 doi
-
[93]
2024, ApJ, 960, 83, doi: 10.3847/1538-4357/ad08b3
Sextl, E., Kudritzki, R.-P., Burkert, A., et al. 2024, ApJ, 960, 83, doi: 10.3847/1538-4357/ad08b3
2024 doi
-
[94]
T., Davies, R
Shimizu, T. T., Davies, R. I., Lutz, D., et al. 2019, MNRAS, 490, 5860, doi: 10.1093/mnras/stz2802 Sipil¨ a, O., Zhao, B., & Caselli, P. 2020, A&A, 640, A94, doi: 10.1051/0004-6361/202038353
2019 doi
-
[95]
2019, A&A, 628, A38, doi: 10.1051/0004-6361/201834665
Spitoni, E., Cescutti, G., Minchev, I., et al. 2019, A&A, 628, A38, doi: 10.1051/0004-6361/201834665
2019 doi
-
[96]
1995, Computational Statistics, 10, 129141 Thain´ a-Batista, J., Cid Fernandes, R., Herpich, F
Stark, P., & Parker, R. 1995, Computational Statistics, 10, 129141 Thain´ a-Batista, J., Cid Fernandes, R., Herpich, F. R., et al. 2023, MNRAS, 526, 1874, doi: 10.1093/mnras/stad2698
1995 doi
-
[97]
A., Braun, R., & Walterbos, R
Thilker, D. A., Braun, R., & Walterbos, R. A. M. 2000, AJ, 120, 3070, doi: 10.1086/316852
2000 doi
-
[98]
B., Rosas-Guevara, Y., Sillero, E., et al
Tissera, P. B., Rosas-Guevara, Y., Sillero, E., et al. 2022, MNRAS, 511, 1667, doi: 10.1093/mnras/stab3644
2022 doi
-
[99]
B., Rizzi, L., Shaya, E
Tully, R. B., Rizzi, L., Shaya, E. J., et al. 2009, AJ, 138, 323, doi: 10.1088/0004-6256/138/2/323
2009 doi
-
[100]
A., Kudritzki, R.-P., Gieren, W., et al
Urbaneja, M. A., Kudritzki, R.-P., Gieren, W., et al. 2017, AJ, 154, 102, doi: 10.3847/1538-3881/aa79a8
2017 doi
-
[101]
2024, MNRAS, 527, 10, doi: 10.1093/mnras/stad3150
Vallini, L., Witstok, J., Sommovigo, L., et al. 2024, MNRAS, 527, 10, doi: 10.1093/mnras/stad3150
2024 doi
-
[102]
2016, MNRAS, 463, 3409, doi: 10.1093/mnras/stw2231
Vazdekis, A., Koleva, M., Ricciardelli, E., R¨ ock, B., & Falc´ on-Barroso, J. 2016, MNRAS, 463, 3409, doi: 10.1093/mnras/stw2231
2016 doi
-
[103]
2016, A&A, 586, A13, doi: 10.1051/0004-6361/201527586
Viaene, S., Baes, M., Bendo, G., et al. 2016, A&A, 586, A13, doi: 10.1051/0004-6361/201527586
2016 doi
-
[104]
2017, Molecular Astrophysics, 9, 1, doi: https://doi.org/10.1016/j.molap.2017.11.001
Wakelam, V., Bron, E., Cazaux, S., et al. 2017, Molecular Astrophysics, 9, 1, doi: https://doi.org/10.1016/j.molap.2017.11.001
2017 doi
-
[105]
Walter, F., Brinks, E., de Blok, W. J. G., et al. 2008, AJ, 136, 2563, doi: 10.1088/0004-6256/136/6/2563
2008 doi
-
[106]
C., & Draine, B
Weingartner, J. C., & Draine, B. T. 2001, ApJS, 134, 263, doi: 10.1086/320852
2001 doi
-
[107]
2011, MNRAS, 414, 3719, doi: 10.1111/j.1365-2966.2011.18675.x
Westmoquette, M., Smith, L., & Iii, J. 2011, MNRAS, 414, 3719, doi: 10.1111/j.1365-2966.2011.18675.x
2011
-
[108]
M., Maraston, C., Thomas, D., et al
Wilkinson, D. M., Maraston, C., Thomas, D., et al. 2015, Monthly Notices of the Royal Astronomical Society, 449, 328, doi: 10.1093/mnras/stv301
2015 doi
-
[109]
G., Vallini, L., & Chevance, M
Wolfire, M. G., Vallini, L., & Chevance, M. 2022, ARA&A, 60, 247, doi: 10.1146/annurev-astro-052920-010254
2022 doi
-
[110]
A., Alves, J., et al
Zucker, C., Goodman, A. A., Alves, J., et al. 2022, Nature, 601, 334, doi: 10.1038/s41586-021-04286-5
2022 doi
Reviewed August 7, 2026 · model on record in the stance chip above.
Discussion (0). Sign in to comment.