REVIEW 4 major objections 5 minor 43 references
The Families that Stay Together: A Network Analysis of Dynastic Power in Philippine Politics
T0 review · 4 major / 5 minor · reviewed 2026-08-07 · deepseek-v4-flash
Pith's one-line read Clan structure, not seat share, predicts lower HDI in Philippine provinces
desk verdict Serious descriptive value and clever network metrics, but the headline HDI/clan-structure claim rests on a CGC that measures whole-network sparsity, not within-clan inequality. read the letter →
The pith
A machine-rendered reading of the paper's core claim, the machinery that carries it, and where it could break.
The reading
What carries the argument
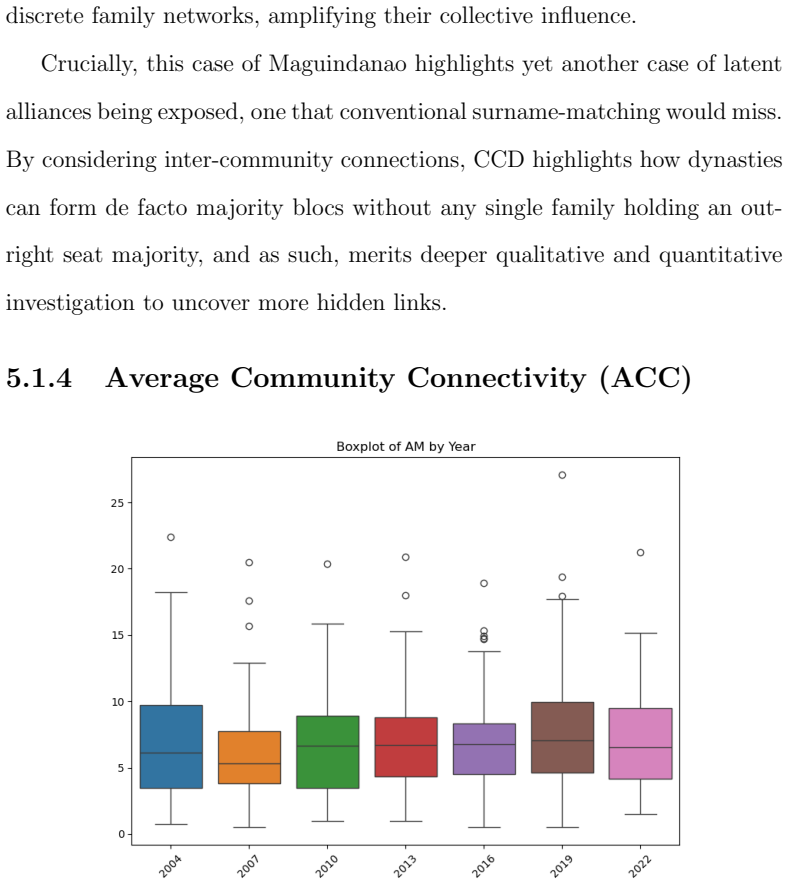
The carrying objects are four graph-theoretic indicators computed on province-year networks whose vertices are elected politicians and whose weighted edges encode shared surnames or middle names, with weights scaled by position and approximate consanguinity. Political HHI measures concentration of weighted seat share across Leiden-detected communities; the Centrality Gini Coefficient (CGC) measures inequality of weighted degree centrality across all politicians in the network; Connected Component Density (CCD) measures how many politicians belong to the same connected component; and Average Community Connectivity (ACC) measures, via vertex connectivity, how many nodes must be removed to break a clan apart. The Leiden algorithm supplies the clan boundaries, and the Linear Mixed Model with province-level random intercepts carries the development regressions.
What would settle it
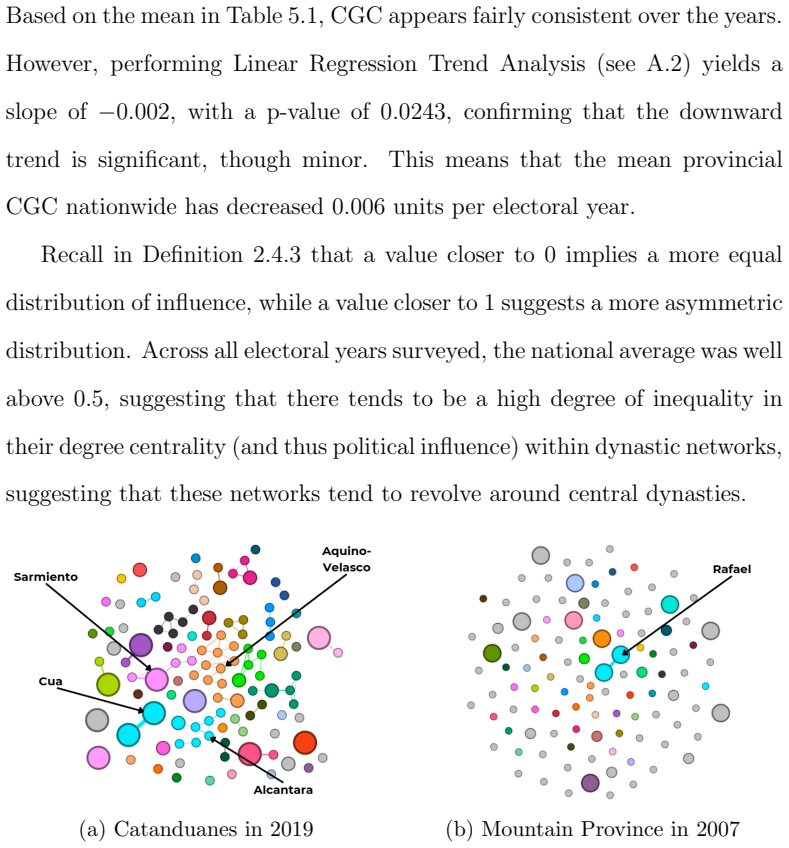
Re-estimate the HDI regression restricting CGC to the giant connected component or to dynastic members only, or add a control for the share of isolated nodes; if the significant negative coefficient on CGC disappears, the 'clan structure' interpretation is an artifact of network sparsity. The Mountain Province 2007 case (CGC=0.978 with exactly two linked politicians) is a natural out-of-sample test.
Extended reading notes
Core claim
The paper's central claim is that a ruling dynasty's effect on development is shaped more by the internal and inter-clan geometry of family networks than by the sheer share of seats a clan controls. Concretely, in a linear mixed model with provincial random effects and time fixed effects, the Centrality Gini Coefficient (the Gini index of politicians' weighted degree centralities) and the Connected Component Density (one minus the ratio of connected components to politicians) both carry significant negative coefficients in predicting provincial HDI, whereas the Political Herfindahl-Hirschman Index is insignificant. The same model finds no significant link between any dynastic indicator and poverty incidence. In the reverse direction, poverty incidence is positively associated with intra-clan cohesion (ACC) and its lag with inter-clan density (CCD), while higher HDI predicts a lower Centrality Gini Coefficient. The paper presents these results as evidence that clan structure, rather than power concentration alone, is the chief determinant of a dynasty's developmental impact.
Load-bearing premise
The claim that high CGC captures power asymmetry within clans rests on a metric computed over the whole political network, including many isolated non-dynastic politicians, so a high CGC can be produced by a single small connected pair in a sparse network rather than by inequality within a clan.
Editorial extensions
If this is right
- If clan structure is the operative channel, then policies that break inter-clan alliances or disperse power within clans may matter more than caps on seat concentration.
- Higher party-hopping among dynasts implies that strengthening parties as credible long-term organizations could reduce reliance on kinship networks.
- The reverse-direction results imply a feedback loop: poverty makes clans tighter-knit and more interconnected, which in turn predicts lower HDI, potentially locking poor provinces into dynastic rule.
- The insignificance of HHI for HDI qualifies prior work that used concentration alone, suggesting those estimates may understate or misattribute the developmental cost of dynasties.
Reading between the lines
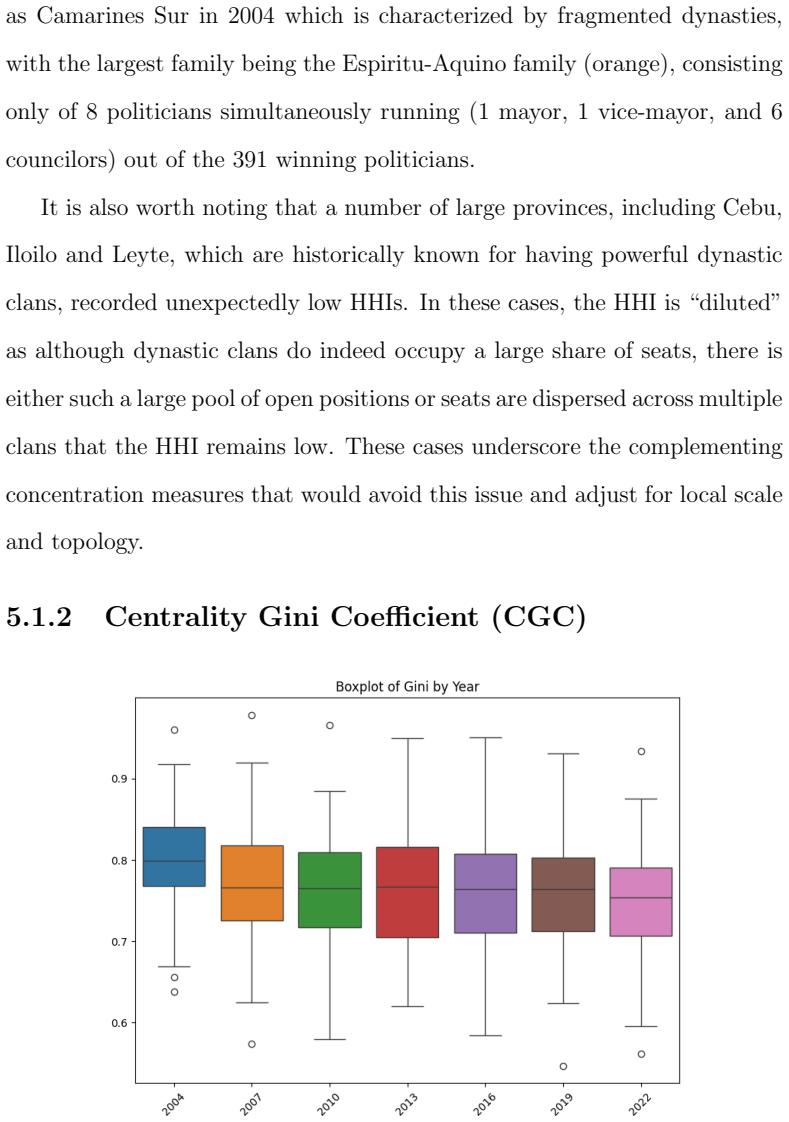
- The CGC is defined over all politicians, not just clan members, so the paper's interpretation of high CGC as "inequalities of influence between clan members" is not strictly supported by the metric; high CGC can arise from network sparsity (e.g., Mountain Province 2007), so the HDI-CGC coefficient may partly reflect fragmentation rather than intra-clan inequality.
- Because family ties are inferred from shared surnames and middle names, the network may overstate dynastic structure in provinces with common surnames, though within-province matching mitigates this.
- The bidirectional LMM results suggest a self-reinforcing equilibrium that could be modeled explicitly in future work, e.g., as a dynamical system of dynasty density and development.
- The same indicator set could be applied to other countries with weak parties and strong kinship politics to test whether clan structure is the generalizable driver.
Editorial analysis
A structured set of objections, weighed in public.
Referee Report
Summary. The paper reconstructs provincial political kinship networks from Philippine local election returns (2004–2022), identifies clans via the Leiden community-detection algorithm, and proposes four network indicators: Political HHI, Centrality Gini Coefficient (CGC), Connected Component Density (CCD), and Average Community Connectivity (ACC). It reports that dynasties have grown stronger and more interconnected, that dynastic candidates switch parties more often than non-dynasts, and that provinces with high CGC and high CCD have significantly lower Human Development Index scores in a Linear Mixed Model with provincial random intercepts and time fixed effects.
Significance. If the interpretation of the indicators were valid, the paper would provide a useful set of structural measures for studying political dynasties and a provocative empirical result—that clan structure, rather than concentration per se, predicts lower human development. The paper is unusually transparent about some modeling choices (e.g., explicitly labeling the node weights arbitrary) and provides extensive appendix tables, which aids reproducibility. The algebraic equivalence between the two CGC formulas is correctly demonstrated. However, the central developmental claim rests on a metric whose definition does not match the paper's stated interpretation, and the absence of sensitivity analyses leaves the quantitative conclusions vulnerable to the arbitrary weights and community-detection settings.
major comments (4)
- [Definition 2.4.5, Eq. (2.4.2.2); Section 5.1.2; Table 5.3] The CGC is defined as the Gini coefficient of weighted degree over all politicians in the provincial network; community or clan labels never enter its computation. The abstract's characterization of CGC as 'inequalities of influence between clan members' is therefore not supported by the metric's definition. The paper's own example of Mountain Province 2007 (CGC = 0.978) is a network with exactly one two-node family and all other politicians isolated, so the high CGC is driven by many zero-degree nodes, i.e., network sparsity, not by within-clan asymmetry. Consequently, the HDI regression coefficient for CGC (-0.336, p < 0.001) cannot be interpreted as evidence about power asymmetries within clans; it may simply capture the share of isolated politicians. The paper should either redefine CGC using within-community degree distributions or include the share of isolated nodes / network sparsity as a control variable and re-estimate the HDI model.
- [Section 4.2, Table 4.4, Section 4.2.1] The node weights (Councilor 2, Vice Mayor 3, Mayor 5, etc.) are explicitly described as arbitrary, and the Leiden resolution is fixed at 1 with no sensitivity analysis. Since both CGC and HHI depend directly on these choices, and since CGC is one of the two significant predictors in the headline HDI regression, the qualitative conclusions should be shown to be robust across a reasonable range of weight schemes and resolution parameters. At a minimum, the authors should report the correlation between the metrics under alternative settings or re-run the LMM for a few representative choices.
- [Section 5.2] The abstract and conclusion state that party-hopping rates are significantly higher among dynastic candidates 'across every election cycle,' but the only reported inferential result is a single Wilcoxon signed-rank test (statistic 56691.5, p = 0.0039) that appears to pool all province–year pairs. No per-cycle test results are shown. Please either provide the per-cycle test statistics and p-values or revise the claim to state that the difference is significant when all cycles are pooled.
- [Section 5.3.1, Table 5.4] The LMM's conditional R2 of 0.8352 versus OLS R2 of 0.093 is presented as evidence that the model provides a strong fit, but conditional R2 includes the variance explained by provincial random intercepts, which are not the dynastic indicators of interest. The paper should also report marginal R2 and standardized fixed-effect coefficients so that the reader can judge how much of the variation in HDI is actually associated with CGC and CCD, as opposed to province-level heterogeneity.
minor comments (5)
- [Definition 2.4.6] The definition heading reads 'Connected Component Density (CDC)' while the notation and all later uses are 'CCD'; please make the abbreviation consistent.
- [Table 5.3] The table header says 'Dependent Variable: Provincial Human Poverty Index (HDI)'; this should read 'Provincial Human Development Index.'
- [Section 5.1.3, Figure 5.6 caption] The caption refers to 'Bulacan in 2014' but the data cover the 2013 election; please correct the year.
- [Section 5.1.2, Figure 5.4 caption] The caption says 'Mountain Province in 2022' while the text and table identify the highest CGC as Mountain Province 2007; please reconcile.
- [Throughout] There are several typographical errors, including 'holisistic' (Section 4.5.1), 'anectodal' (Section 3.4), 'disefranchisement' (Section 6.0.3), and 'Politican' (Table 4.3). A careful proofread is needed.
Circularity Check
No significant circularity: the network indicators are deterministic functions of pre-specified kinship edges, and the HDI, poverty, and party-hopping outcomes are external data not used to fit the indicators.
full rationale
The derivation chain is self-contained in the sense relevant to circularity. The four indicators (HHI, CGC, CCD, ACC) are closed-form functions of the reconstructed kinship network; the edge weights and node position weights are fixed a priori in Tables 4.4 and 4.5, and the Leiden community-detection resolution is fixed at 1 (Section 4.2.1). No socioeconomic outcome (HDI or poverty) is used to calibrate these weights, choose the community-detection parameters, or define any indicator. The HDI and poverty data are external (PSA, HDN) and are matched to the network metrics with a stated two-year lag (Section 4.5.2), so the LMM results in Section 5.3 are genuine associations between independently measured outcomes and network-derived regressors rather than fitted-input predictions. The algebraic equality between the two CGC formulas (Equations 2.4.2.1 and 2.4.2.2) is explicitly derived in the text and is correctly shown; it is a tautological reformulation, not a circular claim. The party-hopping finding is also non-circular: dynastic status is defined by simultaneous office-holding within a detected community, while the outcome is a separate variable indicating a change of party affiliation between successive terms (Section 4.1.3); the two definitions do not overlap. There are no load-bearing self-citations: all cited prior work (Querubin, Mendoza et al., Cruz et al., Traag et al., etc.) is external to the three thesis authors, and no uniqueness theorem or prior result by the same authors is invoked to force the choice of indicators. The most commonly raised concern—that CGC is computed over all politicians in the provincial network rather than restricted to clan members, so its interpretation as 'inequalities of influence between clan members' is strained (see the Mountain Province 2007 example in Section 5.1.2)—is a construct-validity limitation, not a circularity. CGC is not defined in terms of HDI, poverty, or clan-structure outcomes, and the HDI regression does not reduce to the definition of CGC. The paper's own scope and limitations section acknowledges the name-matching heuristic and the use of secondary data, but it does not conceal any input-output identity. Therefore the correct circularity finding is 0.
Assumptions & free parameters
free parameters (3)
- Position node weights =
Councilor 2, Board Member 2, Vice Mayor 3, Vice Governor 3, Mayor 5, House Rep 5, Governor 5
- Consanguinity scalar factors =
1.00 same middle+last, 0.75 same last, 0.50 matching middle+last, 0.25 same middle
- Leiden resolution =
1
assumptions (4)
- domain assumption Matching surname or middle name within the same province implies kinship.
- domain assumption Communities detected by the Leiden Algorithm correspond to actual political dynasties.
- domain assumption The assigned node weights reflect relative political influence.
- ad hoc to paper CGC measures inequality of influence between clan members.
Cite this review
Pith. "Pith review of The Families that Stay Together: A Network Analysis of Dynastic Power in Philippine Politics." pith.science (2026). https://pith.science/paper/WVUUQJRA
@misc{pith2026250521280,
  author       = {Pith},
  title        = {Pith review of: The Families that Stay Together: A Network Analysis of Dynastic Power in Philippine Politics},
  year         = {2026},
  howpublished = {\url{https://pith.science/paper/WVUUQJRA}},
  note         = {Machine review of arXiv:2505.21280}
}
read the original abstract
Dynasties have long dominated Philippine politics. Despite the theoretical consensus that dynastic rule erodes democratic accountability, there is limited empirical evidence establishing dynasties' true impact on development. A key challenge has been developing robust metrics for characterizing dynasties that facilitate meaningful comparisons across geographies and election cycles. Using election data from 2004 to 2022, we leverage methods from graph theory to develop four indicators to investigate dynastic evolution: Political Herfindahl-Hirschman Index (HHI), measuring dynastic power concentration; Centrality Gini Coefficient (CGC), reflecting inequalities of influence between clan members; Connected Component Density (CCD), representing the degree of inter-clan connection; and Average Community Connectivity (ACC), quantifying intra-clan cohesion. Our analysis reveals three key findings. Firstly, dynasties have grown stronger and more interconnected, occupying an increasing share of elected positions. Dominant clans have also remained tightly knit, but with great power imbalances between members. Secondly, we examine variations in party-hopping between dynastic and non-dynastic candidates. Across every election cycle, party-hopping rates are significantly higher (p<0.01) among dynastic candidates than non-dynasts, suggesting that the dominance of dynasties may weaken institutional trust within parties. Finally, applying a Linear Mixed Model regression, controlling for geographic random-effects and time fixed-effects, we observe that provinces with high power asymmetries within clans (high CGCs) and with deeply interconnected clans (high CCDs) record significantly lower (p<0.05) Human Development Index scores. These findings suggest that clan structure, rather than power concentration alone--may be the chief determinant of a ruling dynasty's developmental impact.
Figures


Figures from the paper (18 more)







Reference graph
Works this paper leans on
-
[1]
Mea- suring political dynasties in Metro Manila
Romeo T. Balanquit, Lianca O. Coronel, and Jose Y. Yambao. “Mea- suring political dynasties in Metro Manila”. In: Philippine Review of Economics (Online ISSN 2984-8156) 54.1 (Nov. 2, 2017). Number: 1, pp. 120–137. issn: 2984-8156. url: https://pre.econ.upd.edu.ph/ index.php/pre/article/view/952 (visited on 03/10/2025)
work page 2017
-
[2]
Going beyond Crosscoun- try Averages: Growth, Inequality and Poverty Reduction in the Philip- pines
Arsenio M. Balisacan and Nobuhiko Fuwa. “Going beyond Crosscoun- try Averages: Growth, Inequality and Poverty Reduction in the Philip- pines”. In: World Development 32.11 (Nov. 1, 2004), pp. 1891–1907. issn: 0305-750X. doi: 10 . 1016 / j . worlddev . 2004 . 05 . 010. url: https://www.sciencedirect.com/science/article/pii/S0305750X04001408 (visited on 03/10/2025)
work page 2004
-
[3]
35 (Bangsamoro Electoral Code of 2022)
Bangsamoro Autonomy Act No. 35 (Bangsamoro Electoral Code of 2022). Official text, Bangsamoro Parliament. 2022
work page 2022
-
[4]
Edsel Beja Jr et al. Inequality in democracy: Insights from an empirical analysis of political dynasties in the 15th Philippine Congress . July 15,
-
[5]
Allan Bickle. Fundamentals of graph theory. en. Pure and Applied Un- dergraduate Texts. Providence, RI: American Mathematical Society, May 2020
work page 2020
-
[6]
Tristan Canare, Ronald Mendoza, and Mario Antonio Lopez. “An Em- pirical Analysis of Vote Buying Among the Poor: Evidence from Elec- 112 tions in the Philippines (forthcoming in Southeast Asia Research)”. In: (Feb. 2018)
work page 2018
-
[7]
Ateneo Policy Center Political Dynasties Dataset
Ateneo Policy Center. Ateneo Policy Center Political Dynasties Dataset
-
[8]
Politician Family Networks and Electoral Outcomes: Evidence from the Philippines
Cesi Cruz, Julien Labonne, and Pablo Querub ´ ın. “Politician Family Networks and Electoral Outcomes: Evidence from the Philippines”. In: American Economic Review 107.10 (Oct. 2017), pp. 3006–37. doi: 10.1257/aer.20150343 . url: https://www.aeaweb.org/articles? id=10.1257/aer.20150343
Show all 43 references
-
[9]
Corrup- tion risk and political dynasties: exploring the links using public pro- curement data in the Philippines
Daniel Bruno Davis, Ronald U. Mendoza, and Jurel K. Yap. “Corrup- tion risk and political dynasties: exploring the links using public pro- curement data in the Philippines”. In: Economics of Governance 25.1 (Mar. 1, 2024), pp. 81–109. issn: 1435-8131. doi: 10.1007/s10101- 023-...
2024 doi
-
[10]
Network Analysis for Economics and Finance: An Application to Firm Ownership
Janina Engel, Michela Nardo, and Michela Rancan. “Network Analysis for Economics and Finance: An Application to Firm Ownership”. In: Data Science for Economics and Finance: Methodologies and Applica- tions. Ed. by Sergio Consoli, Diego Reforgiato Recupero, and Michaela Saisana...
2021 doi
-
[11]
Police nab suspect in ambush-slay of Mt
Cecille Suerte Felipe Bebot Sison Jr. Police nab suspect in ambush-slay of Mt. Province mayor . Feb. 2011. url: https://www.philstar.com/ nation/2011/02/18/658032/police-nab-suspect-ambush-slay- mt-province-mayor
2011
-
[12]
Understanding layered dominance of political dynasties in India: A de-hyphenated reading of dynastic representation and dynasty-led parties
Ambar Kumar Ghosh. “Understanding layered dominance of political dynasties in India: A de-hyphenated reading of dynastic representation and dynasty-led parties”. In: Asian Journal of Comparative Politics 8.3 (Sept. 1, 2023). Publisher: SAGE Publications, pp. 727–747. issn: 205...
2023 doi
-
[13]
Swati Goswami, C. A. Murthy, and Asit K. Das. Sparsity Measure of a Network Graph: Gini Index . 2016. arXiv: 1612.07074 [cs.DM]. url: https://arxiv.org/abs/1612.07074
2016 arXiv
-
[14]
The Lanao Sultanate in the 17th Century Zak¯ at System With Special Reference to the Islamic Perspectives of Al-M¯ award ¯ ı
Sohayle Hadji et al. “The Lanao Sultanate in the 17th Century Zak¯ at System With Special Reference to the Islamic Perspectives of Al-M¯ award ¯ ı”. In: (Oct. 2020), p. 2018
2020
-
[15]
National power and the structure of foreign trade
Albert O Hirschman. National power and the structure of foreign trade. The Politics of the international economy. Berkeley, CA: University of California Press, Feb. 1981
1981
-
[16]
Political dynas- ties, term limits and female political representation: Evidence from the Philippines
Julien Labonne, Sahar Parsa, and Pablo Querubin. “Political dynas- ties, term limits and female political representation: Evidence from the Philippines”. In: Journal of Economic Behavior & Organization 182 (Feb. 1, 2021), pp. 212–228. issn: 0167-2681. doi: 10.1016/j.jebo. 114 ...
2021 doi
-
[17]
AN ACT PROHIBITING THE ESTABLISHMENT OF POLITICAL DYNASTIES
Panfilo Lacson. AN ACT PROHIBITING THE ESTABLISHMENT OF POLITICAL DYNASTIES . July 2019. url: https : / / legacy . senate.gov.ph/lisdata/3024627075!.pdf
2019
-
[18]
As- sessing the Relationship of Human Development Index (HDI) and Gov- ernment Expenditure on Health and Education in Selected ASEAN Countries
Danielle Ann Lantion, Gabrielle Mus˜ ngi, and Ronaldo Cabauatan. “As- sessing the Relationship of Human Development Index (HDI) and Gov- ernment Expenditure on Health and Education in Selected ASEAN Countries”. In: International Journal of Social and Management Stud- ies 4.6 (...
2023 doi
-
[19]
Ampatuans, Ecleos, Sinsuats, Midtimbangs unrivalled in turfs
Vino Lucero. Ampatuans, Ecleos, Sinsuats, Midtimbangs unrivalled in turfs. en-US. May 2016. url: http : / / pcij . org / 2016 / 05 / 04 / ampatuans-ecleos-sinsuatsbrmidtimbangs-unrivalled-in-turfs/
2016
-
[20]
Political dynasties and poverty: measurement and evidence of linkages in the Philippines
Ronald Mendoza et al. “Political dynasties and poverty: measurement and evidence of linkages in the Philippines”. In: Ateneo School of Gov- ernment Publications (Apr. 1, 2016). url: https://archium.ateneo. edu/asog-pubs/63
2016
-
[21]
Mendoza, Miann Banaag, and Michael Henry Yusingco
Ronald U. Mendoza, Miann Banaag, and Michael Henry Yusingco. Term Limits and Political Dynasties: Unpacking the Links . Rochester, NY, Mar. 20, 2019. doi: 10 . 2139 / ssrn . 3356437. url: https : / / papers.ssrn.com/abstract=3356437 (visited on 04/10/2025)
2019
-
[22]
Mendoza, Jan Fredrick Cruz, and David Barua Yap II
Ronald U. Mendoza, Jan Fredrick Cruz, and David Barua Yap II. Polit- ical Party Switching: It’s More Fun in the Philippines . Rochester, NY, 115 Sept. 23, 2014. doi: 10.2139/ssrn.2492913 . url: https://papers. ssrn.com/abstract=2492913 (visited on 04/11/2025)
2014 doi
-
[23]
Mendoza, Joshua Hiwatig, and Miann Banaag
Ronald U. Mendoza, Joshua Hiwatig, and Miann Banaag. Dynastic Political Networks: Insights from the Case of Western Samar, Philip- pines. Rochester, NY, July 16, 2020. doi: 10 . 2139 / ssrn . 3652960. url: https : / / papers . ssrn . com / abstract = 3652960(visited on 11/17/2024)
2020
-
[24]
Mendoza, Leonardo M
Ronald U. Mendoza, Leonardo M. Jaminola, and Jurel Yap. From Fat to Obese: Political Dynasties after the 2019 Midterm Elections . Rochester, NY, Sept. 1, 2019. doi: 10 . 2139 / ssrn . 3449201. url: https://papers.ssrn.com/abstract=3449201 (visited on 03/11/2025)
2019
-
[25]
Political Dynasties and Poverty: Resolv- ing the ’Chicken or the Egg’ Question
Ronald U. Mendoza et al. “Political Dynasties and Poverty: Resolv- ing the ’Chicken or the Egg’ Question”. In: SSRN Electronic Journal (2013). issn: 1556-5068. doi: 10 . 2139 / ssrn . 2292277. url: http : //www.ssrn.com/abstract=2292277 (visited on 11/17/2024)
2013
-
[26]
Political Dynasties and Terrorism: An Em- pirical Analysis Using Data on the Philippines
Ronald U. Mendoza et al. “Political Dynasties and Terrorism: An Em- pirical Analysis Using Data on the Philippines”. In: Asian Journal of Peacebuilding 10.2 (Nov. 30, 2022), pp. 435–459. issn: 22882693, 22882707. doi: 10 . 18588 / 202210 . 00a266. url: https : / / kiss . kstud...
2022
-
[27]
Political dynasties, business, and poverty in the Philippines
Ronald U. Mendoza et al. “Political dynasties, business, and poverty in the Philippines”. In: Journal of Government and Economics 7 (Sept. 1, 2022), p. 100051. issn: 2667-3193. doi: 10.1016/j.jge.2022.100051. 116 url: https : / / www . sciencedirect . com / science / article /...
2022
-
[28]
8 in every 10 district reps be- long to dynasties
Guinevere Latoza Miranda Maujerie. 8 in every 10 district reps be- long to dynasties. More than half are reelectionists in 2025 . PCIJ.org. Oct. 26, 2024. url: http://pcij.org/2024/10/26/lower- house- district - representatives - political - dynasties - reelection/ (visited on...
2025
-
[29]
Philippine Human Development Re- port
Human Development Network PH. Philippine Human Development Re- port. 2022
2022
-
[30]
Political Parties, Family Dynasties, and the Budget Surplus Trap: Addressing the Public Goods Deficit in the Philippines
Hannah Pimentel. Political Parties, Family Dynasties, and the Budget Surplus Trap: Addressing the Public Goods Deficit in the Philippines . Nov. 21, 2024. url: https : / / blogs . lse . ac . uk / seac / 2024 / 11 / 21 / political - parties - family - dynasties - and - the - bu...
2024
-
[31]
Political Reform and Elite Persistence: Term Lim- its and Political Dynasties in the Philippines
Pablo Querubin. Political Reform and Elite Persistence: Term Lim- its and Political Dynasties in the Philippines . Rochester, NY, 2012. url: https : / / papers . ssrn . com / abstract = 2108036(visited on 11/18/2024)
2012
-
[32]
10755: An Act Strengthening the Sangguniang Ka- bataan (SK) Reform Act of 2015
Republic Act No. 10755: An Act Strengthening the Sangguniang Ka- bataan (SK) Reform Act of 2015 . Official Gazette of the Republic of the Philippines. 2015
2015
-
[33]
Can Social Protection Weaken Clientelism? Con- sidering Conditional Cash Transfers as Political Reform in the Philip- 117 pines
Arun R. Swamy. “Can Social Protection Weaken Clientelism? Con- sidering Conditional Cash Transfers as Political Reform in the Philip- 117 pines”. In: Journal of Current Southeast Asian Affairs 35.1 (2016), pp. 59–90. doi: 10.1177/186810341603500103. eprint: https://doi. org / ...
2016 doi
-
[34]
Political dynasties in the Philip- pines: Persistent patterns, perennial problems
Teresa Tadem and Eduardo Tadem. “Political dynasties in the Philip- pines: Persistent patterns, perennial problems”. In: South East Asia Research 24 (July 2016). doi: 10.1177/0967828X16659730
2016 doi
-
[35]
Mapping the Philip- pines’ Defective Democracy
Julio C. Teehankee and Cleo Anne A. Calimbahin. “Mapping the Philip- pines’ Defective Democracy”. In: Asian Affairs: An American Review 47.2 (2020), pp. 97–125. doi: 10.1080/00927678.2019.1702801
2020
-
[36]
Official text
The 1987 Constitution of the Republic of the Philippines . Official text. 1987
1987
-
[37]
From Louvain to Leiden: guaranteeing well-connected communities
V. A. Traag, L. Waltman, and N. J. van Eck. “From Louvain to Leiden: guaranteeing well-connected communities”. In: Scientific Reports 9.1 (Mar. 2019). issn: 2045-2322. doi: 10.1038/s41598- 019- 41695- z. url: http://dx.doi.org/10.1038/s41598-019-41695-z
2019 doi
-
[38]
Variability and Mutability
“Variability and Mutability”. In: Journal of the Royal Statistical Soci- ety 76.6 (Dec. 2018), pp. 619–622. issn: 0952-8385. doi: 10.1111/j. 2397- 2335.1913.tb03065.x. eprint: https://academic.oup.com/ jrsssa/article- pdf/76/6/619/49683089/jrsssa\_76\_6\_619. pdf. url: https:/...
2018
-
[39]
Political Dynasties and Human Devel- opment Investments: Evidence of Linkage from Rizal Province, Philip- 118 pines
John Emmanuel B. Villanueva. “Political Dynasties and Human Devel- opment Investments: Evidence of Linkage from Rizal Province, Philip- 118 pines”. In: Philippine Journal of Public Administration 64.2 (Mar. 14, 2022). Number: 2, pp. 90–126.issn: 3028-1296. url: https://journal...
2022
-
[40]
Politics of Poverty Governance: an Introduction
Zhongyuan Wang and Sujian Guo. “Politics of Poverty Governance: an Introduction”. In: Journal of Chinese Political Science 27 (June 2022). doi: 10.1007/s11366-022-09804-4
2022 doi
-
[41]
Network analysis literacy
Katharina A Zweig. Network analysis literacy. en. 1st ed. Lecture Notes in Social Networks. Vienna, Austria: Springer, Aug. 2014. 119 Appendices 120 Appendix A Appendix A.0.1 Linear Regression Trend Analysis Figure A.1: Trend Analysis of Political Herfindahl-Hirschman Index Fi...
2014
-
[2012]
url: https://mpra.ub.uni-muenchen.de/40104/ (visited on 03/06/2025)
2025
-
[2016]
inclusivedemocracy
url: https : / / www . inclusivedemocracy . ph / data - and - infographics
Reviewed August 7, 2026 · model on record in the stance chip above.
Discussion (0). Sign in to comment.