REVIEW 5 major objections 6 minor 13 references
Classifying the derivatives of light curves for overcontact eclipsing binaries
T0 review · 5 major / 6 minor · reviewed 2026-08-07 · deepseek-v4-flash
Pith's one-line read Five shapes in a light curve's derivatives reveal a contact binary's mass ratio, inclination, and eclipse depth.
desk verdict A plausible first-pass derivative taxonomy for overcontact binaries, but the method is visual rather than algorithmic and the real-data check is not independent; worth a referee, with specific requests for quantification and validation. read the letter →
The pith
A machine-rendered reading of the paper's core claim, the machinery that carries it, and where it could break.
The reading
What carries the argument
The central object is the sequence of the first, second, third, and fourth time derivatives of the phased light curve, each normalized to unity. Derivatives are computed by repeated application of the second-order central difference to phase-binned mean fluxes (100 phase bins per point). The classification keys on the shape of the second derivative at eclipse—double peak (DP) versus single peak (SP)—and then on fourth-derivative peak presence (SPp), small symmetric bumps (SPb), flatness outside eclipse (SPf), or smoothness (SPs). Eclipse obscuration is defined as the maximum fraction of the smaller star's surface covered by the larger star during eclipse.
What would settle it
Take a sample of overcontact binaries with spectroscopically measured mass ratios and independently fitted inclinations, compute their first-to-fourth derivatives, and check whether DP-type curves coincide with q<0.6 and i>70° (with total-annular eclipses) in more than 90% of cases and whether SPs-type curves are confined to sigma below about 0.2 with i<70°; a clear violation of these associations would refute the claim that derivative morphology carries the parameter information.
Extended reading notes
Core claim
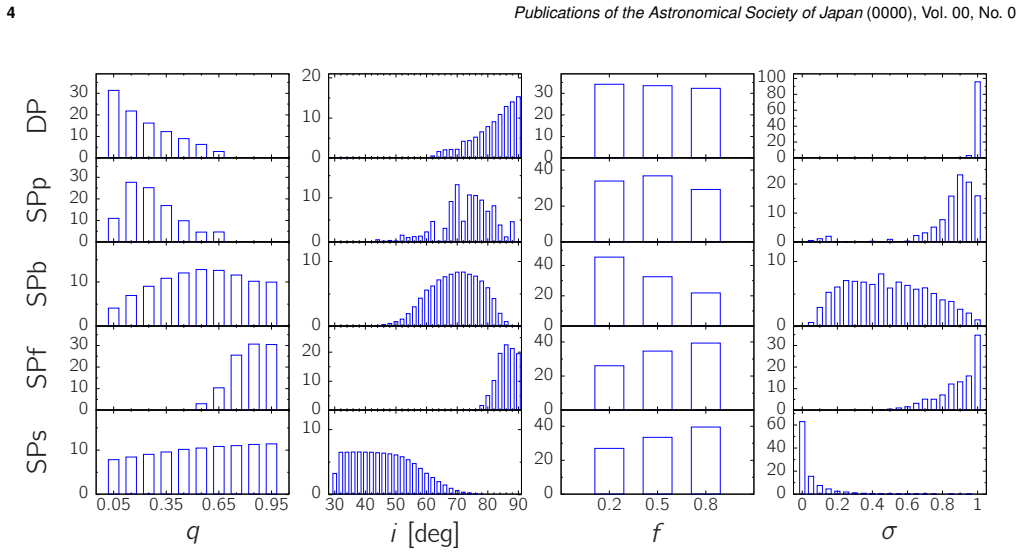
The paper claims that the first-through-fourth derivatives of overcontact binary light curves can be sorted into five morphological types—DP, SPp, SPb, SPf, and SPs—and that each type carries statistical information about four fundamental parameters: mass ratio, orbital inclination, fill-out factor, and eclipse obscuration. DP-type curves, marked by a double peak in the second derivative around eclipse, correspond overwhelmingly to low-mass-ratio (q<0.6), high-inclination (i>70°) systems with total-annular eclipses. SPp curves show a peak in the fourth derivative and occur at low mass ratios with high eclipse obscuration but insufficient inclination for totality. SPb curves are the intermediate partial-eclipse systems, SPf curves mark high-mass-ratio, high-inclination binaries with large obscuration and flat derivative shapes outside eclipse, and SPs curves have smooth second derivatives and signal grazing eclipses with sigma less than about 0.2 and i<70°. The author applies the scheme to 127 real TESS and Kepler light curves with spectroscopic mass ratios, classifies 102 of them, and reports that the parameter trends are consistent with the synthetic results.
Load-bearing premise
The classification must transfer from noiseless synthetic light curves to real, noisy, finite-cadence observations; the paper itself found that 25 of 127 real light curves were too noisy to classify and that spurious fourth-derivative peaks can make one type look like another.
Editorial extensions
If this is right
- DP-type morphology can be used as a fast indicator of total-annular eclipses in overcontact binaries, since over 90% of DP systems have q<0.6 and i>70°.
- SPs-type morphology signals grazing eclipses (sigma below about 0.2 for roughly 95% of systems) and low inclination (i<70°), useful for selecting systems for follow-up.
- SPf-type morphology identifies high-mass-ratio (q>0.6), high-inclination (i>80°) systems with large eclipse obscuration, including total-annular eclipses.
- The classification can seed initial parameters for light-curve modeling, narrowing the search space before detailed fits, and can provide a fast statistical overview of the large numbers of overcontact binaries found by current surveys.
Reading between the lines
- One extension beyond the paper would be to automate the classification with a machine-learning model trained on the synthetic derivative morphologies, making the scheme directly applicable to the millions of light curves produced by ongoing survey missions.
- The paper's own finding that noisy fourth derivatives can create spurious SPp peaks implies that classification reliability depends on photometric precision and cadence; a quantitative noise threshold for each type could be derived by adding realistic noise to the synthetic grid.
- The same derivative-morphology logic could be tested on detached and semi-detached eclipsing binaries, whose eclipse geometry differs but whose derivative signatures should still encode eclipse depth and geometry.
- The type–parameter associations, if confirmed on a larger real-data sample, would provide a distance-independent and reddening-independent diagnostic of contact-binary geometry.
- Because the classification was defined by visual inspection, intermediate systems may bridge the five types; an automated clustering of the derivative feature space could reveal whether the types are discrete or endpoints of a continuum.
Editorial analysis
A structured set of objections, weighed in public.
Referee Report
Summary. The manuscript proposes a morphological classification of the light curves (LCs) of overcontact eclipsing binaries based on the shapes of their first through fourth derivatives. Using 89,670 PHOEBE 2.4 synthetic LCs spanning mass ratio q = 0.05–0.95, inclination i = 30°–90°, fill-out factor f = 0.2–0.8, and temperatures 4000–10000 K, the author defines five types — DP (double peak in the second derivative), SPp, SPb, SPf, and SPs (single-peak subtypes) — by visual inspection of the derivative curves (Section 3). For each type, the paper presents the statistical distributions of q, i, f, and eclipse obscuration σ (Section 4, Fig. 3) and claims that each type has distinguishing parameter properties: DP systems tend to have low q and high i and show total-annular eclipses, SPp systems have low q with high σ, SPb systems have intermediate properties, SPf systems have high q and high i, and SPs systems have low i and grazing eclipses. The method is applied to 102 real W UMa binaries from the Latković et al. (2021) catalog using TESS/Kepler LCs, after 25 of 127 LCs were rejected as too noisy (Section 4.3); the author reports that the real-data distribution is consistent with the synthetic trends (Fig. 4). The paper concludes that the classification provides a quick-look estimate of fundamental parameters and a foundation for further detailed analysis.
Significance. If the five-type classification were quantitatively specified and shown to be robust to realistic noise, it would be a genuinely useful quick-look tool for the large numbers of eclipsing binaries now emerging from surveys, and it would extend the derivative-based diagnostics of IJspeert et al. and the mass-ratio estimator of Kouzuma (2023). The paper has real strengths: the synthetic grid is large and systematic; the five types are clearly illustrated in Fig. 1 and summarized in a flowchart (Fig. 5); the manuscript is commendably explicit about its difficulties, reporting that 25 of 127 real LCs were rejected as too noisy and that spurious fourth-derivative peaks can shift SPb/SPs systems into SPp (Section 4.2.1); and the application to 102 real systems with external spectroscopic mass ratios is a genuine attempt at external grounding. On my reading, the skeptical concerns raised in pre-review largely land: the classification is defined by visual inspection without quantitative decision rules, the parameter trends are descriptive statistics of the same uniform synthetic grid used to define the types, and the real-data validation is not blinded and is qualitative.
major comments (5)
- [Section 3 / Section 4.2.1] The classification criteria are not quantitatively specified, and the manuscript itself documents cases in which the stated criteria are overridden by visual judgment. Section 3 states that the LCs were grouped by 'similarities observed' through 'visual inspection', and Section 4.2.1 reports that 'Almost all of the LCs with σ∼0.1–0.2 are misclassified as SPp due to the detection of spurious SPp-5 peaks. However, a visual inspection reveals that they actually belong to the SPb or SPs categories.' As written, the five types are not reproducible from the text alone, and the histograms in Fig. 3 cannot be independently verified. The paper already contains the seeds of a quantitative scheme — the SPf-1 flatness criterion ('less than 10% of the maximum variation') and the detection of SPb-1 bumps by zero values in the third derivative — so I request explicit numeric criteria (e.g., prominence and amplitude thresholds for DP-1, SPp-5, and SPb-1), and a statement of how the 89,670 synthetic LCs were assigned to types (manual inspection of every LC is implausible; if a rule-based algorithm was applied after manual definition, describe it and release either the code or the per-LC type labels).
- [Section 4.3] The real-data validation is not independent of the hypothesis being tested. The same author who defined the five types from the synthetic grid classified the 102 real binaries, and Table 1 presents each binary's type in the same table as its Latković-catalog mass ratio, inclination, and fill-out factor, so the classification was made with the catalog values visible. The statement in Section 4.3 that the real distributions 'are consistent with the physical properties described in sections 4.1 and 4.2' is therefore vulnerable to confirmation bias. I request a blinded validation: assign types from the derivative plots alone (without the catalog values), or apply the quantitative decision rules from the previous comment to the real data automatically, and then compare with the catalog parameters. I also ask for a report on the 25 excluded systems; selecting the 'better-quality' light curve by smoothness and rejecting noisy systems can bias the resulting type mix, and the paper should quantify how the exclusion affects the conclusions.
- [Section 4.2.1 / Section 4.3] The practical claim — that derivative morphology enables quick-look classification of survey data — requires that the five types survive realistic noise and finite sampling, but the manuscript provides only qualitative warnings. Section 4.2.1 states that spurious SPp-5 peaks make SPb/SPs systems look like SPp, and Section 4.3 rejects 25 of 127 (20%) of the real LCs as too noisy. I request a noise-injection experiment on the synthetic grid: add photometric noise at representative levels, resample to TESS/Kepler cadence, rebin and differentiate using the same procedure as in Section 4.3, and report the confusion matrix of the five types as a function of signal-to-noise. Such an experiment would either support the transferability of the taxonomy or delimit the conditions under which it applies. In addition, the derivative-estimation choice for the synthetic grid (100 phase bins combined, then repeated second-order central differences) should be justified and its effect on type assignment tested.
- [Section 4 / Figure 3] The parameter 'trends' in Fig. 3 are descriptive statistics of the uniform synthetic grid and are presented without error bars, bin counts, or statistical tests. Because q, i, f, and the temperatures are inputs to PHOEBE and the grid is uniform in these parameters, the conditional histograms are properties of the classifier applied to that grid; statements such as 'over 90% of the DP systems have q < 0.6 and i > 70°' and 'nearly 95% exceeding 0.7' need the underlying counts and confidence intervals (or a KS test comparing each type's distribution with the grid prior) to support the claimed trends. Note also that f takes only three values (0.2, 0.5, 0.8), so the assertions that SPb frequency decreases, and SPf/SPs frequency increases, with fill-out factor each rest on three grid points; the coarseness of the f sampling should be acknowledged and, if feasible, supplemented with a finer f grid.
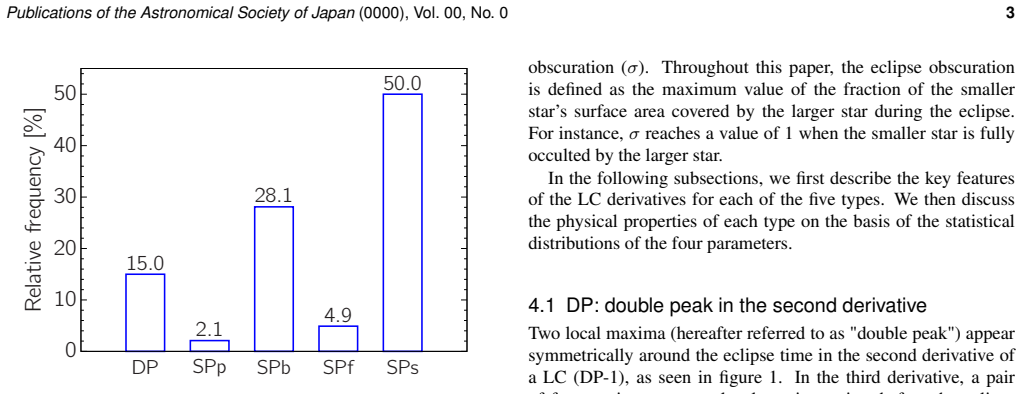
- [Section 4.3 / Figure 2] The type fractions in the real sample (57 DP, 4 SPp, 35 SPb, 2 SPf, 4 SPs out of 102) differ dramatically from the synthetic fractions in Fig. 2 (15% DP, 2% SPp, 28% SPb, 5% SPf, 50% SPs), and the manuscript does not discuss this discrepancy. Because the synthetic grid is uniform in the input parameters, Fig. 2 should not be read as a physical occurrence-rate prediction; the real-sample mix is plausibly shaped by selection effects (spectroscopic surveys and detectable eclipse amplitudes favor high-inclination, high-obscuration systems). I ask the authors to state explicitly that Fig. 2 is a property of the grid, and to discuss selection effects in the real sample; without this, the real-data check appears to contradict the synthetic fractions and the credibility of the validation is weakened.
minor comments (6)
- [Figure 1 caption] The caption contains a typo ('derivaives' for 'derivatives'), and the circled feature markers are rendered as '1©', '2©', etc. in several places; the encoding of the markers should be fixed so the features referenced in the text are legible.
- [Figure 4 caption] The caption reads 'catter plot'; it should read 'Scatter plot'.
- [Section 2] The temperature specification 'Tp (Ts) = 4000–10000 (1000) K' is ambiguous; since the total count of 89,670 implies 49 primary/secondary temperature pairs, the text should state explicitly that Tp and Ts each take seven values independently.
- [Section 4.3] Please specify the phase binning, smoothing, and derivative stencil used for the TESS/Kepler light curves; the synthetic derivatives were computed from 100 phase bins combined with second-order central differences, and the real-data comparison is not reproducible without the corresponding details.
- [Section 4.2.4] The text reports '12,544 (28%)' of SPs systems with σ < 10^-3; 28% of the 44,835 SPs systems is approximately 12,554, so the count and percentage should be rounded consistently.
- [Section 4.1 / Introduction] The relation to Kouzuma (2023) should be clarified: the paper notes that the earlier work used double peaks to estimate mass ratios, but it does not say whether the DP type defined here coincides with the sample used there, or whether the new taxonomy is intended to generalize that method; one sentence would remove the ambiguity.
Circularity Check
No circular reduction found; the taxonomy rests on derivative morphology, the parameter trends are descriptive summaries of the forward model, and the real-data check uses external spectroscopic parameters.
full rationale
The paper's central claim is a classification of derivative shapes. The five types (DP, SPp, SPb, SPf, SPs) are defined visually by features of the first-to-fourth derivatives (Sec. 4), not by values of q, i, f, or sigma. The histograms in Fig. 3 are conditional distributions of the input grid parameters within each morphological class; they summarize the forward model rather than predict parameters from the same data, so this is not a fit-renamed-as-prediction. The real-data application (Sec. 4.3) uses independent spectroscopic mass ratios and inclinations from Latkovic et al. (2021) and TESS/Kepler light curves, providing external grounding. The paper itself flags the fragility of the taxonomy under noise (25/127 rejected; spurious SPp peaks from sigma~0.1-0.2), which is a correctness/robustness limitation, not a circular definition. The only self-citation is the note in Sec. 4.1 pointing to Kouzuma (2023) for mass-ratio estimation from double peaks; that prior result is not used to define the DP type or to derive the parameter trends, so it is not load-bearing. No equation or definition makes a classified type equivalent to a fitted parameter, and no prediction is forced by construction. Score 2 reflects the presence of one minor, non-load-bearing self-citation, not a circular derivation.
Assumptions & free parameters
free parameters (1)
- flatness threshold for SPf type =
10% of maximum variation in corresponding derivative
assumptions (4)
- domain assumption PHOEBE 2.4 synthetic light curves are an accurate representation of real overcontact binary light curves, including Roche geometry, limb darkening, gravity darkening, and reflection.
- domain assumption Gravity-darkening coefficients are 0.32 for stars cooler than 6600 K and 1.0 for hotter stars.
- ad hoc to paper Visual grouping of derivative curves by the author is a meaningful, reproducible classification.
- standard math Numerical derivatives computed by repeated second-order central differencing on 100-phase-bin means are stable enough for classification.
Cite this review
Pith. "Pith review of Classifying the derivatives of light curves for overcontact eclipsing binaries." pith.science (2026). https://pith.science/paper/DYDOZGJC
@misc{pith2026250521368,
  author       = {Pith},
  title        = {Pith review of: Classifying the derivatives of light curves for overcontact eclipsing binaries},
  year         = {2026},
  howpublished = {\url{https://pith.science/paper/DYDOZGJC}},
  note         = {Machine review of arXiv:2505.21368}
}
read the original abstract
Recent studies indicate that the physical properties of eclipsing binaries can be extracted from the derivatives of their light curves. A classification scheme for the derivatives of light curves would be helpful for identifying key characteristics of eclipsing binaries. In this study, we propose a new classification method for the light curves of overcontact eclipsing binaries by using their derivatives. We synthesized 89,670 sample light curves of overcontact binaries and categorized them into five types on the basis of their first to fourth derivatives. For each type, we examined the statistical distributions of four parameters: the mass ratio, orbital inclination, fill-out factor, and eclipse obscuration. Their distributions demonstrated that parameter values exhibit certain trends depending on the classified types. With the proposed classification method, general properties of overcontact binaries can be understood, providing a foundation for further detailed analysis.
Figures

Figures from the paper (2 more)


Reference graph
Works this paper leans on
-
[1]
1970, Vistas in Astronomy, 12, 217
Binnendijk, L. 1970, Vistas in Astronomy, 12, 217
1970
-
[2]
E., Kochoska, A., Hey, D., et al
Conroy, K. E., Kochoska, A., Hey, D., et al. 2020, ApJS, 250, 34
2020
-
[3]
Gazeas, K. D. & Niarchos, P. G. 2006, MNRAS, 370, L29
work page 2006
-
[4]
W., Tkachenko, A., Johnston, C., et al
IJspeert, L. W., Tkachenko, A., Johnston, C., et al. 2021, A&A, 652, A120
work page 2021
-
[5]
W., Tkachenko, A., Johnston, C., et al
IJspeert, L. W., Tkachenko, A., Johnston, C., et al. 2024, A&A, 685, A62
work page 2024
-
[6]
Kallrath, J. & Milone, E. F. 2009, Eclipsing Binary Stars: Modeling and Analysis 6Publications of the Astronomical Society of Japan(0000), Vol. 00, No. 0 Fig. 5.Flowchart of classifying the derivatives of a LC. Diamonds denote decision points to classify according to the proposed five types. Dialogue balloons summarize the general properties of the five t...
work page 2009
-
[7]
1955, Annales d’Astrophysique, 18, 379
Kopal, Z. 1955, Annales d’Astrophysique, 18, 379
1955
-
[8]
2023, ApJ, 958, 84 Latkovi´c, O., ˇCeki, A., & Lazarevi´c, S
Kouzuma, S. 2023, ApJ, 958, 84 Latkovi´c, O., ˇCeki, A., & Lazarevi´c, S. 2021, ApJS, 254, 10 Lightkurve Collaboration, Cardoso, J. V . d. M., Hedges, C., et al. 2018, Lightkurve: Kepler and TESS time series analysis in Python, Astrophysics Source Code Library Prša, A., Conroy, K. E., Horvat, M., et al. 2016, ApJS, 227, 29
work page 2023
Show all 13 references
-
[9]
Rucinski, S. M. 1974, AcA, 24, 119
1974
-
[10]
N., Durlevich, O
Samus, N. N., Durlevich, O. V ., & et al. 2004, VizieR Online Data Catalog, 2250, 0
2004
-
[11]
Smith, R. C. 1984, QJRAS, 25, 405
1984
-
[12]
Webbink, R. F. 2003, in Astronomical Society of the Pacific Conference
2003
-
[13]
1975, Ap&SS, 34, 413 Publications of the Astronomical Society of Japan(0000), Vol
Yamasaki, A. 1975, Ap&SS, 34, 413 Publications of the Astronomical Society of Japan(0000), Vol. 00, No. 07 Table 1.Classified types and three fundamental parameters of binaries with entries of spectroscopic mass ratios in Latkovi ´c et al. (2021). The parameter values were ext...
2021
Reviewed August 7, 2026 · model on record in the stance chip above.
Discussion (0). Sign in to comment.