REVIEW 4 major objections 5 minor 1 cited by
Classifying and Clustering Trading Agents
T0 review · 4 major / 5 minor · reviewed 2026-08-07 · deepseek-v4-flash
Pith's one-line read Supervised classification easily separates fifteen simulated trading types, while hierarchical clustering merges distinct types and misleads — so cluster labels from order flow should not be read as behavioral types without external…
desk verdict A useful synthetic ground-truth warning that clustering can mislead, but the headline accuracy gap is inflated by outcome-leaking features and the quantitative results are internally inconsistent. read the letter →
The pith
A machine-rendered reading of the paper's core claim, the machinery that carries it, and where it could break.
The reading
What carries the argument
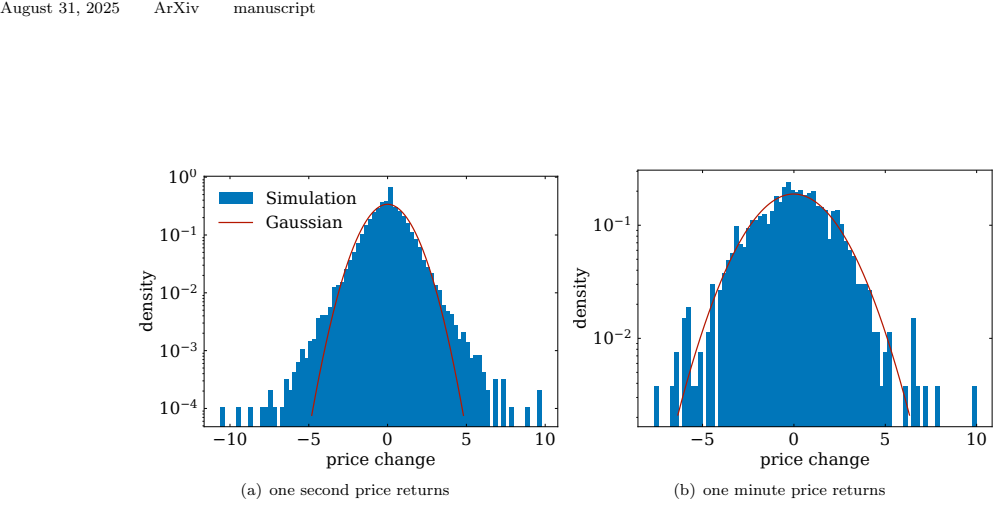
The study's load-bearing object is a synthetic continuous double-auction market (price-time priority limit order book) populated by 1,590 agents in fifteen ground-truth classes, simulated for twenty hours at one-tenth-second resolution, with parameters tuned so the simulated price returns reproduce fat tails and volatility clustering. On this data the authors compute eighteen per-agent features — nine drawn from the literature (buy ratio, cancellation ratio, market-order ratio, order timing and size moments, trade counts, volume) and nine handcrafted trend, directed-trend, and fundamental-profit features. Supervised modeling uses a linear SVM with one-vs-one weights and a deep network interpreted with layer-wise relevance propagation; unsupervised modeling uses hierarchical clustering with Ward linkage, with the number of clusters chosen by silhouette and WCSS criteria. The gap between the two is the paper's result.
What would settle it
Fit the same eighteen features to real investor-level order flow with known behavioral identities (for example, broker-designated market makers versus high-frequency traders), run the same hierarchical clustering, and check whether clusters match the known identities; if the clusters align with the labels, the claim that unsupervised clustering misleads would be weakened.
Extended reading notes
Core claim
Using ground truth from a realistic agent-based limit order book simulation, the paper shows that the same feature set that lets supervised classifiers reach 99% accuracy yields hierarchical clusters that contradict the underlying behavioral taxonomy: with nine clusters, noise traders and market takers land in one cluster, all four fundamentalist subclasses collapse into a single low-precision cluster, and overall clustering accuracy drops from about 94% to 63% when agents' actions are merged with noise trader activity. Increasing the number of clusters does not fix the problem, since finer partitioning fragments classes instead of recovering them. The authors' conclusion is that unsupervised clustering can give incorrect or even misleading results in this setting even when the classes are well separated, and that the separation itself depends on features that encode knowledge of the very behaviors being discovered.
Load-bearing premise
The transfer of the results to real markets rests on the assumption that the hand-parameterized agent-based model produces order-flow statistics similar enough to real investor behavior, but the paper validates only fat tails and volatility clustering and reports an undesirable negative autocorrelation in returns, and its extra features are partly based on internal knowledge of the simulated agents.
Editorial extensions
If this is right
- Cluster labels from unsupervised order-flow analysis should not be interpreted as investor behavioral types unless validated against external information.
- Feature choice matters more than noise: the trend-based features separate chartists, while fundamentalists remain the hardest class because their behavior depends on information outside the order flow.
- The supervised accuracies serve as an upper bound; any real-world profiling method that cannot use labels should be expected to perform closer to the clustering results.
- Noise degrades unsupervised clustering more than supervised classification, so noisier data widens the gap.
- Merging clusters can inflate apparent accuracy; reporting overall accuracy on clusters hides the fact that distinct classes are pooled.
Reading between the lines
- Because nine extra features are partly based on the authors' internal knowledge of the simulated agents, the measured classification advantage may be larger than what a fully agnostic feature set would achieve on real data.
- The authors' own admission of an undesirable negative autocorrelation in simulated returns means the simulator is not fully realistic; a better calibration could change the size of the gap, though the qualitative direction is plausible.
- A natural testable extension is to run the same feature-and-clustering pipeline on real investor-level order flow with known labels (for example, officially designated market makers) to see whether clusters recover the known categories.
- The results suggest semi-supervised approaches, where a few known labels anchor the clusters, could be a productive middle ground for investor profiling.
Editorial analysis
A structured set of objections, weighed in public.
Referee Report
Summary. The paper uses a synthetic limit order book (LOB) populated by fifteen classes of trading agents to ask whether supervised classification and unsupervised clustering can recover known agent types from investor-level features. The authors generate forty simulations, compute nine literature-based features plus nine additional features (including trend- and profit-based ones), and train SVM and DNN classifiers as well as a hierarchical clustering model under three noise settings (no additional noise, 50% noise, 66.6% noise). They report that supervised classification reaches high accuracy (up to 0.99 with 18 features) while clustering is less accurate (e.g., 0.94 with 18 features and no noise), and conclude that unsupervised clustering of investor order flow may give incorrect or even misleading results even when supervised classification is easy. The paper also analyzes feature importance via SVM weights and layer-wise relevance propagation.
Significance. The question addressed here is important for the growing literature that uses unsupervised clustering to infer behavioral types from investor order flow, and the synthetic testbed with ground-truth labels is a sensible design. A notable strength is that the simulation and clustering code is publicly available, which supports reproducibility. If the quantitative comparison were fully substantiated, the finding that clustering can fail even when classes are linearly separable would be a useful caution for empirical finance. However, the strength of the central claim is currently undermined by the forward-looking construction of several extra features and by internal inconsistencies in the reported test-set sizes, so the exact magnitudes of the reported classification-clustering gaps should not be taken at face value until these issues are resolved.
major comments (4)
- [Section 2.2] The 'Fundamental profit', 'Long fundamental profit', and 'Weighted fundamental profit' features use the mid-price 8e3 and 16e3 time units after an order is sent, and they select orders based on the ground-truth timing of fundamental price changes. These features are forward-looking: they encode realized future returns and require knowledge of when fundamental jumps occurred. Because both the supervised classifiers and the clustering method use these features, the reported 0.99 classification accuracy and the gap over clustering in the 18-feature scenarios may be partly an artifact of outcome leakage rather than a general property of the trading behaviors. The 9-feature results in Tables 2 and 7 show a reduced but still present gap in the no-noise case (0.85 vs 0.74), which suggests the qualitative direction may survive, but the headline claim as stated is not established. Please ablate the fundamental-profit features or replace them with versions that use only information available at order time (e.g., time since an announced event) and report the comparison on the remaining features.
- [Section 3.1, Tables 1-4] The test-set supports reported in Tables 1-4 (e.g., 160 for each market-maker class, 8480 for noise traders) sum to 12,720 agents, which corresponds to all agents from 8 simulations. With 1590 agents per simulation, the stated 30% test split of 40 simulations would give only 477 test agents, so the reported numbers are internally inconsistent with the description in Section 3.1. This makes the exact accuracy values (0.99, 0.85, 0.91, etc.) non-reproducible from the stated procedure and weakens the quantitative form of the central claim. Please clarify how the data were split and either correct the reported supports or recompute the accuracies accordingly.
- [Section 3.2] The clustering hyperparameters, including the linkage method and the number of clusters, are selected on the noise-free 18-feature dataset and then applied to all other settings, whereas the supervised classifiers are tuned per setting on a validation set. This asymmetric tuning protocol biases the quantitative comparison between the two families of methods. In addition, all reported results are aggregated over simulations without any per-simulation variance or standard errors, so the reader cannot assess whether the classification-clustering gaps are statistically significant. Please report variability across simulations and either tune clustering per setting with a held-out validation split or explicitly justify the fixed-parameter choice as a deliberate and symmetric protocol.
- [Section 2.1.2] The simulation is validated only through fat-tailed return distributions and volatility clustering, and the text admits an undesirable negative first-order autocorrelation in returns. Since the central claim is framed as a caution for real-market clustering applications, the inference that 'clustering may give incorrect or even misleading results' in real markets rests on the assumption that the synthetic agent population produces order-flow features sufficiently similar to empirical data. This assumption is not directly tested. Please add a more direct comparison of the feature distributions with real order-flow data, or soften the external-validity claim so that the conclusions are explicitly about the synthetic testbed rather than real markets.
minor comments (5)
- [Section 2.1.1] In the chartist description, 'marked order' appears to be a typo for 'market order'.
- [Section 3.1] The phrase 'Although the latter latter case is strongly affected' contains a duplicated word; this should be corrected.
- [Section 2.2] The feature descriptions use units like '10^3 seconds' while the simulation time unit is stated as 0.1 seconds in Section 2.1.2; please clarify whether these are simulation time units or real seconds to avoid confusion about the lookback and profit horizons.
- [Table 5, Panel A] The row containing only 'noise trader 7' appears incomplete and is not aligned with the other rows, which have assigned cluster, precision, recall, F1, and support values; please fix the table formatting or explain the intended content.
- [Figures 4-5 and 12-15] The confusion matrices use negative off-diagonal entries by convention, but this is explained only in the text for Figures 4-5; the same explanation should be repeated in the captions of the clustering confusion matrices for clarity.
Circularity Check
The 18-feature supervised accuracy is partly constructed: the handcrafted features encode the chartist and fundamentalist definitions, including hidden fundamental-event timing and future prices; the clustering-vs-classification gap retains only mixed independent support from the 9-feature ablation.
-
self definitional
[Sec. 2.2 (additional features, 'Short directed trend') and Sec. 2.1.1 Eq. (1)]
"Short directed trend: average product of the difference between the mid-price at the time an order was sent and the mid-price 10^3 seconds before, and the order direction (1 for bid and −1 for ask)."
The chartist classes are defined by Eq. (1): expected return over horizon h is wC(p_t − p_{t−h}) + ε_t, with positive wC meaning trend continuation and negative wC meaning reversal, and the agent trades in the direction of the expected move. The added directed-trend features compute exactly the direction-weighted past price change over 10^3 and 4·10^3 seconds, which in the simulation's time unit (1/10 s) are the chartists' 10,000 and 40,000 time-unit horizons. The feature is thus a noisy realization of the class-defining variable wC(p_t − p_{t−h}); separating chartist sub-classes on this feature is built into the feature definition rather than discovered from the data.
-
self definitional
[Sec. 2.2 ('Fundamental profit') and Sec. 2.1.2 Eq. (3)]
"Fundamental profit: average profit around the fundamental events. Specifically, we take only the orders, which were send after the fundamental price change, but not more than 2 · 10^3 seconds after. For these we compute the current mid-price and the mid-price after 8 · 10^3 seconds."
The fundamental price p*_t in Eq. (3) is a hidden state that 'is observed only by the fundamentalists', and Eq. (2) defines fundamentalists as trading on (p*_t − p_t). This feature selects orders using the ground-truth timing of the hidden fundamental jumps and measures their direction-adjusted future mid-price return over 8·10^3/16·10^3 seconds. The feature therefore injects the label-generating hidden state and future outcomes into the classifier; the near-perfect 18-feature accuracy (0.99) is partly an artifact of this construction, and the gap to clustering is inflated relative to a purely contemporaneous feature set.
full rationale
The clustering results themselves are an honest, measured comparison against synthetic ground truth: clusters are assigned to classes by majority vote, and the reported accuracies are not fitted parameters. The paper's self-references are limited to code repositories and are not load-bearing. However, the 18-feature supervised success is substantially self-definitional. The directed-trend features reproduce the chartist-defining quantity wC(p_t − p_{t−h}) of Eq. (1) over the chartists' own horizons, and the fundamental-profit features use the hidden fundamental-price jump times of Eq. (3) and future mid-prices, which is the same information that defines fundamentalists. Thus the headline 0.99 classification accuracy is not an independent discovery that behaviors are separable; it is in large part a consequence of encoding the target behavior into the inputs. The qualitative claim has some independent support from the 9-feature ablation (no-noise: 0.85 classification vs 0.74 clustering), but that support is mixed because under 66.6% noise with 9 features clustering (0.62) exceeds classification (0.58/0.57). Separately, the test-set supports in Tables 1-8 imply only 8 simulations rather than the stated 30% of 40; this is a correctness inconsistency, not a circularity. Overall, partial circularity in the feature construction warrants a score of 6.
Assumptions & free parameters
free parameters (5)
- Agent population sizes =
20/20/20 MM, 10/10/10 MT, 100x4 chartists, 10x4 fundamentalists, 1060 noise traders
- Agent activity and update rates =
e.g., 3000/30000/15000 for MM; 15000/30000/45000 for MT; 10000/20000/40000 for others
- Fundamental price jump schedule =
p* = 100 or 70 with jumps at t = 180000, 360000, 540000
- Feature lookback horizons =
10^3, 2e3, 4e3 seconds; profit windows 8e3 and 16e3 seconds
- Noise contamination level =
50% and 66.6% by merging one or two noise traders per agent
assumptions (4)
- ad hoc to paper Agent classes are behaviorally distinct by construction
- domain assumption The synthetic market reproduces sufficient stylized facts for transfer to real markets
- domain assumption Order-flow features computed from the simulation capture the behavior needed to identify trader types
- standard math Standard machine learning methods are suitable for this task
invented entities (2)
-
Hidden fundamental price p*_t
-
Noise-merged agent
Cite this review
Pith. "Pith review of Classifying and Clustering Trading Agents." pith.science (2026). https://pith.science/paper/237P3ISC
@misc{pith2026250521662,
  author       = {Pith},
  title        = {Pith review of: Classifying and Clustering Trading Agents},
  year         = {2026},
  howpublished = {\url{https://pith.science/paper/237P3ISC}},
  note         = {Machine review of arXiv:2505.21662}
}
read the original abstract
The rapid development of sophisticated machine learning methods, together with the increased availability of financial data, has the potential to transform financial research, but also poses a challenge in terms of validation and interpretation. A good case study is the task of classifying financial investors based on their behavioral patterns. Not only do we have access to both classification and clustering tools for high-dimensional data, but also data identifying individual investors is finally available. The problem, however, is that we do not have access to ground truth when working with real-world data. This, together with often limited interpretability of modern machine learning methods, makes it difficult to fully utilize the available research potential. In order to deal with this challenge we propose to use a realistic agent-based model as a way to generate synthetic data. This way one has access to ground truth, large replicable data, and limitless research scenarios. Using this approach we show how, even when classifying trading agents in a supervised manner is relatively easy, a more realistic task of unsupervised clustering may give incorrect or even misleading results. We complete the results with investigating the details of how supervised techniques were able to successfully distinguish between different trading behaviors.
Figures


Figures from the paper (12 more)


Forward citations
Cited by 1 Pith paper
-
Prospects of Imitating Trading Agents in the Stock Market
A state-space generative model trained on synthetic limit order book data can partially imitate trading agent behavior, matching some action distributions while underestimating cancellations, with results limited by h...
Reference graph
Works this paper leans on
-
[1]
Abhyankar, A., Ghosh, D., Levin, E. and Limmack, R., Bid-ask spreads, trading volume and volatility: Intra-day evidence from the London Stock Exchange. Journal of Business Finance & Accounting, 1997, 24, 343–362. Baltakien˙ e, M., Kanniainen, J. and Baltakys, K., Identification of information networks in stock markets. Journal of Economic Dynamics and Cont...
work page 1997
-
[9]
and Elisseeff, A., An introduction to variable and feature selection
Guyon, I. and Elisseeff, A., An introduction to variable and feature selection. Journal of machine learning research, 2003, 3, 1157–1182. Hagstr¨ omer, B. and Nord´ en, L., The diversity of high-frequency traders.Journal of Financial Markets, 2013, 16, 741–770. Huberman, G. and Stanzl, W., Optimal liquidity trading. Review of finance, 2005, 9, 165–200. Kala...
arXiv 2003
-
[10]
and Alsaadi, F.E., A survey of deep neural network architectures and their applications
Liu, W., Wang, Z., Liu, X., Zeng, N., Liu, Y. and Alsaadi, F.E., A survey of deep neural network architectures and their applications. Neurocomputing, 2017, 234, 11–26. Lo, A.W., Mamaysky, H. and Wang, J., Foundations of Technical Analysis. Journal of Finance ,
work page 2017
-
[13]
and Wellman, M.P., Welfare effects of market making in continuous double auctions
Wah, E., Wright, M. and Wellman, M.P., Welfare effects of market making in continuous double auctions. Journal of Artificial Intelligence Research , 2017, 59, 613–650. Wilinski, M., https://github.com/mateuszwilinski/lob-abm-simulator/. ,
work page 2017
-
[223]
and Prenzel, F., Analysis and modeling of client order flow in limit order markets
Cont, R., Cucuringu, M., Glukhov, V. and Prenzel, F., Analysis and modeling of client order flow in limit order markets. Quantitative Finance, 2023, 23, 187–205. De Long, J.B., Shleifer, A., Summers, L.H. and Waldmann, R.J., Noise Trader Risk in Financial Markets. Journal of Political Economy ,
work page 2023
-
[1988]
and Foley, D., The economy needs agent-based modelling
Farmer, J.D. and Foley, D., The economy needs agent-based modelling. Nature, 2009, 460, 685–686. Fischer, T. and Krauss, C., Deep Learning for Price Prediction in Financial Markets. European Journal of Operational Research,
work page 2009
-
[2000]
M¨ akinen, Y., Kanniainen, J., Gabbouj, M. and Iosifidis, A., Forecasting jump arrivals in stock prices: new attention-based network architecture using limit order book data. Quantitative Finance , 2019, 19, 2033–2050. Menkveld, A.J., High frequency trading and the new market makers. Journal of financial Markets , 2013, 16, 712–740. Montavon, G., Binder, A....
work page 2019
-
[2011]
Challet, D., Chicheportiche, R., Lallouache, M. and Kassibrakis, S., Statistically validated lead-lag networks and inventory prediction in the foreign exchange market. Advances in Complex Systems , 2018, 21, 1850019. Cont, R., Empirical properties of asset returns: stylized facts and statistical issues. Quantitative finance, 2001, 1,
work page 2018
Show all 13 references
-
[2014]
and Balch, T.H., ABIDES: Towards high-fidelity multi-agent market simulation
Byrd, D., Hybinette, M. and Balch, T.H., ABIDES: Towards high-fidelity multi-agent market simulation. In Proceedings of the Proceedings of the 2020 ACM SIGSIM Conference on Principles of Advanced Discrete Simulation, pp. 11–22,
2020
-
[2018]
and Howison, S.D., Limit order books
Gould, M.D., Porter, M.A., Williams, S., McDonald, M., Fenn, D.J. and Howison, S.D., Limit order books. Quantitative Finance, 2013, 13, 1709–1742. Grossman, S.J. and Miller, M.H., Liquidity and Market Structure. Journal of Finance ,
2013
-
[2020]
and Wang, X., The information content of an open limit-order book
Cao, C., Hansch, O. and Wang, X., The information content of an open limit-order book. Journal of Futures Markets: Futures, Options, and Other Derivative Products , 2009, 29, 16–41. Chakraborty, T. and Kearns, M., Market making and mean reversion. In Proceedings of the Proceed...
2009
-
[2021]
and Potters, M., Statistical properties of stock order books: empirical results and models
26 August 31, 2025 ArXiv manuscript Bouchaud, J.P., M´ ezard, M. and Potters, M., Statistical properties of stock order books: empirical results and models. Quantitative finance, 2002, 2,
2025
-
[2023]
Journal of Machine Learning Technologies , 2011, 2, 37–63
Powers, D., Evaluation: From Precision, Recall and F-Measure to ROC, Informedness, Markedness & Cor- relation. Journal of Machine Learning Technologies , 2011, 2, 37–63. Preis, T., Price-time priority and pro rata matching in an order book model of financial markets. In Econo- ...
2011
Reviewed August 7, 2026 · model on record in the stance chip above.
Discussion (0). Sign in to comment.