REVIEW 4 major objections 5 minor 1 cited by
Adaptive Block-Based Change-Point Detection for Sparse Spatially Clustered Data with Applications in Remote Sensing Imaging
T0 review · 4 major / 5 minor · reviewed 2026-08-07 · deepseek-v4-flash
Pith's one-line read ABCD is proposed as a nonparametric method that detects sparse, spatially clustered changes in a sequence of high-dimensional observations or non-Euclidean objects, returning both the change time and the block where the change happened…
desk verdict ABCD is a genuinely useful nonparametric method for sparse spatially clustered change-point detection, but its real-data p-values rest on an exchangeability assumption the seasonal Natanz series likely violates. read the letter →
The pith
A machine-rendered reading of the paper's core claim, the machinery that carries it, and where it could break.
The reading
What carries the argument
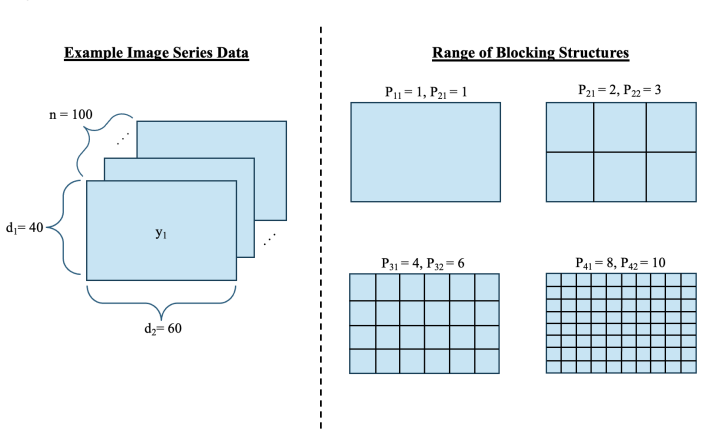
The central object is the blocking ensemble of graph-based scan statistics. For a blocking structure with $P_s$ blocks, each block is treated as a separate multivariate time series, a similarity graph such as a $k$-MST is built on distances within that block, and $M_j(t)$ is the max-type edge-count statistic measuring distributional difference between observations before and after time $t$ inside block $j$. The ensemble combines these as $V_s(t) = \max_j M_j(t)$ and $V_{avg}(t) = \frac{1}{S}\sum_s V_s(t)$, with test statistic $T = \max_t V_{avg}(t)$; the max across blocks isolates the block containing the change region, while averaging across block granularities keeps power stable when the true change-region size is unknown.
What would settle it
Simulate a long null series with the same seasonal pattern and temporal autocorrelation as the Natanz data, standardize it with the paper's own per-image robust standardization, run ABCD with its alpha = 0.01 permutation threshold, and count how often a change-point is declared; if the false-positive rate far exceeds 0.01, the permutation calibration claim fails.
Extended reading notes
Core claim
The central claim is that a block-ensemble graph-based scan statistic solves the sparse-clustered change-point problem: rather than building one similarity graph over all coordinates, ABCD splits the coordinates into contiguous blocks at several granularities, builds a similarity graph within each block, and computes a max-type edge-count scan statistic per block. For each blocking structure it takes the maximum over blocks at every time point, then averages these maxima across structures; the estimated change time is the argmax of that average, and significance is assessed by a permutation p-value computed on the overall maximum. This max-then-average construction is what makes the method adaptive to unknown change-region size, and it lets ABCD detect general distributional changes, not just mean changes, without estimating spatial correlation or assuming a known sparsity level. The block that reports the largest statistic doubles as an estimate of where the change occurred.
Load-bearing premise
The method's reported significance levels rest on the assumption that, under no change, the observations are exchangeable in time so that the permutation p-value approximates the true null distribution; if temporal dependence or trend remains after pre-processing, the p-values and change-point list are uncalibrated.
Editorial extensions
If this is right
- Users can detect change-points in high-dimensional image, network, or other non-Euclidean time series without specifying the sparsity level, the spatial correlation, or the change-region size, and they receive an estimate of where the change occurred.
- The method extends graph-based change-point tests to sparse alternatives, so it should detect changes that are invisible under whole-vector distance metrics; the motivating simulation shows power remaining near 100 percent when competing graph-based detection drops toward 20 percent as the cluster shrinks.
- Paired with seeded binary segmentation, ABCD produces multiple change-points and was able to flag construction-related activity in publicly available satellite imagery of the Natanz facility.
- Because it relies on permutation calibration and graph-based statistics, ABCD is distribution-free and retains detection power under heavy-tailed and correlated data, settings where Gaussian scan approaches lose power.
- The block with the largest scan statistic provides a spatial localization map for each detected change-point, a feature most competing methods do not offer.
Reading between the lines
- An online monitoring version of ABCD could be built by running the block-level scan statistics on a sliding window and using the argmax block to flag pixels for human review as new satellite images arrive; the paper names online detection as future work but the block ensemble carries over directly.
- The reported significance levels depend on the permutation null being a valid approximation of the true null, so the Natanz results should be rechecked with a null model that preserves seasonal trend and temporal autocorrelation; otherwise the alpha = 0.01 thresholds could be miscalibrated.
- The block-argmax localization could be tested as a change-region recovery tool against spatial scan statistics under nonstationary nulls, where the space-time scan statistic's assumptions are known to strain.
- Because the method aggregates several block sizes, it could also be used as a diagnostic for the spatial scale of a change: the blocking structure whose per-block maximum is highest is informative about how large the affected region is.
Editorial analysis
A structured set of objections, weighed in public.
Referee Report
Summary. The paper proposes ABCD, a nonparametric offline change-point detection method for high-dimensional or non-Euclidean time series, targeting sparse changes that occur in a small, spatially contiguous subset of coordinates. The method partitions coordinates into blocks at several resolutions, computes graph-based max-type scan statistics within each block, aggregates across block structures into V_avg(t), estimates the change-point as the maximizing time point, and calibrates T = max_t V_avg(t) via a permutation p-value. The method is evaluated in simulations against Inspect, DC, SCAN, 2WayMOSUM, and SSS, and applied to Sentinel-2 imagery of the Natanz nuclear facility to detect construction activity, using seeded binary segmentation for multiple change-points and logistic-regression fitted probabilities as the response series.
Significance. If the central claims hold, ABCD is a useful contribution: it targets general distributional changes, does not require prior knowledge of sparsity or correlation, and provides both change-time and spatial-location estimates. The adaptive blocking idea is simple and computationally more attractive than exhaustive spatial scans, and the permutation p-value construction is clearly specified. The Natanz case study is an interesting practical demonstration. However, the evaluation evidence is weakened by favorable simulation design, by the use of oracle Monte Carlo thresholds in the main simulations rather than the proposed permutation calibration, and by application-specific concerns about the construction and calibration of the analyzed series.
major comments (4)
- [Section 4.1 and Supplement A3] The adaptive claim is not actually tested against the simulation design. With d = 1000 and P = (1, 4, 10, 20, 40)^T, the block sizes are 1000, 250, 100, 50, and 25, which exactly match the sparsity levels D = 100, 50, and 25 used in the main text and Supplement A3. In each of those settings, one blocking structure places the entire change region in a single block, and the change region is aligned with the beginning of the coordinate ordering. The reported power advantage therefore may reflect favorable tuning rather than adaptivity to an unknown change region. Please include settings where the sparsity level falls between block sizes (e.g., D = 75), where the change region is shifted away from block boundaries, and where the changed coordinates form several separated clusters rather than one contiguous block.
- [Section 4.1 (Figure 7)] The primary high-dimensional simulation results do not use the proposed significance calibration. The text states that thresholds are obtained from 10,000 Monte Carlo simulations under the known null distribution, whereas the method's Type-I error control claim in Section 1.3 rests on the permutation p-value of Section 3.2.2. The permutation procedure should be evaluated directly: report empirical Type-I error under H0 and detection accuracy under alternatives using permutation p-values, with Monte Carlo error for the 100-trial proportions. This is particularly important because the image simulations in Section 4.2 use permutation p-values while the high-dimensional simulations use oracle thresholds.
- [Section 5.1] The application series is not an unsupervised image sequence. The array \hat L is obtained by fitting a logistic regression to manually constructed labels L that change only at five reference-image dates, and ABCD is applied to these fitted probabilities rather than to standardized image bands directly. The most significant change-point at \hat\tau = 131 (01/24/2022) immediately precedes the 01/25/2022 reference image date used to assign labels, which suggests that the detected signal may reflect the label construction schedule rather than genuinely new activity detected from imagery. The Natanz analysis should be reframed as a supervised validation exercise, or the detection pipeline should be applied directly to a suitably standardized image series without using labels to build the response.
- [Section 3.2.2 and Section 5.2 (Table 3)] The permutation p-value in Section 3.2.2 is valid only if the observations are exchangeable under H0. Section 5.1 states that the raw Sentinel-2 bands are highly non-stationary, with a recording jump around January 2022 and seasonal patterns; the per-image median/IQR standardization is a marginal transform and does not remove temporal autocorrelation or local seasonal structure. The fitted-probability series \hat L therefore inherits temporal dependence, so the alpha = 0.01 p-values reported in Table 3 are not calibrated. The authors should either use a null that accounts for the dependence (e.g., a block bootstrap or a seasonal/sieve detrending step) or explicitly present the application results as exploratory rather than significance-based confirmatory evidence.
minor comments (5)
- [Title and Abstract] The title and abstract contain typographical spacing artifacts such as 'SP ARSE' and 'SPA TIALL Y'; these should be corrected in the final version.
- [Section 3.2.2] The notation V_s(t) is introduced as 'a vector', but for a fixed t it is a scalar; the authors should clarify that V_s is a vector indexed by time t.
- [Section 4.1] The change region is written as C \subseteq (h_1, ..., h_1000); since C is an index set, it should be C \subseteq {1, ..., 1000}.
- [Section 5.2] The SBS procedure tests many sub-intervals and the eight most significant change-points are then selected; no multiple-testing adjustment or false-discovery control is described, and the authors should state how this selection affects the reported p-values.
- [Table 2] With only 100 trials, the reported proportions have Monte Carlo standard errors of roughly 2-5 percentage points, so comparisons such as ABCD 96 versus SSS 92 in the Gaussian image setting are not distinguishable from noise; confidence intervals or additional trials would make the comparative claims more convincing.
Circularity Check
Application leg is circular: the analyzed Natanz series is fitted to a label array built from reference images that are then used to confirm the detected change-points; the core ABCD method and simulations are independent.
-
fitted input called prediction
[Section 5.1 (label array L and logistic fit) and Section 5.2 (Figure 9, tau = 131)]
"we create another three-dimensional array denoted by L... Lj,k,t = 1 if construction is known to exist at pixel (j,k) at time t, 0 otherwise. This was done by manually classifying areas of construction using high-resolution reference images compiled in Google Earth of the Natanz site taken on 12/18/2019, 12/29/2020, 01/25/2022, 12/22/2022 and 09/16/2023. ... We then fit a logistic regression model for each pixel in the label array over all time-points, using the three bands of pixel values as covariates ... The array L is used as the time series for our final change-point analysis. ..."
The analyzed series is not the raw Sentinel-2 data but the fitted probabilities from a logistic regression whose response variable is a manually constructed label array L. That label array changes only when a high-resolution reference image is available, i.e. at the five listed dates. Applying ABCD to these fitted probabilities therefore amounts to detecting changes in a learned encoding of L, not an independent discovery from the raw imagery. The headline detected change at tau = 131 (01/24/2022) is one day before the 01/25/2022 reference image used to build L, and the validation appeals to 'reference images' from the same set.
full rationale
The core ABCD derivation is not circular: the scan statistic T = max_t V_avg(t) is computed from similarity graphs on the data, and significance is assessed by a permutation p-value computed on that same statistic; no parameter is fitted to the target change-point to force the result. The simulation studies are self-contained and compare against external benchmark methods (Inspect, DC, SCAN, 2WayMOSUM, SSS), so the main methodological claim has independent support. The citations to Chu and Chen (2019) and Chen and Chu (2023) provide a published graph-based framework and analytical null moments; they are not used as a self-citation chain to forbid alternatives, so they are not load-bearing circularity. The genuine circularity is confined to the Natanz application evaluation: the series fed to ABCD is a logistic-regression fit to a label array constructed from five high-resolution reference images, and the same reference images are later cited as corroborating evidence for the detected change-points. This does not invalidate the method or the simulations, but it makes the application demonstration partially circular. A separate validity concern, not a circularity issue, is that the permutation null requires exchangeability while the Sentinel-2 series is described as highly non-stationary and seasonal even after marginal standardization; that concern affects calibration of the reported alpha = 0.01 detections but is outside the circularity pass.
Assumptions & free parameters
free parameters (5)
- Blocking grid P =
P=(1,4,10,20,40) for d=1000 simulations; P matrix rows=(1,4,8,16), cols=(1,6,12,24) for Natanz; P rows=cols=(1,2,3)…
- Similarity graph density k (k-MST) =
k=40 in high-dimensional and image simulations; k=floor(0.2 n_s) in Natanz SBS
- Boundary trimming n0 =
n0=floor(0.05n)
- Permutation count U =
U=1000
- Standardization quantiles =
0.05 and 0.95 empirical quantiles per image and band
assumptions (6)
- domain assumption Components of each y_t are embedded in a metric space (R^q, nu) with ordered, equidistant coordinates.
- domain assumption The change region C is a spatially contiguous subset of dimensions.
- domain assumption Observations are exchangeable under H0, so permutation p-values for T are valid.
- standard math The graph-based max-type statistic M(t) of Chu and Chen (2019) is a valid, distribution-free measure of distributional change within each block.
- standard math Seeded binary segmentation (Kovacs et al., 2023) gives a valid multiple-change-point extension when combined with a single change-point test.
- domain assumption The manually labeled construction array L from high-resolution reference images is accurate enough to train per-pixel logistic regressions whose fitted values \hat L are a faithful monitoring series.
Cite this review
Pith. "Pith review of Adaptive Block-Based Change-Point Detection for Sparse Spatially Clustered Data with Applications in Remote Sensing Imaging." pith.science (2026). https://pith.science/paper/CBXYUDY6
@misc{pith2026250521814,
  author       = {Pith},
  title        = {Pith review of: Adaptive Block-Based Change-Point Detection for Sparse Spatially Clustered Data with Applications in Remote Sensing Imaging},
  year         = {2026},
  howpublished = {\url{https://pith.science/paper/CBXYUDY6}},
  note         = {Machine review of arXiv:2505.21814}
}
read the original abstract
We present a non-parametric change-point detection approach to detect potentially sparse changes in a time series of high-dimensional observations or non-Euclidean data objects. We target a change in distribution that occurs in a small, unknown subset of dimensions, where these dimensions may be correlated. Our work is motivated by a remote sensing application, where changes occur in small, spatially clustered regions over time. An adaptive block-based change-point detection framework is proposed that accounts for spatial dependencies across dimensions and leverages these dependencies to boost detection power and improve estimation accuracy. Through simulation studies, we demonstrate that our approach has superior performance in detecting sparse changes in datasets with spatial or local group structures. An application of the proposed method to detect activity, such as new construction, in remote sensing imagery of the Natanz Nuclear facility in Iran is presented to demonstrate the method's efficacy.
Figures


Figures from the paper (8 more)




Forward citations
Cited by 1 Pith paper
-
Optimal Spatial Anomaly Detection
A convex-hull-penalized least squares method consistently estimates the number, location, and shape of spatial anomaly regions at a near-minimax rate.
Reference graph
Works this paper leans on
-
[1]
Albright, D. and Burkhard, S. (2022). Imagery Update : Iran Continues to Harden its New Natanz Tunnel Complex [1] Institute for Science and International Security
work page 2022
-
[2]
Albright, D., Burkhard, S., and Faragasso, S. (2024). Imagery Update : Construction is Ongoing at the Natanz Tunnel Facility Institute for Science and International Security
work page 2024
-
[3]
Bardwell, L., Fearnhead, P., Eckley, I. A., Smith, S., and Spott, M. (2019). Most Recent Changepoint Detection in Panel Data . Technometrics , 61(1):88--98
work page 2019
-
[4]
Bhattacharjee, M., Banerjee, M., and Michailidis, G. (2019). Change Point Estimation in Panel Data with Temporal and Cross -sectional Dependence . Publisher: arXiv Version Number: 1
work page 2019
-
[5]
Bhattacharya, B. B. (2020). Asymptotic distribution and detection thresholds for two-sample tests based on geometric graphs. The Annals of Statistics , 48(5):2879--2903. Publisher: Institute of Mathematical Statistics
work page 2020
-
[6]
Cai, H. and Wang, T. (2023). Estimation of high-dimensional change-points under a group sparsity structure. Electronic Journal of Statistics , 17(1):858--894. Publisher: Institute of Mathematical Statistics and Bernoulli Society
work page 2023
-
[7]
Chen, H. and Chu, L. (2023). Graph- Based Change - Point Analysis . Annual Review of Statistics and Its Application , 10(1):475--499. \_eprint: https://doi.org/10.1146/annurev-statistics-122121-033817
-
[8]
Cho, H. (2016). Change-point detection in panel data via double CUSUM statistic. Electronic Journal of Statistics , 10(2):2000--2038. Publisher: Institute of Mathematical Statistics and Bernoulli Society
work page 2016
Show all 29 references
-
[9]
and Chen, H
Chu, L. and Chen, H. (2019). Asymptotic distribution-free change-point detection for multivariate and non- Euclidean data. The Annals of Statistics , 47(1)
2019
-
[10]
and Müller, H.-G
Dubey, P. and Müller, H.-G. (2020). Fréchet change-point detection. The Annals of Statistics , 48(6)
2020
-
[11]
and Harchaoui, Z
Enikeeva, F. and Harchaoui, Z. (2019). High-dimensional change-point detection under sparse alternatives. The Annals of Statistics , 47(4)
2019
-
[12]
Friedman, J. H. and Rafsky, L. C. (1979). Multivariate Generalizations of the Wald - Wolfowitz and Smirnov Two - Sample Tests . The Annals of Statistics , 7(4)
1979
-
[13]
Fryzlewicz, P. (2014). Wild Binary Segmentation for Multiple Change - Point Detection . The Annals of Statistics , 42(6):2243--2281. Publisher: Institute of Mathematical Statistics
2014
-
[14]
Henze, N. (1988). A Multivariate Two - Sample Test Based on the Number of Nearest Neighbor Type Coincidences . The Annals of Statistics , 16(2)
1988
-
[15]
Hollaway, M. J. and Killick, R. (2024). Detection of spatiotemporal changepoints: a generalised additive model approach. Statistics and Computing , 34(5):162
2024
-
[16]
Jiang, F., Zhu, C., and Shao, X. (2024). Two-sample and change-point inference for non- Euclidean valued time series. Electronic Journal of Statistics , 18(1):848--894. Publisher: Institute of Mathematical Statistics and Bernoulli Society
2024
-
[17]
Jirak, M. (2015). Uniform change point tests in high dimension. The Annals of Statistics , 43(6):2451--2483. Publisher: Institute of Mathematical Statistics
2015
-
[18]
Kovács, S., Bühlmann, P., Li, H., and Munk, A. (2023). Seeded binary segmentation: a general methodology for fast and optimal changepoint detection. Biometrika , 110(1):249--256
2023
-
[19]
Kulldorff, M. (1997). A spatial scan statistic. Communications in Statistics - Theory and Methods , 26(6):1481--1496
1997
-
[20]
Kulldorff, M., Huang, L., and Konty, K. (2009). A scan statistic for continuous data based on the normal probability model. International Journal of Health Geographics , 8(1):58
2009
-
[21]
Li, J., Chen, L., Wang, W., and Wu, W. B. (2024). l2 inference for change points in high-dimensional time series via a Two - Way MOSUM . The Annals of Statistics , 52(2):602--627. Publisher: Institute of Mathematical Statistics
2024
-
[22]
Liu, B., Zhou, C., Zhang, X., and Liu, Y. (2020). A Unified Data - Adaptive Framework for High Dimensional Change Point Detection . Journal of the Royal Statistical Society Series B: Statistical Methodology , 82(4):933--963
2020
-
[23]
Loh, J. M. and Zhu, Z. (2007). Accounting for spatial correlation in the scan statistic. The Annals of Applied Statistics , 1(2)
2007
-
[24]
Matteson, D. S. and James, N. A. (2014). A Nonparametric Approach for Multiple Change Point Analysis of Multivariate Data . Journal of the American Statistical Association , 109(505):334--345. Publisher: Taylor & Francis \_eprint: https://doi.org/10.1080/01621459.2013.849605
2014
-
[25]
Moradi, M., Cronie, O., Pérez-Goya, U., and Mateu, J. (2023). Hierarchical Spatio - Temporal Change - Point Detection . The American Statistician , 77(4):390--400
2023
-
[26]
Scott, A. J. and Knott, M. (1974). A Cluster Analysis Method for Grouping Means in the Analysis of Variance . Biometrics , 30(3):507
1974
-
[27]
and Samworth, R
Wang, T. and Samworth, R. J. (2018). High Dimensional Change Point Estimation via Sparse Projection . Journal of the Royal Statistical Society Series B: Statistical Methodology , 80(1):57--83
2018
-
[28]
and Zhu, Z
Zhang, L. and Zhu, Z. (2012). Spatial Multiresolution Cluster Detection Method . arXiv:1205.2106 [stat]
2012 arXiv
-
[29]
Zhang, Y., Wang, R., and Shao, X. (2022). Adaptive Inference for Change Points in High - Dimensional Data . Journal of the American Statistical Association , 117(540):1751--1762
2022
Reviewed August 7, 2026 · model on record in the stance chip above.
Discussion (0). Sign in to comment.