REVIEW 5 major objections 3 minor 64 references
A Systematic Approach for Studying How Topological Measurements Respond to Complex Networks Modifications
T0 review · 5 major / 3 minor · reviewed 2026-08-07 · deepseek-v4-flash
Pith's one-line read Progressive network changes sort topological measurements into three response types, with Erdős–Rényi and Barabási–Albert networks behaving alike while geographical networks stand apart.
desk verdict A useful but under-validated empirical taxonomy of how network measurements respond to perturbations; the central claims survive the weak spots only partially. read the letter →
The pith
A machine-rendered reading of the paper's core claim, the machinery that carries it, and where it could break.
The reading
What carries the argument
The argument runs on three linked objects. First, each measurement's change is turned into a normalized signature $c_{i,j} = (x_{i,j} - \min_i x_{i,j})/\sigma_j$, so that only the shape of the response curve survives. Second, pairs of signatures are compared with the coincidence similarity index, $C(\vec{x},\vec{y}) = J_D(\vec{x},\vec{y})\,I_E(\vec{x},\vec{y})$, the Jaccard-style multiset similarity multiplied by an interiority factor, with strictness parameters $D=5$ and $E=1$; this index supplies both the edge weights of a similarity network (nodes are measurements) and the input to agglomerative clustering. Third, the resulting dendrograms and network modules are read as evidence that measurements in the same module respond to perturbations in a common way, with module labels A, B, and C encoding mostly-increasing, mostly-decreasing, and other trajectories.
What would settle it
Run the same pipeline on ER networks under edge rewiring, where the paper itself states the measurement changes are statistical fluctuations: if the A/B/C categorization is genuine, shuffling the order of the rewiring steps (or randomly relabeling the measurement curves) should destroy the modules; if the modules survive permutation, they are produced by the normalization and similarity procedure rather than by real network response types.
Extended reading notes
Core claim
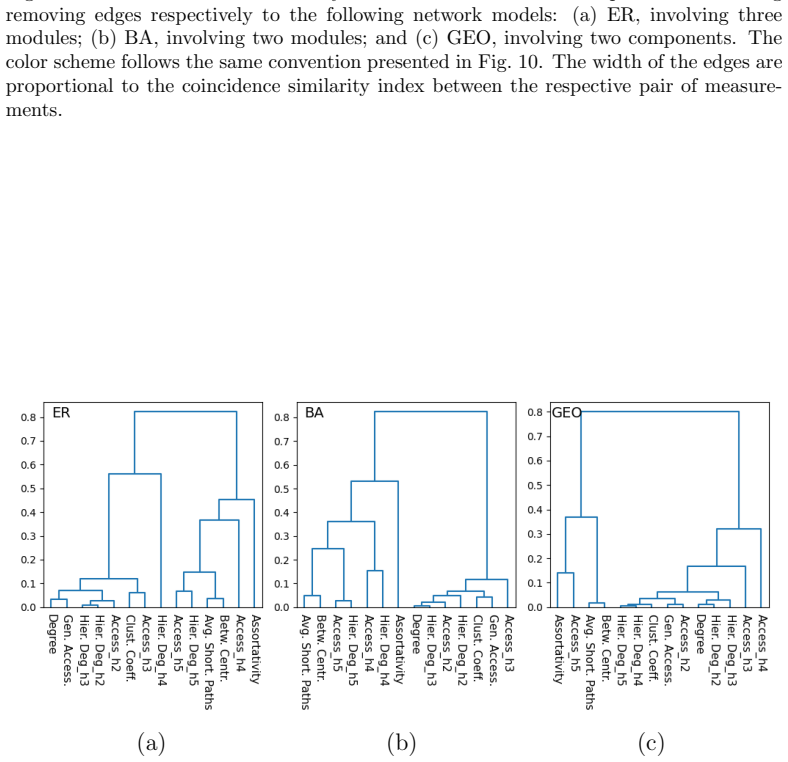
The central claim is that the response of a topological measurement to progressive network change can be classified into one of three types — mostly increasing (A), mostly decreasing (B), or other, including oscillation and near-constancy (C) — and that these types appear as well-separated modules in coincidence similarity networks and as branches in dendrograms built from the same similarities. For the size-growth experiment, most of the fourteen measurement variants increase across all three network models, with clustering coefficient and assortativity as the main decreasing exceptions. For edge removal, measurements split into a larger decreasing group and a smaller increasing group, with the increasing set containing average shortest path, betweenness centrality, assortativity, and accessibility at level $h=5$. For edge rewiring, the ER curves are statistical fluctuations and fall into category C, whereas BA and GEO networks show defined A/B/C structure. Across experiments, the measurement-change patterns of ER and BA networks resemble each other more than they resemble GEO, whose modules are more compact and whose responses are more heterogeneous, indicating a distinctive spatial finite-size component in the geographical model.
Load-bearing premise
The load-bearing premise is that the chosen normalization (subtracting each curve's minimum and dividing by its standard deviation) together with the coincidence similarity parameters $D=5$ and $E=1$ makes the computed similarities reflect genuine shape relationships, so that the A/B/C modules are properties of the networks rather than artifacts of the analysis pipeline.
Editorial extensions
If this is right
- In the size-growth experiments, most of the fourteen measurement variants behave as type A across ER, BA, and GEO, so growth trends of a network can be expected to push most topological indicators upward; clustering coefficient and assortativity are the visible exceptions.
- Under edge removal, average shortest path length, betweenness centrality, assortativity, and accessibility at $h=5$ form a stable increasing group, meaning these measurements track edge density in a predictable direction.
- For edge rewiring, ER networks are statistically indistinguishable from their rewired versions, so any apparent response pattern in that setting should be treated as fluctuation rather than topology.
- GEO networks, with their compact and densely interconnected modules, can be expected to show stronger and more linear measurement responses to rewiring than ER or BA networks.
- The A/B/C labels give a compact vocabulary for comparing how different networks and modifications affect the same measurement, as summarized in the parallel-coordinate diagram.
Reading between the lines
- A natural extension the paper does not run: apply the same pipeline to node-removal attacks or to sampled subgraphs of a real network and ask whether the A/B/C modules persist or shift.
- Because the normalization step subtracts each curve's minimum and divides by its standard deviation, curves with tiny absolute changes are amplified; comparing against non-normalized magnitudes would reveal how much of the taxonomy is produced by the normalization choice.
- The reported ER/BA similarity could be a consequence of both models lacking the spatial constraints that organize GEO networks; a parameterized family interpolating between random and geometric topologies could test whether the similarity scales continuously with spatial structure.
- If the module structure is stable, it would support measurement substitution: within a module, one measurement's response could be used to impute another's when only a subset of measurements can be computed.
Editorial analysis
A structured set of objections, weighed in public.
Referee Report
Summary. The paper proposes a methodological pipeline for studying how seven families of topological network measurements (degree, clustering coefficient, betweenness centrality, assortativity, average shortest path length, hierarchical degree at several scales, and accessibility at several scales) respond to three progressive network modifications: changes in network size, edge removal, and edge rewiring. For Erdős–Rényi, Barabási–Albert, and geographical networks, the authors compute measurement-change curves, normalize them using Eq. (1), and use the coincidence similarity index (Eqs. (2)–(4)) to build similarity networks and agglomerative dendrograms. From these, they identify three qualitative categories of measurement response (A: mostly increasing, B: mostly decreasing, C: other) and conclude that ER and BA networks respond more similarly to each other than to GEO networks.
Significance. If robustly established, the proposed taxonomy of topological-response types and the ER/BA-vs-GEO similarity claim would be a useful descriptive addition to network-science methodology, particularly for researchers concerned with how incomplete or noisy network representations affect measured topology. The paper is commendably explicit about experimental settings: it reports numbers of realizations (Q=1000 for the size experiment and Q=50 for edge removal and rewiring), network sizes, average degrees, and the exact indices used. The main weakness is that the central conclusions rest on a normalization and on similarity-index parameters whose effects are not validated with sensitivity analyses, null models, or quantitative classification criteria. The reported observations are plausible, but the paper does not yet rule out that some of the apparent structure, especially for ER rewiring, is produced by the analysis pipeline itself.
major comments (5)
- [Sec. 4.3 and Fig. 16(a)] There is a direct contradiction between the text and the figure caption: Sec. 4.3 states that “all measurements changes obtained for the ER networks belong to the category C,” while the caption of Fig. 16(a) describes the ER rewiring coincidence similarity network as “involving three modules.” Because the input to the similarity network is the Eq. (1) normalized curves, and because the paper itself says these ER curves “consist of statistical fluctuations,” the modular structure in Fig. 16(a) appears to be a potential artifact of normalizing noise. This is load-bearing for the A/B/C taxonomy and for the similarity-network-based grouping. Please reconcile the inconsistency and provide a null-model analysis (for example, applying the same pipeline to shuffled or resampled curves) showing that modular structure is not produced by the pipeline on pure noise.
- [Sec. 4.1, Eq. (1)] The normalization c_{i,j} = (x_{i,j} - min(x_{i,j}))/sigma_j is used as the direct input for all similarity networks and dendrograms. The paper itself warns in Sec. 4.1 that this normalization “can amplify the dispersion of a set of values originally presenting standard deviations smaller than 1.” Since curves with very small original variance (including the ER rewiring fluctuations) are scaled to unit standard deviation, the subsequent similarity structure may be dominated by noise amplification rather than by meaningful topological response. No alternative normalization (e.g., min-max, variance-stabilizing, or thresholded) is tested. A sensitivity analysis with at least one other normalization would be needed to support the claim that the identified modules reflect intrinsic properties of the measurement responses.
- [Sec. 3.4 and Sec. 3.6] The coincidence similarity index parameters are fixed at D=5, E=1, and delta=0 without a justification or a sensitivity analysis. Since larger values of D and E are said to make comparisons stricter, the module structure and dendrogram topology in Figs. 7, 9, 12, 13, 16, and 17 could depend strongly on these arbitrary parameter choices. The paper should report whether the A/B/C taxonomy and the ER/BA-vs-GEO ordering remain stable across a range of D and E values.
- [Secs. 4.1–4.3] The assignment of measurements to the categories A, B, and C is performed by visual inspection of the curves in Figs. 3–5, 10, and 14, with no operational definition. Terms such as “mostly monotonical increase,” “mostly monotonical decrease,” and “other types of changes” are not formalized, and no inter-rater reliability, automated rule, or statistical significance testing is reported. Because the central claim is the existence of these three response types, a reproducible decision rule (for example, based on monotonicity, slope sign, or oscillation amplitude) is necessary.
- [Sec. 4.4 and Fig. 18] The main comparative claim that ER and BA networks are more similar to each other than to GEO networks is supported by visual inspection of the dendrograms and the parallel-coordinate diagram in Fig. 18, rather than by a quantitative measure. No confidence intervals, permutation tests, or similarity indices between dendrograms or module assignments are provided. Given that the claim is a central conclusion, the authors should quantify the comparison, for example using normalized mutual information between module assignments or cophenetic correlation between dendrograms, with a suitable null model.
minor comments (3)
- [Fig. 13 caption] The caption of Fig. 13 refers to “Fig. 7” but the actual reference should be to Fig. 12, since the dendrograms correspond to the edge-removal similarity networks.
- [Sec. 4.2] The discussion of the edge-removal experiment is inconsistent about the direction of the free variable: the text mentions “measurement changes increasing with the average node degree” and then says “the average shortest path length decreases with the number of edges,” which is difficult to reconcile with the same paragraph’s list. Please clarify whether curves are plotted against the number of remaining edges or the number of removed edges, and check the associated A/B assignments.
- [Sec. 3.1 and throughout] There are several typographical issues that should be corrected, including “S˜ao” for “São” in the author affiliations and the possessive “complex networks measurements” in Sec. 4.2. A careful proofreading pass is recommended.
Circularity Check
No significant circularity: the A/B/C taxonomy and ER/BA-vs-GEO comparison are descriptive summaries of simulated measurement-change curves, not predictions derived from fitted parameters or from self-cited uniqueness claims.
full rationale
The paper fits no parameter to the quantities it later reports. Eq. (1) normalizes each measurement-change curve by its standard deviation, and Eqs. (2)-(4) define the coincidence similarity index with fixed, stated values (delta=0, D=5, E=1; Sec. 3.6). The A/B/C grouping and the ER/BA/GEO comparisons are read from coincidence-similarity networks and dendrograms computed on those normalized curves. Because the formulas are given in the paper and the strictness parameters are not tuned against the reported modules (no fitting or calibration step is described), the central taxonomy is not forced by construction. The method citations [32,33,57,58] are to the authors' own index and clustering framework, but the index is explicitly re-derived in Eqs. (2)-(4) and the clustering is standard agglomerative merging; no uniqueness theorem or prior result is invoked to forbid alternative groupings, so the self-citations are not load-bearing in a circular sense. The paper itself flags the main robustness limitations: Sec. 4.1 warns that the normalization 'can amplify the dispersion of a set of values originally presenting standard deviations smaller than 1,' and Sec. 4.3 states that the ER rewiring curves 'consist of statistical fluctuations and are shown here only for reference.' These passages identify correctness/interpretability risks for the rewiring experiment, and the choice D=5/E=1 lacks sensitivity analysis, but these are validity concerns, not a circular reduction of the claimed result to its inputs. No equation in the paper is shown to equal the target conclusion by construction, and no fitted parameter is renamed as a prediction.
Assumptions & free parameters
free parameters (3)
- Coincidence similarity exponent D =
5
- Interiority exponent E =
1
- Geographic network perturbation epsilon =
0.001
assumptions (4)
- domain assumption The coincidence similarity index (Eq. 2-4) is an appropriate measure for comparing measurement-change curves.
- domain assumption The normalization in Eq. 1 (subtract min, divide by standard deviation) preserves the shape of the curves while removing magnitude.
- domain assumption The three network models (ER, BA, GEO) are representative of complex networks.
- ad hoc to paper The visual classification into A (increase), B (decrease), C (other) reflects objective properties of the curves.
Cite this review
Pith. "Pith review of A Systematic Approach for Studying How Topological Measurements Respond to Complex Networks Modifications." pith.science (2026). https://pith.science/paper/BZR5E6ZB
@misc{pith2026250522345,
  author       = {Pith},
  title        = {Pith review of: A Systematic Approach for Studying How Topological Measurements Respond to Complex Networks Modifications},
  year         = {2026},
  howpublished = {\url{https://pith.science/paper/BZR5E6ZB}},
  note         = {Machine review of arXiv:2505.22345}
}
read the original abstract
Different types of graphs and complex networks have been characterized, analyzed, and modeled based on measurements of their respective topology. However, the available networks may constitute approximations of the original structure as a consequence of sampling incompleteness, noise, and/or error in the representation of that structure. Therefore, it becomes of particular interest to quantify how successive modifications may impact a set of adopted topological measurements, and how respectively undergone changes can be interrelated, which has been addressed in this paper by considering similarity networks and hierarchical clustering approaches. These studies are developed respectively to several topological measurements (accessibility, degree, hierarchical degree, clustering coefficient, betweenness centrality, assortativity, and average shortest path) calculated from complex networks of three main types (Erd\H{o}s-R\'enyi, Barab\'asi-Albert, and geographical) with varying sizes or subjected to progressive edge removal or rewiring. The coincidence similarity index, which can implement particularly strict comparisons, is adopted for two main purposes: to quantify and visualize how the considered topological measurements respond to the considered network alterations and to represent hierarchically the relationships between the observed changes undergone by the considered topological measurements. Several results are reported and discussed, including the identification of three types of topological changes taking place as a consequence of the modifications. In addition, the changes observed for the Erd\H{o}s-R\'enyi and Barab\'asi-Albert networks resulted mutually more similarly affected by topological changes than for the geometrical networks. The latter type of network has been identified to have more heterogeneous topological features than the other two types of networks.
Figures


Figures from the paper (15 more)




Reference graph
Works this paper leans on
-
[1]
A.-L. Barab´ asi. Network science.Philosophical Transactions of the Royal Society A, 371(1987):20120375, 2013
work page 1987
-
[2]
M. Newman. Networks. Oxford University Press, 2018
2018
-
[3]
M. E. J. Newman. The structure and function of complex networks. SIAM Review, 45(2):167–256, 2003
2003
-
[4]
S. Boccaletti, V. Latora, Y. Moreno, M. Chavez, and D.-U. Hwang. Complex networks: Structure and dynamics. Physics Reports, 424(4- 5):175–308, 2006
work page 2006
-
[5]
L. da F. Costa, F. A. Rodrigues, G. Travieso, and P. R. Villas Boas. Characterization of complex networks: a survey of measurements. Ad- vances in Physics , 56(1):167–242, 2007
work page 2007
-
[6]
N. M. Luscombe, M. M. Babu, H. Yu, M. Snyder, S. A. Teichmann, and M. Gerstein. Genomic analysis of regulatory network dynamics reveals large topological changes. Nature, 431(7006):308–312, 2004. 33
work page 2004
-
[7]
L. da F. Costa. Reinforcing the resilience of complex networks. Physical Review E—Statistical, Nonlinear, and Soft Matter Physics , 69(6):066127, 2004
work page 2004
-
[8]
M. Latapy and C. Magnien. Complex network measurements: Estimat- ing the relevance of observed properties. In IEEE INFOCOM 2008- The 27th Conference on Computer Communications , pages 1660–1668. IEEE, 2008
work page 2008
Show all 64 references
-
[9]
L. M. A. Bettencourt, D. I. Kaiser, and J. Kaur. Scientific discovery and topological transitions in collaboration networks. Journal of Infor- metrics, 3(3):210–221, 2009
2009
-
[10]
Aerts, W
H. Aerts, W. Fias, K. Caeyenberghs, and D. Marinazzo. Brain networks under attack: robustness properties and the impact of lesions. Brain, 139(12):3063–3083, 2016
2016
-
[11]
Casali and H
Y. Casali and H. R. Heinimann. A topological analysis of growth in the zurich road network. Computers, Environment and Urban Systems , 75:244–253, 2019
2019
-
[12]
de Silva and M
E. de Silva and M. P. H. Stumpf. Complex networks and simple models in biology. Journal of the Royal Society Interface , 2(5):419–430, 2005
2005
-
[13]
R. M. May. Network structure and the biology of populations. Trends in Ecology & Evolution , 21(7):394–399, 2006
2006
-
[14]
Buchanan
M. Buchanan. Networks in cell biology . Cambridge University Press, 2010
2010
-
[15]
J. C. Reijneveld, S. C. Ponten, H. W. Berendse, and C. J. Stam. The application of graph theoretical analysis to complex networks in the brain. Clinical neurophysiology, 118(11):2317–2331, 2007
2007
-
[16]
Meunier, R
D. Meunier, R. Lambiotte, and E. T. Bullmore. Modular and hierarchi- cally modular organization of brain networks. Frontiers in neuroscience, 4:200, 2010
2010
-
[17]
F. A. Rodrigues, T. K. D. M. Peron, P. Ji, and J. Kurths. The kuramoto model in complex networks. Physics Reports, 610:1–98, 2016
2016
-
[18]
Jiang and C
B. Jiang and C. Claramunt. Topological analysis of urban street net- works. Environment and Planning B: Planning and design , 31(1):151– 162, 2004
2004
-
[19]
Crucitti, V
P. Crucitti, V. Latora, and S. Porta. Centrality in networks of urban streets. Chaos: an interdisciplinary journal of nonlinear science , 16(1), 2006
2006
-
[20]
L. M. A. Bettencourt. Introduction to urban science: evidence and theory of cities as complex systems . MIT Press, 2021. 34
2021
-
[21]
Zanin and F
M. Zanin and F. Lillo. Modelling the air transport with complex net- works: A short review. The European Physical Journal Special Topics , 215(1):5–21, 2013
2013
-
[22]
Lin and Y
J. Lin and Y. Ban. Complex network topology of transportation systems. Transport reviews, 33(6):658–685, 2013
2013
-
[23]
H. Soh, S. Lim, T. Zhang, X. Fu, G. K. K. Lee, T. G. G. Hung, P. Di, S. Prakasam, and L. Wong. Weighted complex network analysis of travel routes on the singapore public transportation system. Physica A: Sta- tistical Mechanics and its Applications , 389(24):5852–5863, 2010
2010
-
[24]
Bascompte
J. Bascompte. Networks in ecology. Basic and applied ecology, 8(6):485– 490, 2007
2007
-
[25]
S. R. Proulx, D. E. L. Promislow, and P. C. Phillips. Network thinking in ecology and evolution. Trends in ecology & evolution, 20(6):345–353, 2005
2005
-
[26]
Bogun´ a, R
M. Bogun´ a, R. Pastor-Satorras, and A. Vespignani. Cut-offs and finite size effects in scale-free networks. The European Physical Journal B , 38:205–209, 2004
2004
-
[27]
H. Hong, M. Ha, and H. Park. Finite-size scaling in complex networks. Physical review letters , 98(25):258701, 2007
2007
-
[28]
N Dorogovtsev, A
S. N Dorogovtsev, A. V Goltsev, and J. F. F. Mendes. Critical phenom- ena in complex networks. Reviews of Modern Physics , 80(4):1275–1335, 2008
2008
-
[29]
Erd˝ os and A
P. Erd˝ os and A. R´ enyi. On random graphs I.Publicationes Mathemat- icae Debrecen, 6:290–297, 1959
1959
-
[30]
Barab´ asi and R
A. Barab´ asi and R. Albert. Emergence of scaling in random networks. Science, 286(5439):509–512, 1999
1999
-
[31]
Benatti and L
A. Benatti and L. da F. Costa. Simple bundles of complex networks. arXiv preprint arXiv:2311.04133 , 2023
2023 arXiv
-
[32]
L. da F. Costa. Coincidence complex networks. Journal of Physics: complexity, 3(1):015012, 2022
2022
-
[33]
Benatti and L
A. Benatti and L. da F. Costa. Agglomerative clustering in uniform and proportional feature spaces. arXiv preprint arXiv:2407.08604 , 2024
2024 arXiv
-
[34]
L. M. Shekhtman, S. Shai, and S. Havlin. Resilience of networks formed of interdependent modular networks. New Journal of Physics , 17(12):123007, 2015
2015
-
[35]
J. Gao, B. Barzel, and A.-L. Barab´ asi. Universal resilience patterns in complex networks. Nature, 530(7590):307–312, 2016. 35
2016
-
[36]
Laishram, A
R. Laishram, A. E. Sariy¨ uce, T. Eliassi-Rad, A. Pinar, and S. Soundara- jan. Measuring and improving the core resilience of networks. In Pro- ceedings of the 2018 World Wide Web Conference , pages 609–618, 2018
2018
-
[37]
J. L. Guillaume and M. Latapy. Relevance of massively distributed ex- plorations of the internet topology: Simulation results. In Proceedings IEEE 24th Annual Joint Conference of the IEEE Computer and Com- munications Societies., volume 2, pages 1084–1094. IEEE, 2005
2005
-
[38]
Dall’Asta, I
L. Dall’Asta, I. Alvarez-Hamelin, A. Barrat, A. V´ azquez, and A. Vespig- nani. Statistical theory of internet exploration. Physical Review E—Statistical, Nonlinear, and Soft Matter Physics , 71(3):036135, 2005
2005
-
[39]
Mahadevan, D
P. Mahadevan, D. Krioukov, M. Fomenkov, X. Dimitropoulos, K. C. Claffy, and A. Vahdat. The internet as-level topology: three data sources and one definitive metric. ACM SIGCOMM Computer Communication Review, 36(1):17–26, 2006
2006
-
[40]
M. ´A. Serrano, A. Maguitman, M. Bogu˜ n´ a, S. Fortunato, and A. Vespig- nani. Decoding the structure of the www: A comparative analysis of web crawls. ACM Transactions on the Web (TWEB) , 1(2):10–es, 2007
2007
-
[41]
T. L. Frantz, M. Cataldo, and K. M. Carley. Robustness of central- ity measures under uncertainty: Examining the role of network topol- ogy. Computational and Mathematical Organization Theory, 15:303–328, 2009
2009
-
[42]
M. E. J. Newman. Clustering and preferential attachment in growing networks. Physical review E , 64(2):025102, 2001
2001
-
[43]
S. N. Dorogovtsev, J. F. F. Mendes, and A. N. Samukhin. Size- dependent degree distribution of a scale-free growing network. Physical Review E, 63(6):062101, 2001
2001
-
[44]
V´ azquez
A. V´ azquez. Growing network with local rules: Preferential attach- ment, clustering hierarchy, and degree correlations. Physical Review E , 67(5):056104, 2003
2003
-
[45]
P. R. Villas Boas, F. A. Rodrigues, G. Travieso, and L. da F. Costa. Sensitivity of complex networks measurements. Journal of Statistical Mechanics: Theory and Experiment , 2010(03):P03009, 2010
2010
-
[46]
Cs´ ardi, T
G. Cs´ ardi, T. Nepusz, V. Traag, S. Horv´ at, F. Zanini, D. Noom, and K. M¨ uller.igraph: Network Analysis and Visualization in R , 2024. R package version 2.0.3
2024
-
[47]
Csardi and T
G. Csardi and T. Nepusz. The igraph software package for complex network research. InterJournal, Complex Systems:1695, 2006
2006
-
[48]
Barab´ asi and R
A.-L. Barab´ asi and R. Albert. Emergence of scaling in random networks. Science, 286(5439):509–512, 1999. 36
1999
-
[49]
Riedinger, M
R. Riedinger, M. Habar, P. Oelhafen, and H. J. G¨ untherodt. About the delaunay-voronoi tesselation. Journal of Computational Physics , 74(1):61–72, 1988
1988
-
[50]
M. E. J. Newman. Ego-centered networks and the ripple effect. Social Networks, 25(1):83–95, 2003
2003
-
[51]
Trusina, S
A. Trusina, S. Maslov, P. Minnhagen, and K. Sneppen. Hierarchy mea- sures in complex networks.Physical Review Letters, 92(17):178702, 2004
2004
-
[52]
L. da F. Costa and F. N. Silva. Hierarchical characterization of complex networks. Journal of Statistical Physics , 125:841–872, 2006
2006
-
[53]
B. A. N. Traven¸ colo and L. da F. Costa. Accessibility in complex net- works. Physics Letters A , 373(1):89–95, 2008
2008
-
[54]
Benatti, F
A. Benatti, F. N. Silva, H. F. de Arruda, and L. da F. Costa. Complex networks accessibility and symmetry. https: //www.researchgate.net/publication/362875004_Complex_ Networks_Accessibility_and_Symmetry, 2022
2022
-
[55]
G. F. De Arruda, A. L. Barbieri, P. M. Rodriguez, F. A Rodrigues, Y. Moreno, and L. da F. Costa. Role of centrality for the identifica- tion of influential spreaders in complex networks. Physical Review E , 90(3):032812, 2014
2014
-
[56]
Benatti and L
A. Benatti and L. da F. Costa. Normalization in proportional feature spaces. https://www.researchgate.net/publication/383666067_ Normalization_in_Proportional_Feature_Spaces, 2024
2024
-
[57]
L. da F. Costa. Further generalizations of the Jaccard in- dex. https://www.researchgate.net/publication/355381945_ Further_Generalizations_of_the_Jaccard_Index, 2021
2021
-
[58]
L. da F. Costa. Multiset neurons. Physica A: Statistical Mechanics and its Applications, 609:128318, 2023
2023
-
[59]
Jaccard index, 2021
Wikipedia. Jaccard index, 2021. https://en.wikipedia.org/wiki/ Jaccard_index
2021
-
[60]
W. Wu, B. Li, L. Chen, C. Zhang, and S. Y. Philip. Improved consistent weighted sampling revisited. IEEE Transactions on Knowledge and Data Engineering, 31(12):2332–2345, 2018
2018
-
[61]
Rozinek and J
O. Rozinek and J. Mareˇ s. The duality of similarity and metric spaces. Applied Sciences, 11(4):1910, 2021
1910
-
[62]
M. K. Vijaymeena and K. Kavitha. A survey on similarity measures in text mining. Machine Learning and Applications: An International Journal, 3(2):19–28, 2016
2016
-
[63]
d’Ocagne
M. d’Ocagne. Coordonn´ ees Parall` eles et Axiales: M´ ethode de transfor- mation g´ eom´ etrique et proc´ ed´ e nouveau de calcul graphique d´ eduits de la consid´ eration des coordonn´ ees parall` elles. Gauthier-Villars, 1885. 37
-
[64]
B. A. N. Traven¸ colo, M. P. Viana, and L. da F. Costa. Border detection in complex networks. New Journal of Physics , 11(6):063019, 2009. 38
2009
Reviewed August 7, 2026 · model on record in the stance chip above.
Discussion (0). Sign in to comment.