REVIEW 4 major objections 6 minor 150 references
Beyond Leaders and Laggards: A Typology of Renewable Energy Adoption Trajectories with Evidence from Off-Grid Communities
T0 review · 4 major / 6 minor · reviewed 2026-08-07 · deepseek-v4-flash
Pith's one-line read A new index sorts every community into eight solar adoption paths and finds that retreat is common while leapfrogging is rare.
desk verdict A novel ATI metric and eight-path typology applied to a genuinely valuable off-grid PV dataset, but the headline 18% retreating share rests on six-point curve fitting that can manufacture the very patterns the paper claims to find. read the letter →
The pith
A machine-rendered reading of the paper's core claim, the machinery that carries it, and where it could break.
The reading
What carries the argument
The carrying object is the Adoption over Time Index (ATI), a scalar that combines the area under an entity's fitted adoption-intensity curve with a feedback adjustment for how long the entity strayed above or below the regional mean curve. ATI is built from intersections between the entity's best-fitting curve and the regional mean curve: the angle after each intersection sets the direction of the deviation, and the time between intersections sets its weight. The candidate curves are a set of commonly used cumulative diffusion shapes, polynomials, and a linear function, and the best fit is selected by maximum goodness of fit conditional on exceeding 0.9. ATI supplies the intensity axis of each profile; entry time, latest trajectory, and latest adoption intensity fill the other three axes, and a rule table maps every feasible combination to one of eight named paths.
What would settle it
Check the raw, un-fitted PV areas in 2020 and 2022 for clusters labeled decelerating or declining moderate; if most of them grew rather than stagnated or declined, the retreating paths are fitting artifacts rather than real behavior.
Extended reading notes
Core claim
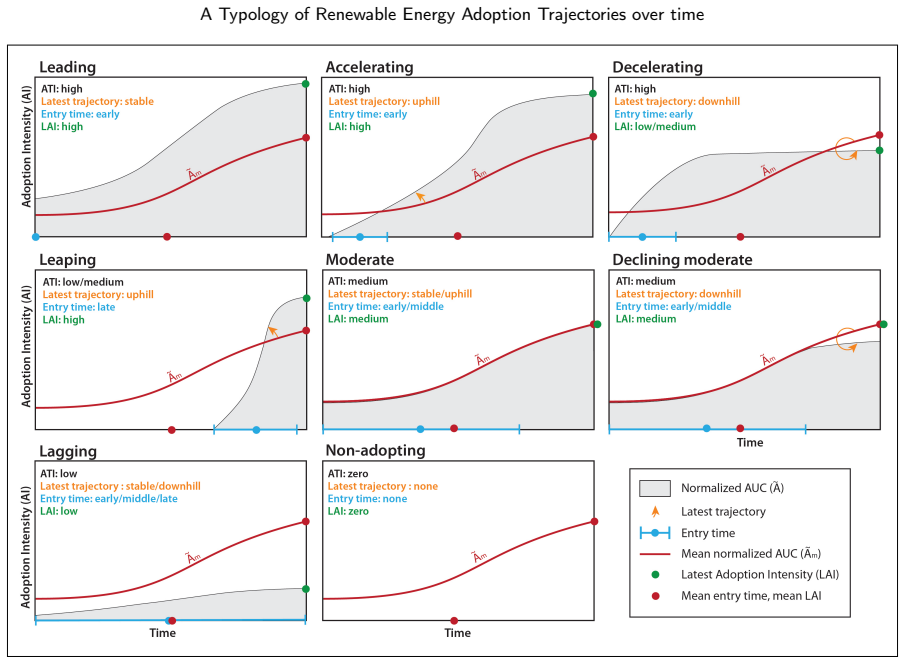
The paper's discovery is a formal way to see adoption dynamics as trajectories rather than milestones. Each entity's photovoltaic density over time is fitted with the best curve from a family that includes standard cumulative diffusion shapes, polynomials, and a linear form; the area under that curve, normalized to the regional mean, gives the base ATI. A feedback mechanism then penalizes entities whose high overall adoption was interrupted by periods below the regional mean, and rewards weak entities that temporarily rose above it, with adjustments proportional to how long the deviation lasted. The result is a typology of eight paths: leading, accelerating, decelerating, leaping, moderate, declining moderate, lagging, and non-adopting, where decelerating and declining moderate are newly identified. In the Bedouin case study, the retreating paths are substantial (18%), the leaping path is near-absent (2%), and lagging clusters dominate the region, so the paper concludes that a decade of access has not exhausted the region's adoption potential.
Load-bearing premise
The framework's load-bearing premise is that a curve fitted to only six yearly observations, chosen as best among many candidate shapes by a fit score above 0.9, faithfully represents each community's actual adoption trajectory, because overfitted curves would distort the area, crossing points, entry time, and final path label.
Editorial extensions
If this is right
- Retreating paths make up 18% of clusters, so adoption programs should monitor for deceleration and decline and intervene before backsliding entrenches.
- The near-absence of the leaping path (2%) suggests late, rapid catch-up is not a reliable default for marginalized off-grid populations.
- Separating leading from accelerating and lagging from non-adopting gives policymakers distinct targets: imitation hubs versus communities needing stronger engagement.
- One-third of clusters changed path between the two halves of the timeline, with downward shifts more abrupt than upward ones, implying early-warning systems may be feasible.
Reading between the lines
- The same four-feature pipeline could be exported to other technologies, regions, or time grids as long as at least six time points and a comparable entity-level intensity measure exist; path labels could then be compared across regions.
- If the finding that retreat is common holds elsewhere, diffusion models that assume monotonic saturation would need a regime-switching component that allows decline.
- A natural test is to link path labels to later behavior: do decelerating and declining-moderate clusters show measurable recovery after targeted interventions, and do leading clusters continue to lead?
- Path labels could also serve as a dependent variable in regressions on socioeconomic, spatial, or infrastructure factors to identify what drives each trajectory.
Editorial analysis
A structured set of objections, weighed in public.
Referee Report
Summary. The paper develops an analytical framework for classifying renewable-energy adoption trajectories of geographic entities. It introduces an Adoption over Time Index (ATI) based on the area under a fitted cumulative adoption-intensity curve, normalized by the regional mean and adjusted by a feedback mechanism using intersections with the regional mean curve. ATI is combined with entry time, latest adoption intensity (LAI), and a latest-trajectory variable to define eight adoption paths, including two new 'retreating' paths (decelerating and declining moderate) and a leaping path. The framework is applied to 1,192 off-grid Bedouin settlement clusters in southern Israel using PV areas digitized from six aerial images (2012–2022). The empirical results show that lagging is the most common path, retreating paths account for 18% of clusters, and leaping is rare (2%). The paper also analyzes transitions between paths across two halves of the timeline.
Significance. The paper addresses a real gap: most adoption typologies are static or rely on milestone-based features, and none systematically captures deceleration or decline in ongoing diffusion processes. The proposed ATI and the eight-path typology are conceptually clear and policy-relevant, and the case study is novel: a complete spatial census of small-scale PV adoption in an off-grid population. The authors are transparent about several limitations, such as the lack of causal modeling and the dependence on high-resolution data. However, the quantitative claims—especially the prevalence of retreating paths and the near-absence of leaping—rest on a curve-fitting procedure that is not robust for the available time-series length. If the authors can demonstrate that these findings are insensitive to model-selection choices and measurement error, the contribution would be substantial and would open a useful direction for comparative studies.
major comments (4)
- [Section 2.1.1, Table 1] The candidate curve set includes polynomial functions of degree d ∈ {2,...,T−1}, with T = 6, so a degree-5 polynomial can interpolate the six observed points exactly (R² = 1). Because the selection rule chooses the curve with the highest R² subject to R² > 0.9, it can systematically prefer interpolating, oscillatory curves. These curves can create spurious intersections with the regional mean curve and arbitrary end slopes, directly affecting ATI, the latest-trajectory variable, and ultimately every path assignment. The paper reports no complexity penalty, cross-validation, or sensitivity analysis over the curve family. This is not merely a technical detail: the headline shares (18% retreating, 2% leaping) are computed from features derived from these fitted curves. I request that the authors either restrict the polynomial degree (e.g., to ≤3), use a criterion that penalizes complexity (AIC/BIC), or demonstrate that the main findings are stable across a range of curve families and degrees.
- [Section 2.4.4] The entry-time threshold—20% of the regional mean adoption intensity—is selected from the same dataset by optimizing distributional properties (closest to normal skewness/kurtosis, highest SD, and 92% coverage). This is a free parameter chosen post hoc, and the resulting ordinal entry-time categories and path shares are sensitive to it. No independent theoretical justification or external benchmark is provided, and no sensitivity analysis is reported for the threshold. The choice directly affects which clusters are classified as early, middle, or late entrants, and thus the composition of all eight paths, including the novel retreating paths. Please add a sensitivity analysis over the threshold (e.g., 10%, 30%, 40%) and report how the distribution of paths changes.
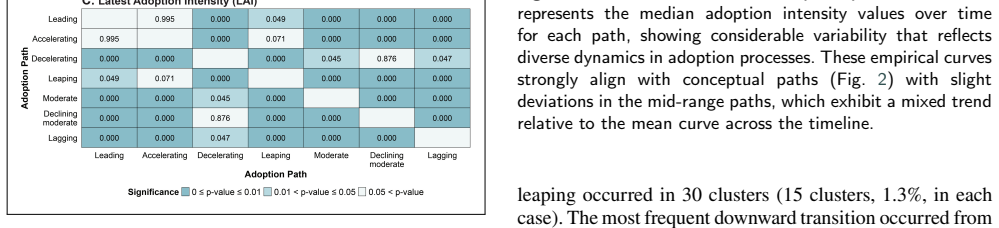
- [Section 3.3, Fig. 9] The alignment between the empirical median curves (Fig. 9) and the conceptual curves (Fig. 2) is presented as validation, but this is partly circular: the conceptual curves are defined by the same four features (ATI, entry time, latest trajectory, LAI) that are used to assign clusters to paths. By construction, the median curve of clusters assigned to, say, the 'decelerating' path will tend to display a plateau or decline because the path definition requires a downhill latest trajectory and medium/low LAI. The empirical alignment therefore does not provide independent evidence that the typology captures distinct underlying dynamics. To strengthen the contribution, the authors should validate against external criteria: for example, hold out the last time point and test whether path assignments predict subsequent adoption, or compare the spatial distribution of paths with independent socioeconomic or geographic variables.
- [Section 2.4.2, Section 3.3] The PV segmentation is reported to have an F1 score of 0.885, but this measurement error is not propagated into the features or the path classification. Since many clusters have very low PV density, even a small absolute error in PV area can swing the fitted curve, the entry time, and the latest trajectory. The paper should quantify the impact of segmentation errors—for example, by a Monte Carlo simulation that perturbs PV areas according to the reported precision matrix, or by a bootstrap resampling of the annotation process—and report the resulting uncertainty in the path shares. Without this, the empirical prevalence of the retreating paths (18%) cannot be distinguished from a measurement artifact.
minor comments (6)
- [Nomenclature / Eq. (5)] The definition of AI in Eq. (5) includes a scaling constant of 10^6, but the units are not stated (presumably m² of PV per m² of built-up area, then rescaled). Please state the units explicitly to make the results interpretable.
- [Section 2.1.1, Eq. (1)-(4)] The definition of the angle α_ij is given only in the nomenclature as 'Angle between C_i and C_m' and in the text as arctan of the difference of derivatives. Please state the formula in the main text (e.g., α_ij = arctan(C'_i(t_j) - C'_m(t_j))) to avoid ambiguity, especially since the sine of this angle drives the feedback mechanism.
- [References] References [76] and [117] appear to be the same work (Wang et al., 'More than innovativeness...', Renewable Energy 197 (2022) 552–563). Please consolidate to a single reference.
- [Figure 2] The conceptual illustration of adoption paths (Fig. 2) is informative, but the axes are not labeled. Adding axis labels (time and adoption intensity) would help readers compare the conceptual curves with the empirical curves in Fig. 9.
- [Section 3.3, paragraph 1] The sentence 'The moderate and declining moderate paths stand out, together comprising approximately one-third of the clusters; 13% of them exhibit stagnation or decline toward the end of the examined timeline' is unclear. The 13% appears to refer to declining moderate alone, but the wording could be read as a subset of the one-third. Please rephrase.
- [Section 4.4] The limitations section is candid about data resolution and temporal scope, but it does not mention the curve-fitting overfitting risk or the data-driven threshold selection. Adding these as limitations would be appropriate given their impact on the reported results.
Circularity Check
Typology validation is self-referential: paths are defined by the very same fitted features used to build their median curves, and the retreating-path shares inherit an unpenalized degree-5 polynomial fit to only six time points.
-
self definitional
[Section 2.3 (Table 2 and Fig. 2) and Section 3.3 (Fig. 9)]
"The paths are determined based on a set of criteria (Table 2) derived from ordinal categories of four key features: ATI, Entry time, Latest trajectory, and LAI. ... The data-driven curves in Fig. 9 show a strong alignment with the theoretical curves illustrated in Fig. 2. Thus, the implementation of an analytical framework indeed succeeds in distinguishing between adoption paths."
The 'theoretical' paths in Fig. 2 are defined entirely by Table 2 criteria on ATI, entry time, latest trajectory, and LAI. The 'data-driven' curves in Fig. 9 are medians of clusters grouped by exactly those same features, where all four features are computed from the same best-fitting curves described in Section 2.1.1. Therefore the strong alignment between the two sets of curves is a necessary result of the grouping rule, not independent empirical confirmation. The framework's success in 'distinguishing between adoption paths' is thus self-referential: the same feature values that assign clusters to paths are reused to verify that the path curves differ.
-
fitted input called prediction
[Sections 2.1.1, 2.1.4, and 3.3]
"polynomial functions of degree, d, where d∈{2,…,T−1} to provide flexibility and allow for potential declines in adoption trajectory... The best-fitting curve is selected based on the highest R² value, conditional on exceeding 0.9. ... Latest trajectory ... final slope direction of the entity's curve relative to the regional mean curve. ... Together with the Declining Moderate path, the retreating groups account for 18% of the clusters."
With T=6 time points (2012, 2015, 2017, 2020, 2021, 2022), degree-5 polynomials can interpolate the data exactly (R²=1), so the selection rule can systematically choose oscillating curves. A 'downhill' latest trajectory is then the slope after the last intersection of such an interpolating curve and can be an artifact of overfitting rather than an observed adoption dynamic. The 18% retreating share in Section 3.3, and the 21.6% downhill trajectories in Section 3.2, are computed from these same unpenalized fitted curves and data-tuned thresholds. The 'empirical' discovery of decelerating and declining moderate paths is therefore forced by the curve-fitting specification; no complexity penalty, cross-validation, or sensitivity analysis over the curve family is reported.
full rationale
The paper's PV measurements, descriptive statistics, and the construction of the ATI index itself retain independent content, and the self-citations (e.g., reference [110] for annotation accuracy) are not load-bearing for the typology's logical derivation. However, the central validation is circular. The eight adoption paths are defined by thresholds on four features that are all derived from the same best-fitting curves, so Fig. 9's alignment between 'data-driven' and 'theoretical' curves is guaranteed by the assignment mechanism rather than by independent evidence. The headline shares--18% retreating, 21.6% downhill, 2% leaping--are conditional on unpenalized degree-5 polynomial fits to six time points and on an entry-time threshold (20%) tuned to maximize normality and variance in the same data. No external benchmark, holdout validation, or model-selection penalty is reported, so the framework's 'success' is partly self-referential. This is partial circularity: the path typology is internally consistent, but its empirical confirmation reduces to the definitions and fitted curves that generated it.
Assumptions & free parameters
free parameters (4)
- Entry time threshold =
20% of regional mean
- R-squared threshold for curve selection =
0.9
- Ordinal category bandwidth =
±0.44σ
- Timeline midpoint for transitions =
2017
assumptions (6)
- domain assumption Built-up area is a valid proxy for population size within clusters.
- domain assumption The regional mean is an appropriate benchmark for comparing adoption dynamics.
- ad hoc to paper The ATI feedback mechanism quantifies adoption stability or volatility in a meaningful way.
- domain assumption A best-fitting curve with R-squared above 0.9 from the candidate family reliably represents adoption trajectories.
- ad hoc to paper Adoption paths can be ordered on an ordinal scale for transition analysis.
- domain assumption Rogers' adopter categorization thresholds apply to geographic entities.
invented entities (2)
-
Adoption over Time Index (ATI)
-
Adoption path typology (eight paths)
Cite this review
Pith. "Pith review of Beyond Leaders and Laggards: A Typology of Renewable Energy Adoption Trajectories with Evidence from Off-Grid Communities." pith.science (2026). https://pith.science/paper/V6XB3RUG
@misc{pith2026250522456,
  author       = {Pith},
  title        = {Pith review of: Beyond Leaders and Laggards: A Typology of Renewable Energy Adoption Trajectories with Evidence from Off-Grid Communities},
  year         = {2026},
  howpublished = {\url{https://pith.science/paper/V6XB3RUG}},
  note         = {Machine review of arXiv:2505.22456}
}
read the original abstract
Understanding the dynamics of renewable energy adoption is essential for designing strategies that accelerate its spread - an urgent priority for advancing climate goals and improving well-being, especially in off-grid regions facing energy poverty. This study introduces a time-series-based analytical framework that quantifies and classifies adoption behaviors of geographic entities within a region. A novel metric, the Adoption over Time Index (ATI), captures cumulative adoption intensity and identifies shifts in adoption trends, improving the ability to distinguish between fundamental adoption paths. By combining ATI with three key features found to be indicative of adoption dynamics, we define a typology of eight distinct paths, including two newly identified trajectories - the decelerating path and the declining moderate path. Applying this framework to a case study of an off-grid Bedouin population in southern Israel reveals that these retreating paths exist in substantial proportions. Identifying such trends is critical for addressing stagnation and preventing backsliding in the diffusion process. The leaping path, by contrast, was nearly absent. We also identify behavioral diversity within both front-runner and trailing groups. Differentiating among these groups can help tailor acceleration strategies. The analysis further reveals significant disparities in adoption levels across the region, with lagging clusters being widespread and overall adoption falling short of the region's potential.
Figures


Figures from the paper (8 more)




Reference graph
Works this paper leans on
-
[1]
I. R. E. Agency, Renewable energy statistics 2020, https://www.irena.org/Publications, 2020. IRENA, Abu Dhabi, ISBN: 978-92-9260-246-8
2020
-
[2]
I. E. Agency, Electricity 2025: Analysis and forecast to 2027, https://www.iea.org/, 2025. IEA, accessed: March 30, 2025
2025
-
[3]
Grubler, C
A. Grubler, C. Wilson, G. Nemet, Apples, oranges, and consistent comparisonsofthetemporaldynamicsofenergytransitions, Energy research & social science 22 (2016) 18–25
2016
-
[4]
B.K.Sovacool, Howlongwillittake?conceptualizingthetemporal dynamicsofenergytransitions, Energyresearch&socialscience13 (2016) 202–215
2016
-
[5]
Lamp, Sunspots that matter: the effect of weather on solar technology adoption, Environmental and Resource Economics 84 (2023) 1179–1219
S. Lamp, Sunspots that matter: the effect of weather on solar technology adoption, Environmental and Resource Economics 84 (2023) 1179–1219
2023
-
[6]
R. Best, P. J. Burke, Adoption of solar and wind energy: The roles of carbon pricing and aggregate policy support, Energy Policy 118 (2018) 404–417
2018
-
[7]
Balta-Ozkan, J
N. Balta-Ozkan, J. Yildirim, P. M. Connor, I. Truckell, P. Hart, Energytransitionatlocallevel:Analyzingtheroleofpeereffectsand socio-economicfactorsonuksolarphotovoltaicdeployment,Energy Policy 148 (2021) 112004
2021
-
[8]
Kosugi, Y
T. Kosugi, Y. Shimoda, T. Tashiro, Neighborhood influences on thediffusionofresidentialphotovoltaicsystemsinkyotocity,japan, Environmental Economics and Policy Studies 21 (2019) 477–505
2019
Show all 150 references
-
[9]
S. Dharshing, Household dynamics of technology adoption: A spatial econometric analysis of residential solar photovoltaic (pv) systems in germany, Energy research & social science 23 (2017) 113–124
2017
-
[10]
Graziano, K
M. Graziano, K. Gillingham, Spatial patterns of solar photovoltaic system adoption: the influence of neighbors and the built environ- ment, Journal of Economic Geography 15 (2015) 815–839
2015
-
[11]
Carattini, M
S. Carattini, M. Péclat, A. Baranzini, Social interactions and the adoption of solar PV: evidence from cultural borders, Grantham Research Institute on Climate Change and the Environment, 2018
2018
-
[12]
K. S. Wolske, P. C. Stern, T. Dietz, Explaining interest in adopting residentialsolarphotovoltaicsystemsintheunitedstates:Towardan integrationofbehavioraltheories, Energyresearch&socialscience 25 (2017) 134–151
2017
-
[13]
W. H. Organization, et al., Tracking SDG 7: The Energy Progress Report 2024, World Bank, Washington, DC, Abu Dhabi, UAE,
2024
-
[14]
Morcillo, M
J. Morcillo, M. Castaneda, M. Jímenez, S. Zapata, I. Dyner, A. J. Aristizabal, Assessingthespeed,extent,andimpactofthediffusion of solar pv, Energy Reports 8 (2022) 269–281
2022
-
[15]
Baldwin, S
E. Baldwin, S. Carley, S. Nicholson-Crotty, Why do countries emulate each others’ policies? a global study of renewable energy policy diffusion, World Development 120 (2019) 29–45
2019
-
[16]
J.Müller,E.Trutnevyte, Spatialprojectionsofsolarpvinstallations atsubnationallevel:Accuracytestingofregressionmodels, Applied Energy 265 (2020) 114747
2020
-
[17]
S.MacIntyre,M.McCord,P.Davis,J.McCord,A.Zacharopoulos,A spatialexaminationofsolarpvadoptersinnorthernireland, JFMPC (2021) 0071
2021
-
[18]
Bokányi, M
E. Bokányi, M. Novák, Á. Jakobi, B. Lengyel, Urban hierarchy and spatial diffusion over the innovation life cycle, Royal Society Open Science 9 (2022) 211038
2022
-
[19]
P. D. Rigo, G. M. Lunardi, J. C. M. Siluk, P. S. Schneider, F. M. do Nascimento, V. Thomasi, E. Funke, How explain on-grid pv systems diffusion? review and application in brazil, Renewable Energy 230 (2024) 120862
2024
-
[20]
Abbar, A
S. Abbar, A. Boumaiza, N. Mohandes, A. Sanfilippo, Modeling innovationdiffusionforrenewableenergytechnologiesincityneigh- borhoods, in: 2018 9th International Renewable Energy Congress (IREC), IEEE, 2018, pp. 1–6
2018
-
[21]
Lacey-Barnacle, R
M. Lacey-Barnacle, R. Robison, C. Foulds, Energy justice in the developing world: a review of theoretical frameworks, key research themes and policy implications, Energy for Sustainable Develop- ment 55 (2020) 122–138
2020
-
[22]
B.Batinge,J.K.Musango,A.C.Brent,Perpetuatingenergypoverty: Assessing roadmaps for universal energy access in unmet african electricity markets, Energy Research & Social Science 55 (2019) 1–13
2019
-
[23]
S.K.Saha, Empoweringruralsouthasia:Off-gridsolarpv,electric- ity accessibility, and sustainable agriculture, Applied Energy 359 (2025) 122137
2025
-
[24]
B. A. Bridge, D. Adhikari, M. Fontenla, Electricity, income, and quality of life, The Social Science Journal 53 (2016) 33–39
2016
-
[25]
S.R.Khandker,D.F.Barnes,H.A.Samad, Aretheenergypooralso income poor? evidence from india, Energy Policy 47 (2012) 1–12
2012
-
[26]
Pueyo, M
A. Pueyo, M. Maestre, Linking energy access, gender and poverty: A review of the literature on productive uses of energy, Energy Research & Social Science 53 (2019) 170–181
2019
-
[27]
UNEP,EmissionsGapReport2022:TheClosingWindow–Climate Crisis Calls for Rapid Transformation of Societies, United Nations Environment Programme, Nairobi, Kenya, 2022
2022
-
[28]
Kizilcec, P
V. Kizilcec, P. Parikh, I. Bisaga, Examining the journey of a pay- as-you-go solar home system customer: a case study of rwanda, Energies 14 (2021) 330
2021
-
[29]
last mile
M. S. Barry, A. Creti, Pay-as-you-go contracts for electricity access: Bridging the “last mile” gap? a case study in benin, Energy economics 90 (2020) 104843
2020
-
[30]
S. Hyun, F. Taghizadeh-Hesary, H. S. Shim, Modeling solar energy system demand using household-level data in myanmar, Economic Analysis and Policy 69 (2021) 629–639
2021
-
[31]
N. P. Simpson, C. J. Rabenold, M. Sowman, C. D. Shearing, Adoption rationales and effects of off-grid renewable energy access for african youth: A case study from tanzania, Renewable and Blushtein-Livnon et al.: Preprint submitted to Advances in Applied Energy Page 21 of 25 A ...
2021
-
[32]
A.Diallo,R.K.Moussa,Theeffectsofsolarhomesystemonwelfare in off-grid areas: Evidence from côte d’ivoire, Energy 194 (2020) 116835
2020
-
[33]
S.M.Aarakit,J.M.Ntayi,F.Wasswa,F.Buyinza,M.S.Adaramola, V. F. Ssennono, The role of financial inclusion in adoption of solar photovoltaic systems: a case of uganda, Renewable Energy 198 (2022) 984–998
2022
-
[34]
P.Young, Technologicalgrowthcurves:acompetitionofforecasting models, Technologicalforecastingandsocialchange44(1993)375– 389
1993
-
[35]
M. A. Schilling, M. Esmundo, Technology s-curves in renewable energyalternatives:Analysisandimplicationsfor industryandgov- ernment, Energy policy 37 (2009) 1767–1781
2009
-
[36]
M.Guidolin,C.Mortarino, Cross-countrydiffusionofphotovoltaic systems: modeling choices and forecasts for national adoption pat- terns, Technological forecasting and social change 77 (2010) 279– 296
2010
-
[37]
Ratcliff, K
R. Ratcliff, K. Doshi, Using the bass model to analyze the diffusion of innovations at the base of the pyramid, Business & society 55 (2016) 271–298
2016
-
[38]
Y.D.Marinakis, Forecastingtechnologydiffusionwiththerichards model, Technological Forecasting and Social Change 79 (2012) 172–179
2012
-
[39]
R.Gutiérrez,A.Nafidi,R.G.Sánchez, Forecastingtotalnatural-gas consumption in spain by using the stochastic gompertz innovation diffusion model, Applied Energy 80 (2005) 115–124
2005
-
[40]
Bento, C
N. Bento, C. Wilson, Measuring the duration of formative phases for energy technologies, Environmental Innovation and Societal Transitions 21 (2016) 95–112
2016
-
[41]
M. Gort, S. Klepper, Time paths in the diffusion of product innovations, The economic journal 92 (1982) 630–653
1982
-
[42]
Milliou, E
C. Milliou, E. Petrakis, Timing of technology adoption and product marketcompetition, InternationalJournalofIndustrialOrganization 29 (2011) 513–523
2011
-
[43]
E.Overby,S.Ransbotham, Howdoadopterstransitionbetweennew and incumbent channels?, MIS Quarterly 43 (2019) 185–A8
2019
-
[44]
Wilson, A
C. Wilson, A. Grubler, Lessons from the history of technological changeforcleanenergyscenariosandpolicies,in:NaturalResources Forum, volume 35, Wiley Online Library, 2011, pp. 165–184
2011
-
[45]
T.M.Lenton,S.Benson,T.Smith,T.Ewer,V.Lanel,E.Petykowski, T.W.Powell,J.F.Abrams,F.Blomsma,S.Sharpe, Operationalising positivetippingpointstowardsglobalsustainability, GlobalSustain- ability 5 (2022) e1
2022
-
[46]
A. D. Andersen, F. W. Geels, L. Coenen, J. Hanson, M. Korsnes, K. Linnerud, T. Makitie, A. Nordholm, M. Ryghaug, T. Skjolsvold, et al., Faster, broader, and deeper! suggested directions for research on net-zero transitions, Oxford Open Energy 2 (2023) oiad007
2023
-
[47]
A.F.Bate,E.W.Wachira,S.Danka, Thedeterminantsofinnovation performance: an income-based cross-country comparative analysis using the global innovation index (gii), Journal of Innovation and Entrepreneurship 12 (2023) 20
2023
-
[48]
Brutschin, A
E. Brutschin, A. Cherp, J. Jewell, Failing the formative phase: the global diffusion of nuclear power is limited by national markets, Energy Research & Social Science 80 (2021) 102221
2021
-
[49]
J.Qiu,W.Liu,N.Ning,Evolutionofregionalinnovationwithspatial knowledge spillovers: Convergence or divergence?, Networks and Spatial Economics 20 (2020) 179–208
2020
-
[50]
A. M. Bunea, P. Della Posta, M. Guidolin, P. Manfredi, What do adoption patterns of solar panels observed so far tell about govern- ments’ incentive? insights from diffusion models, Technological Forecasting and Social Change 160 (2020) 120240
2020
-
[51]
H. Duan, G. Zhang, S. Wang, Y. Fan, Peer interaction and learning: Cross-countrydiffusionofsolarphotovoltaictechnology, Journalof Business Research 89 (2018) 57–66
2018
-
[52]
P.Aghion,X.Jaravel, Knowledgespillovers,innovationandgrowth, The Economic Journal 125 (2015) 533–573
2015
-
[53]
M. W. Fong, Technology leapfrogging for developing countries, in: Encyclopedia of Information Science and Technology, Second Edition, IGI Global, 2009, pp. 3707–3713
2009
-
[54]
Lee, Economics of technological leapfrogging, SSRN, 2020
K. Lee, Economics of technological leapfrogging, SSRN, 2020
2020
-
[55]
C.Wilson,Meta-analysisofunitandindustrylevelscalingdynamics in energy technologies and climate change mitigation scenarios, JSTOR, 2009
2009
-
[56]
Wilson, Up-scaling, formative phases, and learning in the historicaldiffusionofenergytechnologies, EnergyPolicy50(2012) 81–94
C. Wilson, Up-scaling, formative phases, and learning in the historicaldiffusionofenergytechnologies, EnergyPolicy50(2012) 81–94
2012
-
[57]
Gosens, F
J. Gosens, F. Hedenus, B. A. Sandén, Faster market growth of wind and pv in late adopters due to global experience build-up, Energy 131 (2017) 267–278
2017
-
[58]
F.Azmat,W.M.Lim,A.Moyeen,R.Voola,G.Gupta, Convergence ofbusiness,innovation,andsustainabilityatthetippingpointofthe sustainable development goals, Journal of Business Research 167 (2023) 114170
2023
-
[59]
Milkoreit, J
M. Milkoreit, J. Hodbod, J. Baggio, K. Benessaiah, R. Calderón- Contreras, J. F. Donges, J.-D. Mathias, J. C. Rocha, M. Schoon, S.E.Werners, Definingtippingpointsforsocial-ecologicalsystems scholarship—an interdisciplinary literature review, Environmental Research Letters 13 (...
2018
-
[60]
Lockwood, Policy feedback and institutional context in energy transitions, Policy Sciences 55 (2022) 487–507
M. Lockwood, Policy feedback and institutional context in energy transitions, Policy Sciences 55 (2022) 487–507
2022
-
[61]
D.L.Edmondson,F.Kern,K.S.Rogge, Theco-evolutionofpolicy mixesandsocio-technicalsystems:towardsaconceptualframework ofpolicymixfeedbackinsustainabilitytransitions, ResearchPolicy 48 (2019) 103555
2019
-
[62]
F. W. Geels, M. Ayoub, A socio-technical transition perspective on positivetippingpointsinclimatechangemitigation:Analysingseven interacting feedback loops in offshore wind and electric vehicles acceleration, Technological Forecasting and Social Change 193 (2023) 122639
2023
-
[63]
M.Ayoub,F.W.Geels, Whathappensafterpositivetippingpoints? a socio-technical analysis of acceleration and deceleration in solar- pv diffusion in germany and the uk, Technological Forecasting & Social Change 207 (2024) 123642
2024
-
[64]
Griliches, Hybrid corn: An exploration in the economics of technological change, Econometrica 25 (1957) 501–522
Z. Griliches, Hybrid corn: An exploration in the economics of technological change, Econometrica 25 (1957) 501–522
1957
-
[65]
Grubler, The rise and fall of infrastructures: dynamics of evolu- tion and technological change in transport, Physica-Verlag, 1990
A. Grubler, The rise and fall of infrastructures: dynamics of evolu- tion and technological change in transport, Physica-Verlag, 1990
1990
-
[66]
Comin, M
D. Comin, M. Mestieri, If technology has arrived everywhere, why has income diverged?, American Economic Journal: Macroeco- nomics 10 (2018) 137–178
2018
-
[67]
J. Mi, C. Yao, X. Zhao, F. Li, Research on the diffusion mechanism of green technology innovation based on enterprise perception, Computational Economics 63 (2024) 1981–2010
2024
-
[68]
M. A. van Sluisveld, J. Harmsen, N. Bauer, D. L. McCollum, K.Riahi,M.Tavoni,D.P.vanVuuren,C.Wilson,B.vanderZwaan, Comparingfuturepatternsofenergysystemchangein2cscenarios with historically observed rates of change, Global Environmental Change 35 (2015) 436–449
2015
-
[69]
Grubler, Time for a change: On the patterns of diffusion of innovation, IEEE Engineering Management Review 25 (1997) 96– 105
A. Grubler, Time for a change: On the patterns of diffusion of innovation, IEEE Engineering Management Review 25 (1997) 96– 105
1997
-
[70]
Morcillo, S
F. Morcillo, S. Hanger-Kopp, E. Schmid, J. Wachsmuth, Assessing thespeed,extent,andimpactofthediffusionofsolarpv, Renewable and Sustainable Energy Reviews 158 (2022) 112128
2022
-
[71]
A.Cherp,V.Vinichenko,J.Tosun,J.A.Gordon,J.Jewell, National growth dynamics of wind and solar power compared to the growth requiredforglobalclimatetargets, NatureEnergy6(2021)742–754
2021
-
[72]
Zielonka, E
S. Zielonka, E. Trutnevyte, Probabilistic projections of granular energytechnologydiffusionatsubnationallevel, EnergyPolicy180 (2023) 113597
2023
-
[73]
Pfeiffer,P
B. Pfeiffer,P. Mulder, Explainingthe diffusion ofrenewable energy technology in developing countries, Energy Economics 40 (2013) 285–296. Blushtein-Livnon et al.: Preprint submitted to Advances in Applied Energy Page 22 of 25 A Typology of Renewable Energy Adoption Trajectorie...
2013
-
[74]
Subtil Lacerda, J
J. Subtil Lacerda, J. C. Van den Bergh, International diffusion of renewable energy innovations: Lessons from the lead markets for wind power in china, germany and usa, Energies 7 (2014) 8236– 8263
2014
-
[75]
Autant-Bernard, S
C. Autant-Bernard, S. Chalaye, F. Manca, R. Moreno, J. Suriñach, Measuring the adoption of innovation. a typology of eu countries based on the innovation survey, Innovation–The European Journal of Social Science Research 23 (2010) 199–222
2010
-
[76]
J. Wang, F. Liu, L. Li, J. Zhang, More than innovativeness: Com- paring residents’ motivations for participating renewable energy communities in different innovation segments, Renewable energy 197 (2022) 552–563
2022
-
[77]
C. E. Hoicka, M. Graziano, M. Willard-Stepan, Y. Zhao, Insights to accelerate place-based at scale renewable energy landscapes: An analytical framework to typify the emergence of renewable energy clusters along the energy value chain, Applied Energy 377 (2025) 124559
2025
-
[78]
Değerli, Ç
A. Değerli, Ç. Aytekin, B. Değerli, Analyzing information technol- ogy status and networked readiness index in context of diffusion of innovations theory, Procedia-Social and Behavioral Sciences 195 (2015) 1553–1562
2015
-
[79]
C.Franceschinis,M.Thiene,R.Scarpa,J.Rose,M.Moretto,R.Cav- alli, Adoptionofrenewableheatingsystems:Anempiricaltestofthe diffusion of innovation theory, Energy 125 (2017) 313–326
2017
-
[80]
Knill, S
C. Knill, S. Heichel, D. Arndt, Really a front-runner, really a straggler? of environmental leaders and laggards in the european unionandbeyond—aquantitativepolicyperspective, EnergyPolicy 48 (2012) 36–45
2012
-
[81]
V. Döme, A global-scale study on decision making in renewable energy policy: Internal and external factors driving the adoption of feed-in tariffs and renewable portfolio standards, Environmental Policy and Governance 34 (2023) 321–335
2023
-
[82]
Schulte, F
E. Schulte, F. Scheller, D. Sloot, T. Bruckner, A meta-analysis of residential pv adoption: the important role of perceived benefits, intentions and antecedents in solar energy acceptance, Energy Research & Social Science 84 (2022) 102339
2022
-
[83]
Islam, Household level innovation diffusion model of photo- voltaic (pv) solar cells from stated preference data, Energy policy 65 (2014) 340–350
T. Islam, Household level innovation diffusion model of photo- voltaic (pv) solar cells from stated preference data, Energy policy 65 (2014) 340–350
2014
-
[84]
Tarpani, C
E. Tarpani, C. Piselli, C. Fabiani, I. Pigliautile, E. J. Kingma, B. Pioppi, A. L. Pisello, Energy communities implementation in theeuropeanunion:casestudiesfrompioneerandlaggardcountries, Sustainability 14 (2022) 12528
2022
-
[85]
Andresen, S
S. Andresen, S. Agrawala, Leaders, pushers and laggards in the making of the climate regime, Global Environmental Change 12 (2002) 41–51
2002
-
[86]
Tobin, Leaders and laggards: Climate policy ambition in devel- oped states, Global Environmental Politics 17 (2017) 28–47
P. Tobin, Leaders and laggards: Climate policy ambition in devel- oped states, Global Environmental Politics 17 (2017) 28–47
2017
-
[87]
H. Lan, Z. Gou, B. C. and, Regional difference of residential solar panel diffusion in queensland, australia, Energy Sources, Part B: Economics, Planning, and Policy 15 (2020) 13–25
2020
-
[88]
Mahajan, E
V. Mahajan, E. Muller, R. K. Srivastava, Determination of adopter categoriesbyusinginnovationdiffusionmodels, JournalofMarket- ing Research 27 (1990) 37–50
1990
-
[89]
Massiani, A
J. Massiani, A. Gohs, The choice of bass model coefficients to fore- castdiffusionforinnovativeproducts:Anempiricalinvestigationfor newautomotivetechnologies, Researchintransportationeconomics 50 (2015) 17–28
2015
-
[90]
Ruokamo, M
E. Ruokamo, M. Laukkanen, S. Karhinen, M. Kopsakangas- Savolainen, R. Svento, Innovators, followers and laggards in home solar pv: Factors driving diffusion in finland, Energy Research & Social Science 102 (2023) 103183
2023
-
[91]
F. M. Bass, A new product growth for model consumer durables, Management science 15 (1969) 215–227
1969
-
[92]
R.Baptista,Thediffusionofprocessinnovations:Aselectivereview, Internationaljournaloftheeconomicsofbusiness6(1999)107–129
1999
-
[93]
J.Goldenberg,B.Libai,S.Solomon,N.Jan,D.Stauffer, Marketing percolation,PhysicaA:statisticalmechanicsanditsapplications284 (2000) 335–347
2000
-
[94]
A.Westbrook,D.Kester,T.S.Braver, Whatisthesubjectivecostof cognitive effort? load, trait, and aging effects revealed by economic preference, PloS one 8 (2013) e68210
2013
-
[95]
X. Yao, Z. Yu, W. Ma, J. Xiong, G. Yang, Quantifying threshold effects of physiological health benefits in greenspace exposure, Landscape and Urban Planning 241 (2024) 104917
2024
-
[96]
J.C.Pruessner,C.Kirschbaum,G.Meinlschmid,D.H.Hellhammer, Two formulas for computation of the area under the curve represent measures of total hormone concentration versus time-dependent change, Psychoneuroendocrinology 28 (2003) 916–931
2003
-
[97]
J. B. Dowd, A. M. Simanek, A. E. Aiello, Socio-economic status, cortisol and allostatic load: a review of the literature, International journal of epidemiology 38 (2009) 1297–1309
2009
-
[98]
R. V. Dudhani, J. D. Turnidge, R. L. Nation, J. Li, f auc/mic is the most predictive pharmacokinetic/pharmacodynamic index of colistin against acinetobacter baumannii in murine thigh and lung infection models, Journal of antimicrobial chemotherapy 65 (2010) 1984–1990
2010
-
[99]
A. J. Jackson, H. C. Foehl, A simulation study of the comparative performance of partial area under the curve (pauc) and partial area undertheeffectcurve(pauec)metricsincrossoverversusreplicated crossover bioequivalence studies for concerta and ritalin la, The AAPS Journal 24 ...
2022
-
[100]
A.Jentsch,P.White, Atheoryofpulsedynamicsanddisturbancein ecology, Ecology 100 (2019) e02734
2019
-
[101]
Y. Sun, N. Wang, An evaluation framework for industrial ecology based on the symbiosis theory-taking the𝜋-shaped curve area in the yellow river of china as an example, Ecological Indicators 154 (2023) 110468
2023
-
[102]
Barkai, E
E. Barkai, E. Aghion, D. A. Kessler, From the area under the bessel excursiontoanomalousdiffusionofcoldatoms, PhysicalReviewX 4 (2014) 021036
2014
-
[103]
A. M. Carrington, D. G. Manuel, P. W. Fieguth, T. Ramsay, V. Os- mani, B. Wernly, C. Bennett, S. Hawken, O. Magwood, Y. Sheikh, et al., Deep roc analysis and auc as balanced average accuracy, for improved classifier selection, audit and explanation, IEEE Transac- tions on Patt...
2022
-
[104]
Rogers, Diffusion of innovations, 5th edn tampa, FL: Free Press.[Google Scholar] (2003)
E. Rogers, Diffusion of innovations, 5th edn tampa, FL: Free Press.[Google Scholar] (2003)
2003
-
[105]
N.Teschner,H.Said,S.Shapira, Energypovertyandethnicdispari- tiesamongjewishandmuslimhouseholdsinisrael:Theimplications for welfare systems, Energy Research & Social Science 116 (2024) 103689
2024
-
[106]
S.Shapira,H.Shibli,N.Teschner,Energyinsecurityandcommunity resilience:Theexperiencesofbedouinsinsouthernisrael, Environ- mental Science & Policy 124 (2021) 135–143
2021
-
[107]
I. R. E. Agency, Off-grid Renewable Energy Highlights 2024, Technical Report, IRENA, 2024. URL: https://www.irena.org/Publications/2024/Dec/ Off-grid-Renewable-Energy-Statistics-2024
2024
-
[108]
Akter, K
S. Akter, K. Bagchi, Is off-grid residential solar power inclusive? solarpoweradoption,energypoverty,andsocialinequalityinindia, Energy Research & Social Science 82 (2021) 102314
2021
-
[109]
URL: https://he.wikipedia.org/wiki/%D7%9B%D7%A4%D7%A8_%D7%91%D7%9C% D7%AA%D7%99_%D7%9E%D7%95%D7%9B%D7%A8#/media/%D7%A7%D7%95%D7%91% D7%A5:Bedouens041.JPG
Neukoln, Unrecognized bedouin villages in israel, 2023. URL: https://he.wikipedia.org/wiki/%D7%9B%D7%A4%D7%A8_%D7%91%D7%9C% D7%AA%D7%99_%D7%9E%D7%95%D7%9B%D7%A8#/media/%D7%A7%D7%95%D7%91% D7%A5:Bedouens041.JPG
2023
-
[110]
R.Blushtein-Livnon,T.Svoray,M.Dorman, Performanceofhuman annotators in object detection and segmentation of remotely sensed data, IEEETransactionsonGeoscienceandRemoteSensing(2025)
2025
-
[111]
Söderholm, G
P. Söderholm, G. Klaassen, Wind power in europe: a simultaneous innovation–diffusionmodel,Environmentalandresourceeconomics 36 (2007) 163–190
2007
-
[112]
F.Dianat,V.Khodakarami,S.-H.Hosseini,H.Shakouri, Combining gametheoryconceptsandsystemdynamicsforevaluatingrenewable electricity development in fossil-fuel-rich countries in the middle Blushtein-Livnon et al.: Preprint submitted to Advances in Applied Energy Page 23 of 25 A Ty...
2022
-
[113]
A. A. Peralta, N. Balta-Ozkan, P. Longhurst, Spatio-temporal mod- ellingofsolarphotovoltaicadoption:Anintegratedneuralnetworks and agent-based modelling approach, Applied Energy 305 (2022) 117949
2022
-
[114]
B.T.Asheim,L.Coenen, Knowledgebasesandregionalinnovation systems: Comparing nordic clusters, Research policy 34 (2005) 1173–1190
2005
-
[115]
P.Cooke,M.Heidenreich,H.-J.Braczyk, Introduction:Regionalin- novationsystems–anevolutionaryapproach,in:Regionalinnovation systems, Routledge, 2024, pp. 1–18
2024
-
[116]
Hassink, A
R. Hassink, A. Isaksen, M. Trippl, Towards a comprehensive un- derstanding of new regional industrial path development, Regional Studies (2019)
2019
-
[117]
J. Wang, F. Liu, L. Li, J. Zhang, More than innovativeness: Com- paring residents’ motivations for participating renewable energy communities in different innovation segments, Renewable Energy 197 (2022) 552–563
2022
-
[118]
X. S. Yap, Y. Zhou, R. Lema, H. Schmitz, X. Fu, Towards transfor- mative leapfrogging: The nature of green windows of opportunity and the dynamics of catching up in the solar pv industry, World Development 151 (2022) 105745
2022
-
[119]
Levin, V
T. Levin, V. M. Thomas, Can developing countries leapfrog the centralized electrification paradigm?, Energy for Sustainable De- velopment 31 (2016) 97–107
2016
-
[120]
Vasseur, R
V. Vasseur, R. Kemp, J. C. J. M. Van den Bergh, A comparative analysis of photovoltaic technological innovation systems including international dimensions: The cases of japan and the netherlands, Research Policy 42 (2013) 1809–1824
2013
-
[121]
Jacobsson, V
S. Jacobsson, V. Lauber, The politics and policy of energy system transformation—explaining the german diffusion of renewable en- ergy technology, Energy Policy 34 (2006) 256–276
2006
-
[122]
S. A. Chowdhury, M. Mourshed, Off-grid electrification with solar home systems: An appraisal of the quality of components, Renewable energy 97 (2016) 585–598
2016
-
[123]
C.-f.Chen,J.Li,J.Shuai,H.Nelson,A.Walzem,J.Cheng, Linking social-psychological factors with policy expectation: Using local voices to understand solar pv poverty alleviation in wuhan, china, Energy Policy 151 (2021) 112160
2021
-
[124]
T. N. Do, P. J. Burke, K. G. Baldwin, C. T. Nguyen, Underlying drivers and barriers for solar photovoltaics diffusion: The case of vietnam, Energy Policy 144 (2020) 111561
2020
-
[125]
D.Rodríguez-Urrego,L.Rodríguez-Urrego, Photovoltaicenergyin colombia: Current status, inventory, policies and future prospects, Renewable and Sustainable Energy Reviews 92 (2018) 160–170
2018
-
[126]
T. B. Garlet, J. L. D. Ribeiro, F. de Souza Savian, J. C. M. Siluk, Paths and barriers to the diffusion of distributed generation of photovoltaic energy in southern brazil, Renewable and Sustainable Energy Reviews 111 (2019) 157–169
2019
-
[127]
Bénabou, J
R. Bénabou, J. Tirole, Incentives and prosocial behavior, American economic review 96 (2006) 1652–1678
2006
-
[128]
E. M. Rogers, Lessons for guidelines from the diffusion of inno- vations, The Joint Commission journal on quality improvement 21 (1995) 324–328
1995
-
[129]
Mundaca, M
L. Mundaca, M. Samahita, What drives home solar pv uptake? subsidies, peer effects and visibility in sweden, Energy Research & Social Science 60 (2020) 101319
2020
-
[130]
Baranzini, S
A. Baranzini, S. Carattini, M. Péclat, What drives social contagion in the adoption of solar photovoltaic technology, Technical Report, Grantham Research Institute on Climate Change and the Environ- ment, 2017
2017
-
[131]
M.Graziano,M.Fiaschetti,C.Atkinson-Palombo,Peereffectsinthe adoption of solar energy technologies in the united states: An urban case study, Energy Research & Social Science 48 (2019) 75–84
2019
-
[132]
E.M.Rogers,DiffusionofInnovations,FreePress,NewYork,1962
1962
-
[133]
A.Palm, Earlyadoptersandtheirmotives:Differencesbetweenear- lier and later adopters of residential solar photovoltaics, Renewable and Sustainable Energy Reviews 133 (2020) 110142
2020
-
[134]
D.Kahneman,A.Tversky, Prospecttheory:Ananalysisofdecision under risk, in: Handbook of the fundamentals of financial decision making: Part I, World Scientific, 2013, pp. 99–127
2013
-
[135]
S. R. Shakeel, H. Yousaf, M. Irfan, A. Rajala, Solar pv adoption at household level: Insights based on a systematic literature review, Energy Strategy Reviews 50 (2023) 101178
2023
-
[136]
Y. Shi, L. Ding, C. He, F. Zhang, Z. Zhang, Q. Dai, Do village leaders’engagement,socialinteractionandfinancialincentiveaffect residents’ solar pv adoption? an empirical study in rural china?, InternationalJournalofEnergySectorManagement16(2022)834– 855
2022
-
[137]
H.C.Curtius,S.L.Hille,C.Berger,U.J.J.Hahnel,R.Wüstenhagen, Shotgunorsnowballapproach?acceleratingthediffusionofrooftop solar photovoltaics through peer effects and social norms, Energy policy 118 (2018) 596–602
2018
-
[138]
R. S. O’Neil, D. C. Preziuso, K. K. Arkema, Y. Ko, N. Pevzner, K. Diamond, S. Gore, K. Morrice, C. D. Henderson, D. W. Powell, Renewable Energy Landscapes: Designing Place-Based Infrastruc- ture for Scale, Technical Report, Pacific Northwest National Labo- ratory (PNNL), Richl...
2022
-
[139]
D.Noll,C.Dawes,V.Rai,Solarcommunityorganizationsandactive peereffectsintheadoptionofresidentialpv,Energypolicy67(2014) 330–343
2014
-
[140]
T. Khan, S. N. Khanam, M. H. Rahman, S. M. Rahman, Determi- nants of microfinance facility for installing solar home system (shs) in rural bangladesh, Energy Policy 132 (2019) 299–308
2019
-
[141]
Montoya-Duque, S
L. Montoya-Duque, S. Arango-Aramburo, J. Arias-Gaviria, Sim- ulating the effect of the pay-as-you-go scheme for solar energy diffusionincolombianoff-gridregions, Energy244(2022)123197
2022
-
[142]
Yahel, A
H. Yahel, A. Abu-Ajaj, Tribalism, religion, and state in bedouin societyinthenegev:Betweenpreservationandchange, AMultidis- ciplinary Journal on National Security 24 (2021) 54–71
2021
-
[143]
Teschner, A
N. Teschner, A. Sinea, A. Vornicu, T. Abu-Hamed, M. Negev, Extreme energy poverty in the urban peripheries of romania and israel:Policy,planningandinfrastructure,EnergyResearch&Social Science 66 (2020) 101502
2020
-
[144]
F. Rao, Y. M. Tang, K. Y. Chau, W. Iqbal, M. Abbas, Assessment of energy poverty and key influencing factors in n11 countries, Sustainable Production and Consumption 30 (2022) 1–15
2022
-
[145]
URL: https://www.irena
International Renewable Energy Agency (IRENA), Renewable Capacity Highlights 2024, Technical Report, International Renewable Energy Agency, 2024. URL: https://www.irena. org/-/media/Files/IRENA/Agency/Publication/2024/Mar/IRENA_RE_ Capacity_Highlights_2024.pdf
2024
-
[146]
E. S. M. A. P. (ESMAP), GOGLA, Dalberg, Off-Grid Solar Market TrendsReport2024,TheWorldBank,Washington,DC,2024.URL: https://www.worldbank.org
2024
-
[147]
S. M. Aarakit, J. M. Ntayi, F. Wasswa, M. S. Adaramola, V. F. Ssennono, Adoption of solar photovoltaic systems in households: Evidence from uganda, Journal of Cleaner Production 329 (2021) 129619
2021
-
[148]
Hastie, Independence through leapfrogging: Energy transitions in eswatini, Geo: Geography and Environment 11 (2024) e00136
H. Hastie, Independence through leapfrogging: Energy transitions in eswatini, Geo: Geography and Environment 11 (2024) e00136
2024
-
[149]
Tetteh, N
N. Tetteh, N. Kebir, Determinants of rooftop solar pv adoption among urban households in ghana, Renewable Energy Focus 43 (2022) 317–328. Blushtein-Livnon et al.: Preprint submitted to Advances in Applied Energy Page 24 of 25 A Typology of Renewable Energy Adoption Trajectorie...
2022
-
[2024]
URL: https://www.irena.org/-/media/Files/IRENA/Agency/ Publication/2024/Jun/IRENA_Tracking_SDG7_energy_progress_2024. pdf
2024
Reviewed August 7, 2026 · model on record in the stance chip above.
Discussion (0). Sign in to comment.