REVIEW 3 major objections 5 minor 86 references
iTrace : Interactive Tracing of Cross-View Data Relationships
T0 review · 3 major / 5 minor · reviewed 2026-08-07 · deepseek-v4-flash
Pith's one-line read Making a user's focus a visible, movable object lets people trace cross-view data relationships with fewer errors and less time.
desk verdict A genuinely useful design-analysis paper whose user study is too confounded to support the effectiveness claim—but the authors are upfront about it. read the letter →
The pith
A machine-rendered reading of the paper's core claim, the machinery that carries it, and where it could break.
The reading
What carries the argument
The mechanism is the focus marker plus supportive foci: an externalized, first-class visualization object placed over a visual element, which the user can move manually or let follow the mouse, while iTrace computes the closest point on the relevant visual link using a linear-and-bidirectional search. Cross-view relationships are pre-computed with biclustering, following prior work, so iTrace knows which elements in other views are related and can attract copies of them along links using a magnet-and-dust metaphor, show supportive foci on all related links, and adjust link salience dynamically. This combination of visible focus, multi-link guidance, and progressive transparency is what carries the argument that tracing becomes less error-prone.
What would settle it
A controlled experiment with random assignment to iTrace versus a no-iTrace baseline, using the same datasets and tasks, would settle the claim: if the error-rate and completion-time differences shrink to noise or reverse, the central claim is false. A cheaper check is to re-analyze the existing logs while controlling for interaction skill or task order; if the effect disappears after adjustment, self-selection explains the result.
Extended reading notes
Core claim
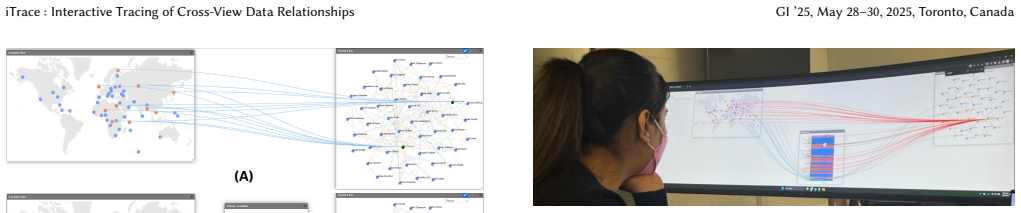
On its own terms, iTrace's central discovery is the interactive focus transition: a design concept in which a user's current focus, normally an internal mental state, is externalized as a focus marker, a semi-transparent copy over the element, and its related elements appear as moveable copies in other views. Users can drag the marker along visual links, and supportive white circles move along all other links from the same element to enable multi-directional tracing; the active link is highlighted in yellow, related links red, unrelated blue, with dynamic transparency reducing clutter. The paper argues that this supports three tracing types (individual, group, and cluster oriented) corresponding to one-to-one, one-to-many, and many-to-many cross-view relationships, and that the user study shows these interactions led to fewer errors, faster correct answers, a lower hover-to-click effort ratio, and user reports of scaling up tracing, verifying connections, and increased confidence.
Load-bearing premise
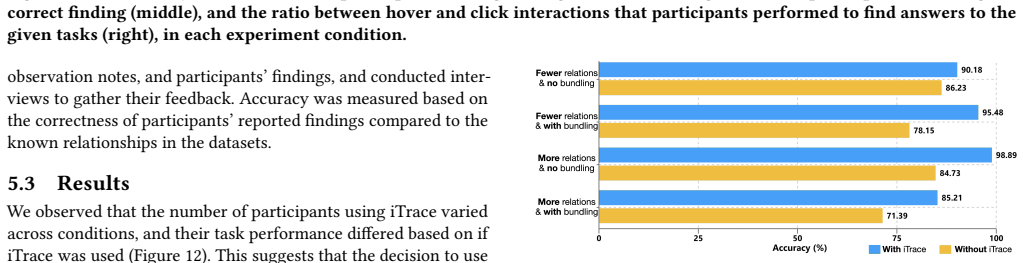
The measured performance gap (0.5 vs 1.7 errors; 9.0 vs 12.3 minutes) is caused by the iTrace technique and not by who chose to use it, since participants self-selected into iTrace and the groups were unequal.
Editorial extensions
If this is right
- Users can trace one-to-many and many-to-many relationships without losing the active path, because supportive foci track all related links simultaneously.
- The technique reduces reliance on observing transient highlight changes; the study's lower hover-to-click ratio with iTrace suggests effort shifts from monitoring updates to actively manipulating focus.
- iTrace's design complements rather than replaces visual links, brushing and linking, and bundling, so it can be layered onto existing multi-view systems.
- Manual link management lets users pin or dim connections, effectively bookmarking relationships for later verification or further exploration.
- The interaction pattern extends to node-link diagrams, line charts, parallel sets, and area graphs, where an on-screen focus could be dragged along edges or lines.
Reading between the lines
- A natural next step implied by the paper's own limitation is a randomized version of the study, assigning participants to iTrace instead of letting them self-select; the current self-selection confound leaves open that more careful users chose iTrace.
- The focus-marker concept could become a generic interaction primitive for any link-based visualization, making 'where the user is looking' a piece of explicit state that can be shared, logged, or synced across views.
- Dynamic transparency and supportive foci could be adapted for accessibility: making the active path salient by shape rather than by color alone, as the paper itself notes, could help color-blind users trace links.
- If direct manipulation of focus reduces hover-to-click effort, then logging focus-marker movements could serve as a low-cost behavioral measure of analytic confidence or uncertainty.
Editorial analysis
A structured set of objections, weighed in public.
Referee Report
Summary. The paper introduces iTrace, a visualization interaction technique for tracing cross-view data relationships through interactive focus transitions. It formalizes three tracing types, presents a design analysis contrasting context switching, enriching, and separating strategies, and implements a prototype with focus markers, supportive foci, dynamic transparency, and manual link management. A user study with 30 participants in a within-subjects, full-factorial design compares participants who used iTrace with those who did not, reporting fewer errors (0.5 vs 1.7) and shorter time to correct answers (9.0 vs 12.3 minutes), with significance tests. The paper concludes with generalization scenarios and limitations.
Significance. The design analysis and the interactive focus transition concept are a genuine contribution to the multi-view visualization literature, and the qualitative feedback provides useful insight into how users perceive such techniques. The ClosestPoint algorithm is clearly specified. However, the central quantitative claim of effectiveness is not supported by the reported study because the comparison is between self-selected user groups rather than between experimental conditions, and the statistical tests violate the independence assumption for repeated measures. If the effectiveness claim is not substantiated, the paper's main empirical contribution collapses, although the design rationale and qualitative insights could still stand as an exploratory design study.
major comments (3)
- [5.2, 5.3, 6.2] The central effectiveness claim rests on a comparison between participants who chose to use iTrace and those who did not, but all iTrace features were available in every condition. As the paper itself acknowledges in Section 6.2, participants' self-selection led to unequal group sizes and limits the ability to attribute performance differences to the tool. The reported error rate difference (0.5 vs 1.7) and time difference (9.0 vs 12.3 minutes) may reflect differences in motivation, skill, or strategy among those who opted in, rather than a causal effect of iTrace. This is a load-bearing flaw for the abstract's claim that the user study demonstrates effectiveness, and it cannot be fixed by a reanalysis of the current data alone.
- [5.3] The statistical tests are not appropriate for the study design. The Mann-Whitney U test for errors and the independent-samples t-test for time treat the 120 task observations as independent, but each of the 30 participants contributed four observations, one per condition. The reported degrees of freedom t(118) confirm this aggregation. Repeated observations from the same participant are correlated, so the independence assumption is violated and the p-values are likely anti-conservative. A mixed-effects model with participant as a random effect, or a participant-level analysis with appropriate paired tests, is required.
- [5.3] The self-selection analysis is also confounded with the manipulated task factors. The paper reports that iTrace usage increased with relationship count and with bundling, and these conditions may differ in difficulty. If more difficult conditions induce both higher iTrace usage and lower performance, the comparison between iTrace users and non-users could be biased in either direction. The analysis should include the two experimental factors (data complexity, representation complexity) as covariates and test for interactions between condition and iTrace usage, rather than pooling observations across all conditions.
minor comments (5)
- [4] The first sentence of Section 4 contains a typo: 'highligths' should be 'highlights'.
- [Figure 1] The caption for Figure 1(D) reads 'manual link management that to organize links' and should be reworded, for example as 'manual link management that allows users to organize links'.
- [4.2] Section 4.2 states that supportive foci support 'the context switching (S3) strategy,' but in Section 3.3, S3 is labeled 'context separating.' The design-strategy reference is inconsistent and should be corrected.
- [5.2, 5.3] The paper calls the design 'a full-factorial, within-subjects design,' but iTrace features are not a factor; the only manipulated factors are data complexity and representation complexity. Since iTrace was available in all conditions, the term 'full-factorial' may mislead readers about the presence of an iTrace on/off condition.
- [5.3] The hover-to-click ratio is reported descriptively as evidence of strategy shifts, but no statistical test or confidence interval is provided for this measure. It should either be analyzed formally or explicitly labeled as an exploratory observation.
Circularity Check
No significant circularity: the effectiveness claim rests on an empirical user study, and self-citations to prior biclustering work supply context rather than forcing the result.
full rationale
This paper is an empirical user study rather than a derivation, so most circularity patterns do not apply. No parameter is fitted to the outcome and then renamed as a prediction; the iTrace interaction features are implemented, deployed, and measured against hand-constructed ground-truth relationships. The reliance on the authors' prior SightBi work [67] for biclustering-based relationship computation and for the four-level relationship taxonomy is self-citation, but it is not load-bearing for the central claim: the user study generates its own known relationships via the external LCM algorithm ([71]) and defined individual-level links, and the observed accuracy/time advantages are empirical comparisons, not consequences of the cited taxonomy. The paper's own Section 6.2 limitation ('participants' self-selection to use iTrace during tasks led to unequal group sizes, limiting the ability to definitively attribute performance differences solely to the tool') acknowledges the main threat to the effectiveness claim; this is a confound and validity concern, not a circular reduction. Similarly, treating repeated observations from each participant as independent in the Mann-Whitney U and t-tests is a statistical weakness, not circularity. Accordingly, the circularity burden is low.
Assumptions & free parameters
free parameters (3)
- ClosestPoint initial step size =
8 (path length units)
- ClosestPoint termination threshold =
step < 0.5
- Dynamic transparency schedule =
50% at link midpoint, fading to more transparent
assumptions (4)
- domain assumption Cross-view data relationships are precomputed correctly via biclustering and chaining (SightBi).
- domain assumption Participants not using iTrace constitute an adequate baseline representing traditional multiple-view techniques.
- standard math Standard Euclidean distance and SVG path sampling correctly implement the closest-point search.
- domain assumption Selective attention limits users' ability to trace multiple visual links simultaneously.
Cite this review
Pith. "Pith review of iTrace : Interactive Tracing of Cross-View Data Relationships." pith.science (2026). https://pith.science/paper/CFPAO52J
@misc{pith2026250523079,
  author       = {Pith},
  title        = {Pith review of: iTrace : Interactive Tracing of Cross-View Data Relationships},
  year         = {2026},
  howpublished = {\url{https://pith.science/paper/CFPAO52J}},
  note         = {Machine review of arXiv:2505.23079}
}
read the original abstract
Exploring data relations across multiple views has been a common task in many domains such as bioinformatics, cybersecurity, and healthcare. To support this, various techniques (e.g., visual links and brushing and linking) are used to show related visual elements across views via lines and highlights. However, understanding the relations using these techniques, when many related elements are scattered, can be difficult due to spatial distance and complexity. To address this, we present iTrace, an interactive visualization technique to effectively trace cross-view data relationships. iTrace leverages the concept of interactive focus transitions, which allows users to see and directly manipulate their focus as they navigate between views. By directing the user's attention through smooth transitions between related elements, iTrace makes it easier to follow data relationships. We demonstrate the effectiveness of iTrace with a user study, and we conclude with a discussion of how iTrace can be broadly used to enhance data exploration in various types of visualizations.
Figures


Figures from the paper (9 more)




Reference graph
Works this paper leans on
-
[1]
Basak Alper, Nathalie Riche, Gonzalo Ramos, and Mary Czerwinski. 2011. De- sign study of linesets, a novel set visualization technique.IEEE Transactions on Visualization and Computer Graphics17, 12 (2011), 2259–2267. https: //doi.org/10.1109/TVCG.2011.186
-
[2]
Christopher Andrews, Alex Endert, and Chris North. 2010. Space to think: large high-resolution displays for sensemaking. InProc. of Conference on Human Factors in Computing Systems. 55–64. https://doi.org/10.1145/1753326.1753336
arXiv 2010
-
[3]
Gennady Andrienko, Natalia Andrienko, Wei Chen, Ross Maciejewski, and Ye Zhao. 2017. Visual analytics of mobility and transportation: State of the art and further research directions.IEEE Transactions on Intelligent Transportation Systems18, 8 (2017), 2232–2249. https://doi.org/10.1109/TITS.2017.2683539
-
[4]
Patrick Baudisch, Ed Cutrell, Daniel Robbins, Mary Czerwinski, Peter Tandler, Benjamin Bederson, and Alex Zierlinger. 2003. Drag-and-Pop and Drag-and-Pick: Techniques for Accessing Remote Screen Content on Touch- and Pen-Operated Systems. InHuman-Computer Interaction–INTERACT ’03. 57–64
2003
-
[6]
Ilya Boyandin, Enrico Bertini, Peter Bak, and Denis Lalanne. 2011. Flowstrates: An approach for visual exploration of temporal origin-destination data. InComputer Graphics Forum, Vol. 30. https://doi.org/10.1111/j.1467-8659.2011.01946.x
arXiv 2011
-
[7]
Steven Callahan, Juliana Freire, Emanuele Santos, Carlos Scheidegger, Cláudio Silva, and Huy Vo. 2006. VisTrails: visualization meets data management. In Proceedings of the ACM SIGMOD International Conference on Management of Data. 745–747. https://doi.org/10.1145/1142473.1142574
arXiv 2006
-
[8]
Daniel B Carr, Richard J Littlefield, WL Nicholson, and JS Littlefield. 1987. Scat- terplot matrix techniques for large N.Journal of American Statistical Association 82, 398 (1987), 424–436. https://doi.org/10.1080/01621459.1987.10478445
arXiv 1987
-
[10]
Siming Chen, Shuai Chen, Natalia Andrienko, Gennady Andrienko, Phong H Nguyen, Cagatay Turkay, Olivier Thonnard, and Xiaoru Yuan. 2018. User behavior map: Visual exploration for cyber security session data. InIEEE Symposium on Visualization for Cyber Security. https://doi.org/10.1109/VIZSEC.2018.8709223
Show all 86 references
-
[11]
Xin Chen, Jessica Self, Leanna House, John Wenskovitch, Maoyuan Sun, Nathan Wycoff, Jane Evia, and Chris North. 2017. Be the data: Embodied visual analytics. IEEE Tran. on Learning Technologies11, 1 (2017), 81–95. https://doi.org/10.1109/ TLT.2017.2757481
2017
-
[12]
Christopher Collins and Sheelagh Carpendale. 2007. VisLink: Revealing relation- ships amongst visualizations.IEEE Transactions on Visualization and Computer Graphics13, 6 (2007), 1192–1199. https://doi.org/10.1109/TVCG.2007.70521
2007
-
[13]
Christopher Collins, Gerald Penn, and Sheelagh Carpendale. 2009. Bubble sets: Revealing set relations with isocontours over existing visualizations.IEEE Transactions on Visualization and Computer Graphics15, 6 (2009), 1009–1016. https://doi.org/10.1109/TVCG.2009.122
2009 doi
-
[14]
Christopher Collins, Fernanda B Viegas, and Martin Wattenberg. 2009. Parallel tag clouds to explore and analyze faceted text corpora. InIEEE Sym. on Visual Analytics Science and Technology. 91–98. https://doi.org/10.1109/VAST.2009. 5333443
2009 doi
-
[15]
Gregorio Convertino, Jian Chen, Beth Yost, Y-S Ryu, and Chris North. 2003. Ex- ploring context switching and cognition in dual-view coordinated visualizations. InProceedings of International Conference on Coordinated and Multiple Views in Ex- ploratory Visualization. IEEE, 55–...
2003 arXiv
-
[16]
Thomas H Cormen, Charles E Leiserson, Ronald L Rivest, and Clifford Stein. 2022. Introduction to algorithms. MIT press
2022
-
[18]
Fan Du, Catherine Plaisant, Neil Spring, and Ben Shneiderman. 2016. EventAction: Visual analytics for temporal event sequence recommendation. InIEEE Conference on Visual Analytics Science and Technology. IEEE, 61–70. https://doi.org/10.1109/ VAST.2016.7883512
2016
-
[19]
Cody Dunne, Nathalie Henry Riche, Bongshin Lee, Ronald Metoyer, and George Robertson. 2012. GraphTrail: Analyzing large multivariate, heterogeneous net- works while supporting exploration history. InProc. of Conf. on Human Factors in Computing Systems. 1663–1672. https://doi.o...
2012
-
[20]
Alex Endert, Patrick Fiaux, and Chris North. 2012. Semantic interaction for visual text analytics. InProceedings of the SIGCHI conference on Human factors in computing systems. 473–482. https://doi.org/10.1145/2207676.2207741
2012
-
[21]
Patrick Fiaux, Maoyuan Sun, Lauren Bradel, Chris North, Naren Ramakrishnan, and Alex Endert. 2013. Bixplorer: Visual analytics with biclusters.Computer46, 8 (2013), 90–94. https://doi.org/10.1109/MC.2013.269
2013 doi
-
[22]
Thomas Geymayer, Markus Steinberger, Alexander Lex, Marc Streit, and Dieter Schmalstieg. 2014. Show me the invisible: visualizing hidden content. InProceed- ings of the SIGCHI Conference on Human Factors in Computing Systems. 3705–3714. https://doi.org/10.1145/2556288.2557032
2014
-
[23]
Samuel Gratzl, Nils Gehlenborg, Alexander Lex, Hanspeter Pfister, and Marc Streit
-
[24]
Samuel Gratzl, Alexander Lex, Nils Gehlenborg, Hanspeter Pfister, and Marc Streit. 2013. LineUp: Visual analysis of multi-attribute rankings.IEEE Trans. on Visualization & Comp. Graphics19, 12 (2013), 2277–2286. https://doi.org/10.1109/ TVCG.2013.173
2013
-
[25]
Shunan Guo, Ke Xu, Rongwen Zhao, David Gotz, Hongyuan Zha, and Nan Cao
-
[26]
K Wm Hall, Charles Perin, Peter G Kusalik, Carl Gutwin, and Sheelagh Carpendale
-
[27]
Susan Havre, Elizabeth Hetzler, Paul Whitney, and Lucy Nowell. 2002. The- meriver: Visualizing thematic changes in large document collections.IEEE Trans. on Vis. and Computer Graphics8, 1 (2002), 9–20. https://doi.org/10.1109/2945. 981848
2002 doi
-
[28]
Jeffrey Heer and George Robertson. 2007. Animated transitions in statistical data graphics.IEEE Transactions on Visualization and Computer Graphics13, 6 (2007), 1240–1247. https://doi.org/10.1109/TVCG.2007.70539
2007
-
[29]
Nathalie Henry, Jean-Daniel Fekete, and Michael J McGuffin. 2007. NodeTrix: a hybrid visualization of social networks.IEEE Transactions on Vis. and Computer Graphics13, 6 (2007), 1302–1309. https://doi.org/10.1109/TVCG.2007.70582
2007
-
[30]
Samuel Huron, Romain Vuillemot, and Jean-Daniel Fekete. 2013. Visual sedimen- tation.IEEE Transactions on Visualization and Computer Graphics19, 12 (2013), 2446–2455. https://doi.org/10.1109/TVCG.2013.227
2013 doi
-
[31]
Dong Hyun Jeong, Wenwen Dou, Heather Richter Lipford, Felesia Stukes, Remco Chang, and William Ribarsky. 2008. Evaluating the relationship between user interaction and financial visual analysis. InIEEE Symposium on Visual Analytics Science and Technology. IEEE, 83–90. https://...
2008
-
[32]
Shaoxiong Ji, Shirui Pan, Erik Cambria, Pekka Marttinen, and S Yu Philip. 2021. A survey on knowledge graphs: Representation, acquisition, and applications. IEEE Transactions on Neural Networks and Learning Systems33, 2 (2021), 494–514. https://doi.org/10.1109/TNNLS.2021.3070843
2021
-
[33]
Bharat Kale, Austin Clyde, Maoyuan Sun, Arvind Ramanathan, Rick Stevens, and Michael Papka. 2023. ChemoGraph: interactive visual exploration of the chemical space. InCom. Graphics Forum, Vol. 42. 13–24. https://doi.org/10.1111/cgf.14807
2023 doi
-
[34]
Bharat Kale, Maoyuan Sun, and Michael E Papka. 2023. The state of the art in visualizing dynamic multivariate networks. InComputer Graphics Forum, Vol. 42. Wiley Online Library, 471–490
2023
-
[35]
Nam Kim, Benjamin Bach, Hyejin Im, Sasha Schriber, Markus Gross, and Hanspeter Pfister. 2017. Visualizing nonlinear narratives with story curves. IEEE Trans. on Vis. and Computer Graphics24, 1 (2017), 595–604. https: //doi.org/10.1109/TVCG.2017.2744118
2017
-
[36]
Brittany Kondo and Christopher Collins. 2014. DimpVis: Exploring time-varying information visualizations by direct manipulation.IEEE Transactions on Visual- ization and Computer Graphics20, 12 (2014), 2003–2012. https://doi.org/10.1109/ TVCG.2014.2346250
2014
-
[37]
Robert Kosara, Fabian Bendix, and Helwig Hauser. 2006. Parallel sets: In- teractive exploration and visual analysis of categorical data.IEEE Transac- tions on Visualization and Computer Graphics12, 4 (2006), 558–568. https: //doi.org/10.1109/TVCG.2006.76
2006 doi
-
[38]
Philipp Koytek, Charles Perin, Jo Vermeulen, Elisabeth André, and Sheelagh Carpendale. 2017. Mybrush: Brushing and linking with personal agency.IEEE Transactions on Visualization and Computer Graphics24, 1 (2017), 605–615. https: //doi.org/10.1109/TVCG.2017.2743859
2017
-
[39]
Alexander Lex, Marc Streit, Ernst Kruijff, and Dieter Schmalstieg. 2010. Caleydo: Design and evaluation of a visual analysis framework for gene expression data in its biological context. InIEEE Pacific Visualization Symposium. IEEE, 57–64. https://doi.org/10.1109/PACIFICVIS.20...
2010
-
[40]
Shixia Liu, Yingcai Wu, Enxun Wei, Mengchen Liu, and Yang Liu. 2013. Storyflow: Tracking the evolution of stories.IEEE Transactions on Visualization and Computer Graphics19, 12 (2013), 2436–2445. https://doi.org/10.1109/TVCG.2013.196
2013 doi
-
[41]
Wouter Meulemans, Nathalie Riche, Bettina Speckmann, Basak Alper, and Tim Dwyer. 2013. Kelpfusion: A hybrid set visualization technique.IEEE Trans. on Vis. and Com. Graphics19, 11 (2013). https://doi.org/10.1109/TVCG.2013.76
2013 doi
-
[42]
Tomer Moscovich, Fanny Chevalier, Nathalie Henry, Emmanuel Pietriga, and Jean-Daniel Fekete. 2009. Topology-aware navigation in large networks. In iTrace : Interactive Tracing of Cross-View Data Relationships GI ’25, May 28–30, 2025, Toronto, Canada Proceedings of the SIGCHI C...
2009
-
[43]
2014.Visualization analysis and design
Tamara Munzner. 2014.Visualization analysis and design. CRC press
2014
-
[44]
Jakob Nielsen and Rolf Molich. 1990. Heuristic evaluation of user interfaces. In Proceedings of the SIGCHI Conference on Human Factors in Computing Systems. 249–256. https://doi.org/10.1145/97243.97281
1990
-
[45]
Chris North. 2006. Toward measuring visualization insight.IEEE Computer Graphics and Applications26, 3 (2006), 6–9. https://doi.org/10.1109/MCG.2006.70
2006 doi
-
[46]
1997.A taxonomy of multiple window coordi- nation
Chris North and Ben Shneiderman. 1997.A taxonomy of multiple window coordi- nation. Technical Report
1997
-
[47]
Charles Perin and Pierre Dragicevic. 2014. Manipulating multiple sliders by crossing. InProceedings of the 26th Conference on l’Interaction Homme-Machine. 48–54. https://doi.org/10.1145/2670444.2670449
2014
-
[48]
Charles Perin, Romain Vuillemot, and Jean-Daniel Fekete. 2013. SoccerStories: A kick-off for visual soccer analysis.IEEE Transactions on Vis. and Computer Graphics19, 12 (2013), 2506–2515. https://doi.org/10.1109/TVCG.2013.192
2013 doi
-
[50]
Peter Pirolli and Stuart Card. 2005. The sensemaking process and leverage points for analyst technology as identified through cognitive task analysis. In Proceedings of International Conference on Intelligence Analysis, Vol. 5. 1–6
2005
-
[51]
Arnaud Prouzeau, Antoine Lhuillier, Barrett Ens, Daniel Weiskopf, and Tim Dwyer. 2019. Visual link routing in immersive visualisations. InProceedings of the 2019 ACM International Conference on Interactive Surfaces and Spaces. 241–253. https://doi.org/10.1145/3343055.3359709
2019
-
[52]
Patrick Riehmann, Manfred Hanfler, and Bernd Froehlich. 2005. Interactive sankey diagrams. InIEEE Symposium on Information Visualization. IEEE, 233–240. https://doi.org/10.1109/INFVIS.2005.1532152
2005
-
[53]
Jonathan C Roberts. 2007. State of the art: Coordinated & multiple views in exploratory visualization. InProceedings of International Conference on Coor- dinated and Multiple Views in Exploratory Visualization. IEEE, 61–71. https: //doi.org/10.1109/CMV.2007.20
2007 doi
-
[54]
2020.Artificial intelligence: A modern approach, 4th edition
Stuart J Russell and Peter Norvig. 2020.Artificial intelligence: A modern approach, 4th edition. Pearson. 82 pages
2020
-
[55]
Jessica Zeitz Self, Michelle Dowling, John Wenskovitch, Ian Crandell, Ming Wang, Leanna House, Scotland Leman, and Chris North. 2018. Observation-level and parametric interaction for high-dimensional data analysis.ACM Transactions on Interactive Intelligent Systems8, 2 (2018),...
2018 doi
-
[56]
Abdul Rahman Shaikh, David Koop, Hamed Alhoori, and Maoyuan Sun. 2022. Toward systematic design considerations of organizing multiple views. InIEEE Vis. and Visual Analytics. 105–109. https://doi.org/10.1109/VIS54862.2022.00030
2022
-
[57]
Ben Shneiderman. 1996. The eyes have it: A task by data type taxonomy for information visualizations. InProceedings of IEEE Symposium on Visual Languages. IEEE, 336–343. https://doi.org/10.1109/VL.1996.545307
1996
-
[58]
Ji Soo Yi, Rachel Melton, John Stasko, and Julie A Jacko. 2005. Dust & magnet: multivariate information visualization using a magnet metaphor.Information Visualization4, 4 (2005), 239–256. https://doi.org/10.1057/palgrave.ivs.9500099
2005 doi
-
[59]
John Stasko, Carsten Gorg, Zhicheng Liu, and Kanupriya Singhal. 2007. Jig- saw: supporting investigative analysis through interactive visualization. In IEEE Symposium on Visual Analytics Science and Technology. IEEE, 131–138. https://doi.org/10.1109/VAST.2007.4389006
2007
-
[60]
Markus Steinberger, Manuela Waldner, Marc Streit, Alexander Lex, and Dieter Schmalstieg. 2011. Context-preserving visual links.IEEE Trans. on Visualization & Computer Graphics17, 12 (2011), 2249–2258. https://doi.org/10.1109/TVCG. 2011.183
2011 doi
-
[61]
Maoyuan Sun, Lauren Bradel, Chris L North, and Naren Ramakrishnan. 2014. The role of interactive biclusters in sensemaking. InProceedings of the SIGCHI Conference on Human Factors in Computing Systems. 1559–1562. https://doi.org/ 10.1145/2556288.2557337
2014
-
[62]
Maoyuan Sun and Gregorio Convertino. 2016. Interver: Drilling into categorical- numerical relationships. InProceedings of the International Working Conference on Advanced Visual Interfaces. 44–51. https://doi.org/10.1145/2909132.2909253
2016
-
[63]
Maoyuan Sun, David Koop, Jian Zhao, Chris North, and Naren Ramakrishnan
-
[64]
Maoyuan Sun, Peng Mi, Chris North, and Naren Ramakrishnan. 2015. Biset: Semantic edge bundling with biclusters for sensemaking.IEEE Trans. on Vis. & Computer Graphics22, 1 (2015), 310–319. https://doi.org/10.1109/TVCG.2015. 2467813
2015 doi
-
[65]
Maoyuan Sun, Akhil Namburi, David Koop, Jian Zhao, Tianyi Li, and Haeyong Chung. 2021. Towards systematic design considerations for visualizing cross-view data relationships.IEEE Transactions on Visualization and Computer Graphics28, 12 (2021), 4741–4756. https://doi.org/10.11...
2021
-
[66]
Maoyuan Sun, Chris North, and Naren Ramakrishnan. 2014. A five-level design framework for bicluster visualizations.IEEE Transactions on Vis. and Computer Graphics20, 12 (2014), 1713–1722. https://doi.org/10.1109/TVCG.2014.2346665
2014
-
[67]
Maoyuan Sun, Abdul Rahman Shaikh, Hamed Alhoori, and Jian Zhao. 2021. Sightbi: Exploring cross-view data relationships with biclusters.IEEE Transactions on Visualization and Computer Graphics28, 1 (2021), 54–64. https://doi.org/10. 1109/TVCG.2021.3114801
2021
-
[68]
Maoyuan Sun, Jian Zhao, Hao Wu, Kurt Luther, Chris North, and Naren Ra- makrishnan. 2018. The effect of edge bundling and seriation on sensemaking of biclusters in bipartite graphs.IEEE Transactions on Visualization and Computer Graphics25, 10 (2018), 2983–2998. https://doi.or...
2018
-
[69]
Christian Tominski. 2016. CompaRing: Reducing Costs of Visual Comparison. In EuroVis 2016, Enrico Bertini, Niklas Elmqvist, and Thomas Wischgoll (Eds.). The Eurographics Association. https://doi.org/10.2312/eurovisshort.20161175
2016 doi
-
[70]
Anne M Treisman. 1969. Strategies and models of selective attention.Psychologi- cal review76, 3 (1969), 282–299. https://doi.org/10.1037/h0027242
1969 doi
-
[71]
Takeaki Uno, Tatsuya Asai, Yuzo Uchida, and Hiroki Arimura. 2004. An efficient algorithm for enumerating closed patterns in transaction databases. InDiscovery Science. Springer, 16–31. https://doi.org/10.1007/978-3-540-30214-8_2
2004 doi
-
[72]
Stef van den Elzen, Danny Holten, Jorik Blaas, and Jarke J van Wijk. 2015. Re- ducing snapshots to points: A visual analytics approach to dynamic network exploration.IEEE Transactions on Visualization and Computer Graphics22, 1 (2015), 1–10. https://doi.org/10.1109/TVCG.2015.2468078
2015
-
[73]
Stef van den Elzen and Jarke J van Wijk. 2013. Small multiples, large singles: A new approach for visual data exploration. InComputer Graphics Forum, Vol. 32. 191–200. https://doi.org/10.1111/cgf.12106
2013 doi
-
[74]
Chris Weaver. 2004. Building highly-coordinated visualizations in improvise. In IEEE Symposium on Information Visualization. IEEE, 159–166. https://doi.org/10. 1109/INFVIS.2004.12
2004
-
[75]
Chris Weaver. 2009. Cross-filtered views for multidimensional visual analysis. IEEE Transactions on Visualization and Computer Graphics16, 2 (2009), 192–204. https://doi.org/10.1109/TVCG.2009.94
2009 doi
-
[76]
N. Wong, S. Carpendale, and S. Greenberg. 2003. Edgelens: an interactive method for managing edge congestion in graphs. InIEEE Symposium on Information Visualization 2003 (IEEE Cat. No.03TH8714). 51–58. https://doi.org/10.1109/ INFVIS.2003.1249008
2003 arXiv
-
[77]
Hao Wu, Maoyuan Sun, Peng Mi, Nikolaj Tatti, Chris North, and Naren Ra- makrishnan. 2018. Interactive discovery of coordinated relationship chains with maximum entropy models.ACM Transactions on Knowledge Discovery from Data 12, 1 (2018), 1–34. https://doi.org/10.1145/3047017
2018 doi
-
[78]
Yingcai Wu, Shixia Liu, Kai Yan, Mengchen Liu, and Fangzhao Wu. 2014. Opin- ionflow: Visual analysis of opinion diffusion on social media.IEEE Trans.on Vis. and Computer Graphics20, 12 (2014), 1763–1772. https://doi.org/10.1109/TVCG. 2014.2346920
2014
-
[79]
Yanhong Wu, Naveen Pitipornvivat, Jian Zhao, Sixiao Yang, Guowei Huang, and Huamin Qu. 2015. egoslider: Visual analysis of egocentric network evolution. IEEE Transactions on Visualization and Computer Graphics22, 1 (2015), 260–269. https://doi.org/10.1109/TVCG.2015.2468151
2015
-
[80]
Hao Zhang, Maoyuan Sun, Danfeng Yao, and Chris North. 2015. Visualizing traffic causality for analyzing network anomalies. InProc. of Inter. Workshop on Security & Privacy Analytics. 37–42. https://doi.org/10.1145/2713579.2713583
2015
-
[81]
Jian Zhao, Chidansh Bhatt, Matthew Cooper, and David A Shamma. 2018. Flexible learning with semantic visual exploration and sequence-based recommendation of MOOC videos. InProceedings of the 2018 CHI Conference on Human Factors in Computing Systems. 1–13. https://doi.org/10.11...
2018
-
[82]
Jian Zhao, Michael Glueck, Fanny Chevalier, Yanhong Wu, and Azam Khan
-
[83]
Jian Zhao, Zhicheng Liu, Mira Dontcheva, Aaron Hertzmann, and Alan Wilson
-
[84]
Jian Zhao, Maoyuan Sun, Francine Chen, and Patrick Chiu. 2017. BiDots: Visual exploration of weighted biclusters.IEEE Transactions on Visualization and Com- puter Graphics24, 1 (2017), 195–204. https://doi.org/10.1109/TVCG.2017.2744458
2017
-
[85]
Jian Zhao, Maoyuan Sun, Francine Chen, and Patrick Chiu. 2019. Missbin: Visual analysis of missing links in bipartite networks. InIEEE Visualization Conference. IEEE, 71–75. https://doi.org/10.1109/VISUAL.2019.8933639
2019
-
[87]
InProceedings of the ACM Conference on Human Factors in Computing Systems
Egocentric analysis of dynamic networks with egolines. InProceedings of the ACM Conference on Human Factors in Computing Systems. 5003–5014. https://doi.org/10.1145/2858036.2858488
-
[2015]
InProceedings of the ACM Conference on Human Factors in Computing Systems
Matrixwave: Visual comparison of event sequence data. InProceedings of the ACM Conference on Human Factors in Computing Systems. 259–268. https: //doi.org/10.1145/2702123.2702419
-
[2016]
InComputer Graphics Forum, Vol
Formalizing emphasis in information visualization. InComputer Graphics Forum, Vol. 35. Wiley Online Library, 717–737
-
[2017]
https://doi.org/10.1109/TVCG.2017.2745320
EventThread: Visual summarization and stage analysis of event sequence data.IEEE Transactions on Visualization and Computer Graphics24, 1 (2017), 56–65. https://doi.org/10.1109/TVCG.2017.2745320
2017
-
[2019]
In2019 IEEE Visual- ization Conference
Interactive bicluster aggregation in bipartite graphs. In2019 IEEE Visual- ization Conference. IEEE, 246–250. https://doi.org/10.1109/VISUAL.2019.8933546
2019
Reviewed August 7, 2026 · model on record in the stance chip above.
Discussion (0). Sign in to comment.