REVIEW 5 major objections 4 minor 1 cited by
Statistical Insights into Flux and Photon Index Distributions of VHE FSRQs from Fermi-LAT Observations
T0 review · 5 major / 4 minor · reviewed 2026-08-07 · deepseek-v4-flash
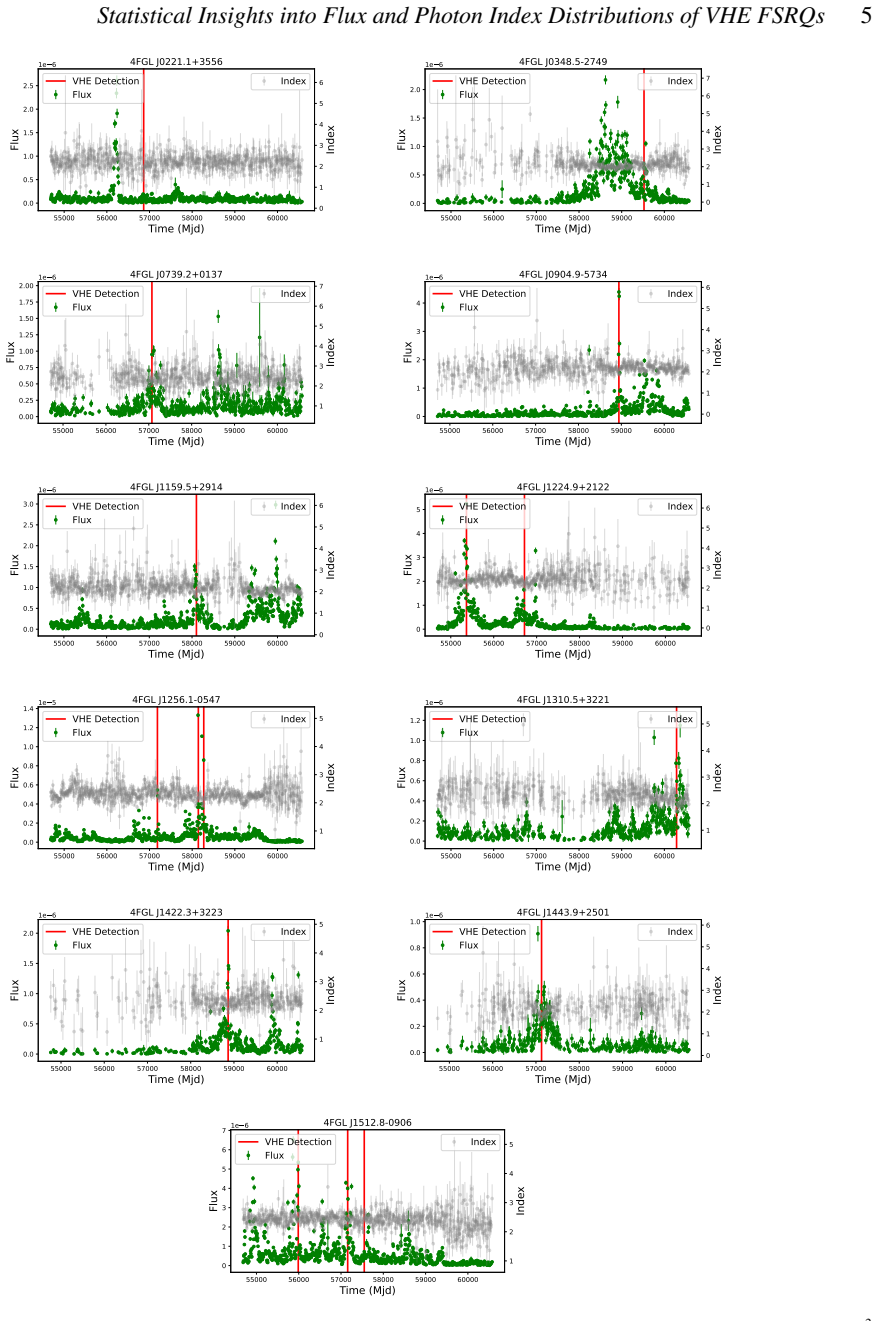
Pith's one-line read Over 16 years of Fermi-LAT data, the flux and photon index distributions of 11 very-high-energy flat-spectrum radio quasars show double lognormal profiles at 3-day and 7-day binning, evidence for two distinct gamma-ray emission states.
desk verdict A useful sample-level study of the 11 VHE FSRQs whose central double-lognormal claim lacks the statistical testing needed to support it; worth refereeing, but the analysis should be redone. read the letter →
The pith
A machine-rendered reading of the paper's core claim, the machinery that carries it, and where it could break.
The reading
What carries the argument
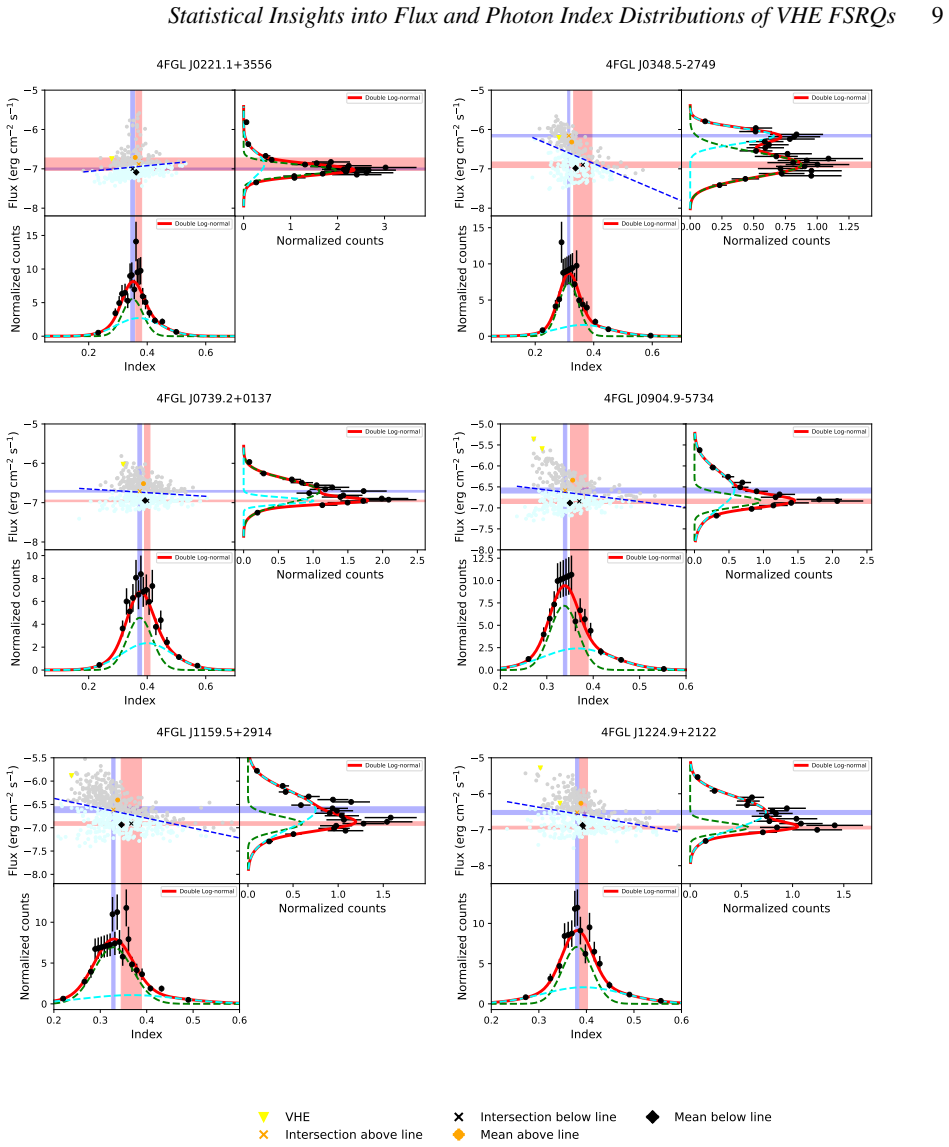
The central object is the double lognormal distribution $D(x) = \frac{a}{\sqrt{2\pi\sigma_1^2}} e^{-(x-\mu_1)^2/2\sigma_1^2} + \frac{1-a}{\sqrt{2\pi\sigma_2^2}} e^{-(x-\mu_2)^2/2\sigma_2^2}$ fitted to logarithmically binned histograms of flux and photon index, where the two components are interpreted as two emission states. Model selection is guided by Anderson-Darling normality tests and reduced chi-square values on histograms built with equal numbers of points per bin and variable bin widths, after applying cuts that keep only points with TS greater than 4 and value/error ratios above 2. This machinery turns each source's light curve into a statement about how many states exist: a single lognormal indicates one continuous process, while a double lognormal indicates two.
What would settle it
Generate synthetic light curves from a single lognormal distribution with the same power spectrum as the real sources, apply the same TS and value/error cuts and the same equal-points-per-bin histogram construction, and fit both single and double lognormal models; if the double lognormal is preferred at a comparable rate in the synthetic data, the two-flux-state evidence evaporates.
Extended reading notes
Core claim
The paper's central claim is that the gamma-ray flux and photon index distributions of VHE FSRQs are double lognormal in fine time binnings, primarily the 3-day and 7-day bins, and that this two-component structure fades or vanishes at 30-day binning. This double lognormal profile is interpreted as support for the 'two-flux-state hypothesis' for blazars, meaning each source exhibits distinct low and high flux states rather than a continuum of variability. The centroid intersection analysis of the two lognormal components shows that the lower flux component tracks photon index variations, while the higher flux component involves both index and normalization fluctuations. For nine of the eleven sources the spectral index hardens with increasing flux (harder-when-brighter), and for two sources it softens (softer-when-brighter). The Spearman rank correlation between flux and photon index strengthens with larger time bins, which the paper attributes to the averaging out of normalization variations. A comparison with non-VHE FSRQs finds that 99 of them also show double lognormal distributions in the 3-day binning, while VHE FSRQs show slightly harder spectra and differing dispersion properties in the two components.
Load-bearing premise
The double-peaked shape of the histograms is real and not an artifact of the variable-width, equal-count binning and the cuts that remove low-significance points; the paper does not formally compare the double lognormal fit against a single lognormal with an information criterion.
Editorial extensions
If this is right
- If the double lognormal structure is genuine, each VHE FSRQ spends time in two statistically distinct gamma-ray states, so single-state variability models for these objects would need revision.
- The disappearance of the double profile at 30-day binning means week-scale binning is the right observational cadence to resolve the two states; month-long averages erase them.
- The harder-when-brighter behavior in nine sources links the high-flux state to fast particle acceleration, while the two softer-when-brighter sources point to strong external radiation fields causing enhanced cooling.
- The strengthening flux-index correlation with bin size implies that short-timescale flux changes are dominated by normalization (e.g., Doppler factor) changes, with spectral index changes averaging out over longer times.
- The 99 non-VHE FSRQs with double lognormal distributions in 3-day bins suggest two-state behavior is common across the FSRQ class, with VHE sources distinguished mainly by harder spectra and different variability in the two components.
Reading between the lines
- A direct test of the two-state interpretation would be to simulate light curves from a single lognormal process with realistic red noise and run them through the same equal-points-per-bin histograms; if double lognormal fits appear at a similar rate, the claimed two states would be a statistical artifact.
- The hard/soft state interpretation could be pushed further: if the two flux components really are distinct physical states, their centroid flux ratio should correlate with source redshift or external photon field strength, a pattern that multiwavelength samples could check.
- The 99 non-VHE FSRQs with double lognormal distributions imply that the two-flux-state phenomenon is not a special property of VHE emitters; VHE selection may simply favor sources whose high state reaches hard spectra, which would make the two states a jet property rather than a VHE property.
Editorial analysis
A structured set of objections, weighed in public.
Referee Report
Summary. This paper analyzes Fermi-LAT light curves from the Light Curve Repository for 11 very high energy flat-spectrum radio quasars, using 3-day, 7-day, and 30-day binnings. The authors apply quality cuts (TS>4 and value/error>2), build histograms with equal numbers of points per variable-width bin, fit normal, lognormal, and double-lognormal functions to the log flux and log photon index distributions, and report reduced chi-squared and Anderson-Darling statistics for the selected models. They also compute Spearman correlations between flux and photon index, compare VHE and non-VHE FSRQ fit parameters, and interpret double-lognormal profiles in the finer binnings as supporting the two-flux-state hypothesis, with most sources harder-when-brighter and two sources softer-when-brighter.
Significance. If the central statistical claim were established, this would be a useful systematic characterization of all 11 known VHE FSRQs and would extend the two-flux-state hypothesis to this rare class using over 16 years of public Fermi-LAT data. The paper has clear strengths: a complete VHE FSRQ sample, transparent tabulation of fitted parameters in Tables 1 and 2, explicit p-values for the Spearman correlations in Table 3, and an openly available data source. However, the double-lognormal claim is not actually tested against the single-lognormal null, so the significance of the paper is conditional on missing statistical validation that is within the scope of the manuscript.
major comments (5)
- [Section 4.1.1, Tables 1 and 2] The choice of a double lognormal over a single lognormal is said to be based on the Anderson-Darling test and reduced chi-squared, but no formal model comparison is reported. A reduced chi-squared near unity for the selected model only shows that the chosen model is not grossly inconsistent with the binned data; it does not show that the extra three parameters in Eq. (3) are warranted. For example, the 3-day flux fit for 4FGL J1310.5+3221 has reduced chi-squared 0.877, yet the single-lognormal fit for the same source and bin is not presented. Please provide likelihood-ratio tests, information criteria, or null-hypothesis simulations for each source and bin, with p-values or delta criteria, so that the abstract's claim of 'double lognormal profiles' is actually supported by the statistics.
- [Section 4.1.1, data refinement] The cuts TS<4 and value/error>2 preferentially remove low-significance, typically low-flux measurements, truncating the left tail of the flux distribution. Because a truncated single lognormal can be approximated by a two-component mixture, the double profiles reported for the 3-day and 7-day bins could be an artifact of the cuts plus the histogram fitting. Please test robustness by varying the cut thresholds, fitting the unbinned data with a censored likelihood under the single-lognormal null, and checking whether the same double profiles emerge; also report how many points are removed per source and per bin.
- [Section 4.1.1, histogram construction] The histograms are built with an equal number of points per bin and variable bin widths to avoid empty bins. This produces bin counts with unequal Poisson errors and with correlations between neighboring bins once points are sorted by value, and the reduced chi-squared and Anderson-Darling statistics in Tables 1-2 do not account for either feature. Please validate the fitting procedure with simulations: generate data from a single lognormal with the same sample sizes, apply the same cuts and equal-count binning, fit both models, and show that the double-lognormal detection rate under the null is at the nominal level. Without such a check, the apparent bimodality cannot be attributed to the underlying source distribution rather than the pipeline.
- [Section 4.1.3, Table 3] The claim that the Spearman rank correlation strengthens with increasing time bin size is not supported by a significance test on the difference between correlations across bins. Several entries do not show monotonic strengthening, such as 4FGL J0221.1+3556 (0.28, 0.24, 0.34) and 4FGL J1443.9+2501 (-0.10, -0.27, -0.05, with 3-day p=0.118 and 30-day p=0.635). Please add a test for differences between correlated correlation coefficients or bootstrap confidence intervals, and restrict the claim to sources where the trend is significant.
- [Section 4.1.4, Figure 5] The VHE versus non-VHE FSRQ comparison reports tendencies such as 'slightly harder spectra' and 'lower index dispersions' without significance tests or uncertainties on the differences. Because the 99 non-VHE sources are used as a comparison population, please provide a two-sample test or bootstrap confidence intervals for the differences in the parameters shown in Figure 5; otherwise these conclusions are based on visual inspection of overlapping points.
minor comments (4)
- [Section 4.1.3] The 'two-flux-state hypothesis' is invoked without a formal definition; please state the model prediction being tested, such as two distinct lognormal components with separable centroids, before fitting.
- [Tables 1 and 2] The Anderson-Darling statistic is reported without its p-value or critical value; please add these or explicitly state the selection threshold used to distinguish normal, lognormal, and double-lognormal fits.
- [Section 4.1.4 and Figure 5] There is a typo in the text near 'the mean flux (μ1-Fux and μ2-Flux)' where 'Fux' should be 'Flux'; the same type of error appears in the axis labels of Figure 5.
- [Equations (1)-(3)] The typesetting of the normalizing coefficients appears to be missing division signs in the compiled text; please ensure the fractions are rendered correctly so that the normal and double-lognormal densities are unambiguous.
Circularity Check
No circularity: the double-lognormal fits are derived from public Fermi-LAT data and the two-flux-state interpretation is applied post hoc, not used as an input.
full rationale
The paper performs an empirical distribution-fitting analysis of Fermi-LAT light-curve data from the public LCR. It defines three functional forms (normal, log-normal, double log-normal) in Eqs. (1)-(3) and fits them to flux and photon-index histograms with free parameters. There is no derivation chain in which an output is reused as an input, and there are no predictions that reduce to earlier fits. The central observation, that double log-normal profiles appear in 3-day and 7-day binnings, comes directly from the histograms and fits. The 'two-flux-state hypothesis' is cited from prior literature (including papers by overlapping authors) and used only as an interpretive label; the paper's own fits are not conditioned on that hypothesis. No fitted parameter is renamed as a prediction, no uniqueness theorem is imported, and no ansatz is smuggled via citation. The authors' self-citations to earlier blazar variability studies are contextual and not load-bearing; removing them would not alter the data analysis or the fitted distributions. The absence of a formal comparison between single and double log-normal models is a statistical robustness concern, not a circularity, and does not affect the circularity score.
Assumptions & free parameters
free parameters (4)
- Single lognormal fit parameters (mu, sigma) for flux and index histograms =
various values in Tables 1-2
- Double lognormal fit parameters (a, mu1, sigma1, mu2, sigma2) =
various values in Tables 1-2
- Histogram binning rule (equal number of points per bin) =
not stated
- Data quality cut thresholds =
TS>=4; value/error>=2
assumptions (3)
- domain assumption The Fermi-LAT Light Curve Repository flux and photon index measurements are accurate and the 4FGL-DR2 source associations are correct.
- domain assumption Anderson-Darling test and reduced chi-square are valid model selection criteria for the equal-population histograms.
- ad hoc to paper The data cuts (TS<4, value/error>2) do not substantially alter the shape of the flux and index distributions.
Cite this review
Pith. "Pith review of Statistical Insights into Flux and Photon Index Distributions of VHE FSRQs from Fermi-LAT Observations." pith.science (2026). https://pith.science/paper/3JSS5HS3
@misc{pith2026250523338,
  author       = {Pith},
  title        = {Pith review of: Statistical Insights into Flux and Photon Index Distributions of VHE FSRQs from Fermi-LAT Observations},
  year         = {2026},
  howpublished = {\url{https://pith.science/paper/3JSS5HS3}},
  note         = {Machine review of arXiv:2505.23338}
}
abstract
This study examines the flux and photon index distributions of 11 Very High Energy (VHE) Flat Spectrum Radio Quasars (FSRQs) using over 16 years of Fermi-LAT $\gamma$-ray data. The distributions reveal double lognormal profiles in both flux and index, primarily in the 3-day and 7-day binnings, supporting the ``two-flux-state hypothesis" for blazars. These profiles, which become insignificant at 30-day binning, suggest that shorter timescales are better at capturing distinct states, while longer timescales smooth out shorter variations. Most VHE FSRQs exhibit a ``harder-when-brighter" trend, where the photon index decreases during high-flux states, suggesting efficient particle acceleration and possibly reduced radiative cooling. In contrast, two sources display a ``softer-when-brighter" behavior, likely due to enhanced radiative cooling in high photon density environments. Additionally, we observe that the Spearman rank correlation between flux and photon index strengthens with increasing time bin sizes, indicating more pronounced correlations over longer timescales. This possibly indicates that, on shorter timescales, flux variations are driven by a combination of photon index changes and normalization effects. Averaging flux over longer durations minimizes the effect of normalization variation, thereby enhancing the observed correlation. We also compare the flux and index distributions of VHE and non-VHE FSRQs, emphasizing the differences in their variability and emission patterns.
Figures


Figures from the paper (5 more)


Forward citations
Cited by 1 Pith paper
-
Spectral State Switching in Mrk 421: Results from the AstroSat LAXPC/SXT Observations
Mrk 421's X-ray spectrum switches between two discrete electron-index states, with the break energy shifting higher as the source brightens, as seen in both flux- and time-resolved AstroSat data.
Reference graph
Works this paper leans on
-
[1]
write newline
" write newline "" before.all 'output.state := FUNCTION fin.entry write newline FUNCTION new.block output.state before.all = 'skip after.block 'output.state := if FUNCTION new.sentence output.state after.block = 'skip output.state before.all = 'skip after.sentence 'output.state := if if FUNCTION not #0 #1 if FUNCTION and 'skip pop #0 if FUNCTION or pop #1...
-
[2]
Abdo A. A., et al., 2009, @doi [ ] 10.1088/0004-637X/700/1/597 , https://ui.adsabs.harvard.edu/abs/2009ApJ...700..597A 700, 597
-
[3]
Abdo A. A., et al., 2010, @doi [ ] 10.1088/0004-637X/716/1/30 , https://ui.adsabs.harvard.edu/abs/2010ApJ...716...30A 716, 30
-
[4]
Abdollahi S., et al., 2023, @doi [ ] 10.3847/1538-4365/acbb6a , https://ui.adsabs.harvard.edu/abs/2023ApJS..265...31A 265, 31
-
[5]
Abeysekara A. U., et al., 2015, @doi [ ] 10.1088/2041-8205/815/2/L22 , https://ui.adsabs.harvard.edu/abs/2015ApJ...815L..22A 815, L22
-
[6]
Adams C. B., et al., 2022, @doi [ ] 10.3847/1538-4357/ac32bd , https://ui.adsabs.harvard.edu/abs/2022ApJ...924...95A 924, 95
-
[7]
Aharonian F., et al., 2006, @doi [ ] 10.1051/0004-6361:20065351 , https://ui.adsabs.harvard.edu/abs/2006A&A...457..899A 457, 899
-
[8]
Ahnen M. L., et al., 2015, @doi [ ] 10.1088/2041-8205/815/2/L23 , https://ui.adsabs.harvard.edu/abs/2015ApJ...815L..23A 815, L23
Show all 70 references
-
[9]
L., et al., 2016, @doi [ ] 10.1051/0004-6361/201629461 , https://ui.adsabs.harvard.edu/abs/2016A&A...595A..98A 595, A98
Ahnen M. L., et al., 2016, @doi [ ] 10.1051/0004-6361/201629461 , https://ui.adsabs.harvard.edu/abs/2016A&A...595A..98A 595, A98
2016 doi
-
[10]
Akbar S., Shah Z., Misra R., Iqbal N., Tantry J., 2025, @doi [Journal of High Energy Astrophysics] https://doi.org/10.1016/j.jheap.2025.01.009 , 45, 438
2025 doi
-
[11]
Aleksi \'c J., et al., 2011a, @doi [ ] 10.1051/0004-6361/201116497 , https://ui.adsabs.harvard.edu/abs/2011A&A...530A...4A 530, A4
-
[12]
Aleksi \'c J., et al., 2011b, @doi [ ] 10.1088/2041-8205/730/1/L8 , https://ui.adsabs.harvard.edu/abs/2011ApJ...730L...8A 730, L8
-
[13]
Aleksi \'c J., et al., 2012, @doi [Astroparticle Physics] 10.1016/j.astropartphys.2011.11.007 , https://ui.adsabs.harvard.edu/abs/2012APh....35..435A 35, 435
2012 doi
-
[14]
Aleksi \'c J., et al., 2014a, @doi [ ] 10.1051/0004-6361/201323036 , https://ui.adsabs.harvard.edu/abs/2014A&A...567A..41A 567, A41
-
[15]
Aleksi \'c J., et al., 2014b, @doi [ ] 10.1051/0004-6361/201423484 , https://ui.adsabs.harvard.edu/abs/2014A&A...569A..46A 569, A46
-
[16]
Archambault S., et al., 2016, @doi [ ] 10.3847/0004-6256/151/6/142 , https://ui.adsabs.harvard.edu/abs/2016AJ....151..142A 151, 142
2016 doi
-
[17]
B., et al., 2009, @doi [ ] 10.1088/0004-637X/697/2/1071 , https://ui.adsabs.harvard.edu/abs/2009ApJ...697.1071A 697, 1071
Atwood W. B., et al., 2009, @doi [ ] 10.1088/0004-637X/697/2/1071 , https://ui.adsabs.harvard.edu/abs/2009ApJ...697.1071A 697, 1071
2009 doi
-
[18]
S., Elenterio D., Lopetus G., 2023, The Astronomer's Telegram, https://ui.adsabs.harvard.edu/abs/2023ATel16356....1B 16356, 1
Bartolini C., Giacchino F., Gisonna M. S., Elenterio D., Lopetus G., 2023, The Astronomer's Telegram, https://ui.adsabs.harvard.edu/abs/2023ATel16356....1B 16356, 1
2023
-
[19]
D., K \"o nigl A., 1979, @doi [ ] 10.1086/157262 , https://ui.adsabs.harvard.edu/abs/1979ApJ...232...34B 232, 34
Blandford R. D., K \"o nigl A., 1979, @doi [ ] 10.1086/157262 , https://ui.adsabs.harvard.edu/abs/1979ApJ...232...34B 232, 34
1979 doi
-
[20]
G., Gardner F
Bolton J. G., Gardner F. F., Mackey M. B., 1964, @doi [Australian Journal of Physics] 10.1071/PH640340 , https://ui.adsabs.harvard.edu/abs/1964AuJPh..17..340B 17, 340
1964 doi
-
[21]
B \"o ttcher M., Reimer A., Sweeney K., Prakash A., 2013, @doi [ ] 10.1088/0004-637X/768/1/54 , https://ui.adsabs.harvard.edu/abs/2013ApJ...768...54B 768, 54
2013 doi
-
[22]
Buson S., 2020, The Astronomer's Telegram, https://ui.adsabs.harvard.edu/abs/2020ATel13604....1B 13604, 1
2020
-
[23]
C., 2014, The Astronomer's Telegram, https://ui.adsabs.harvard.edu/abs/2014ATel.6316....1B 6316, 1
Buson S., Cheung C. C., 2014, The Astronomer's Telegram, https://ui.adsabs.harvard.edu/abs/2014ATel.6316....1B 6316, 1
2014
- [24]
-
[25]
C., et al., 2014, @doi [ ] 10.1088/2041-8205/782/2/L14 , https://ui.adsabs.harvard.edu/abs/2014ApJ...782L..14C 782, L14
Cheung C. C., et al., 2014, @doi [ ] 10.1088/2041-8205/782/2/L14 , https://ui.adsabs.harvard.edu/abs/2014ApJ...782L..14C 782, L14
2014 doi
-
[26]
C., Gasparrini D., Buson S., 2017, The Astronomer's Telegram, https://ui.adsabs.harvard.edu/abs/2017ATel10931....1C 10931, 1
Cheung C. C., Gasparrini D., Buson S., 2017, The Astronomer's Telegram, https://ui.adsabs.harvard.edu/abs/2017ATel10931....1C 10931, 1
2017
-
[27]
C., 2020, The Astronomer's Telegram, https://ui.adsabs.harvard.edu/abs/2020ATel13382....1C 13382, 1
Ciprini S., Cheung C. C., 2020, The Astronomer's Telegram, https://ui.adsabs.harvard.edu/abs/2020ATel13382....1C 13382, 1
2020
-
[28]
Cortina J., CTAO LST Collaboration 2023, The Astronomer's Telegram, https://ui.adsabs.harvard.edu/abs/2023ATel16381....1C 16381, 1
2023
-
[29]
Emery G., Cerruti M., Dmytriiev A., Jankowsky F., Prokoph H., Romoli C., Zacharias M., 2019, in 36th International Cosmic Ray Conference (ICRC2019). p. 668 ( @eprint arXiv 1908.06784 ), @doi 10.22323/1.358.0668
2019 arXiv
-
[30]
Errando M., 2014, in AAS/High Energy Astrophysics Division \#14. p. 106.11
2014
-
[31]
H., 2003, @doi [ ] 10.1086/374033 , https://ui.adsabs.harvard.edu/abs/2003ApJ...585L..23F 585, L23
Fan J. H., 2003, @doi [ ] 10.1086/374033 , https://ui.adsabs.harvard.edu/abs/2003ApJ...585L..23F 585, L23
2003 doi
-
[32]
Fossati G., Maraschi L., Celotti A., Comastri A., Ghisellini G., 1998, @doi [ ] 10.1046/j.1365-8711.1998.01828.x , https://ui.adsabs.harvard.edu/abs/1998MNRAS.299..433F 299, 433
1998
-
[33]
Ghisellini G., Tavecchio F., Foschini L., Ghirlanda G., Maraschi L., Celotti A., 2010, @doi [ ] 10.1111/j.1365-2966.2009.15898.x , https://ui.adsabs.harvard.edu/abs/2010MNRAS.402..497G 402, 497
2010
-
[34]
Goldoni P., Boisson C., Pita S., D'Ammando F., Kasai E., Max-Moerbeck W., Backes M., Cotter G., 2024, @doi [ ] 10.1051/0004-6361/202451609 , https://ui.adsabs.harvard.edu/abs/2024A&A...691L...5G 691, L5
2024 doi
-
[35]
H. E. S. S. Collaboration et al., 2013, @doi [ ] 10.1051/0004-6361/201321135 , https://ui.adsabs.harvard.edu/abs/2013A&A...554A.107H 554, A107
2013 doi
-
[36]
H. E. S. S. Collaboration et al., 2014, @doi [ ] 10.1051/0004-6361/201322897 , https://ui.adsabs.harvard.edu/abs/2014A&A...564A...9H 564, A9
2014 doi
-
[37]
H. E. S. S. Collaboration et al., 2019, @doi [ ] 10.1051/0004-6361/201935704 , https://ui.adsabs.harvard.edu/abs/2019A&A...627A.159H 627, A159
2019 doi
-
[38]
H. E. S. S. Collaboration et al., 2020, @doi [ ] 10.1051/0004-6361/201935906 , https://ui.adsabs.harvard.edu/abs/2020A&A...633A.162H 633, A162
2020 doi
-
[39]
H. E. S. S. Collaboration et al., 2021, @doi [ ] 10.1051/0004-6361/202038949 , https://ui.adsabs.harvard.edu/abs/2021A&A...648A..23H 648, A23
2021 doi
-
[40]
C., et al., 1992, @doi [ ] 10.1086/186263 , https://ui.adsabs.harvard.edu/abs/1992ApJ...385L...1H 385, L1
Hartman R. C., et al., 1992, @doi [ ] 10.1086/186263 , https://ui.adsabs.harvard.edu/abs/1992ApJ...385L...1H 385, L1
1992 doi
-
[41]
Hayashida M., et al., 2015, @doi [ ] 10.1088/0004-637X/807/1/79 , https://ui.adsabs.harvard.edu/abs/2015ApJ...807...79H 807, 79
2015 doi
-
[42]
Holder J., 2014, The Astronomer's Telegram, https://ui.adsabs.harvard.edu/abs/2014ATel.5981....1H 5981, 1
2014
-
[43]
Holder J., et al., 2006, @doi [Astroparticle Physics] 10.1016/j.astropartphys.2006.04.002 , https://ui.adsabs.harvard.edu/abs/2006APh....25..391H 25, 391
2006 doi
-
[44]
Khatoon R., Shah Z., Misra R., Gogoi R., 2020, @doi [ ] 10.1093/mnras/stz3108 , https://ui.adsabs.harvard.edu/abs/2020MNRAS.491.1934K 491, 1934
2020 doi
- [45]
-
[46]
P., Baliyan K
Kushwaha P., Chandra S., Misra R., Sahayanathan S., Singh K. P., Baliyan K. S., 2016, @doi [ ] 10.3847/2041-8205/822/1/L13 , https://ui.adsabs.harvard.edu/abs/2016ApJ...822L..13K 822, L13
2016 doi
-
[47]
La Mura G., 2022, The Astronomer's Telegram, https://ui.adsabs.harvard.edu/abs/2022ATel15666....1L 15666, 1
2022
-
[48]
Lucarelli F., et al., 2020, The Astronomer's Telegram, https://ui.adsabs.harvard.edu/abs/2020ATel13602....1L 13602, 1
2020
-
[49]
MAGIC Collaboration et al., 2008, @doi [Science] 10.1126/science.1157087 , https://ui.adsabs.harvard.edu/abs/2008Sci...320.1752M 320, 1752
2008 doi
-
[50]
MAGIC Collaboration et al., 2018, @doi [ ] 10.1051/0004-6361/201833618 , https://ui.adsabs.harvard.edu/abs/2018A&A...619A.159M 619, A159
2018 doi
-
[51]
MAGIC Collaboration et al., 2021, @doi [ ] 10.1051/0004-6361/202039687 , https://ui.adsabs.harvard.edu/abs/2021A&A...647A.163M 647, A163
2021 doi
-
[52]
Malik Z., Shah Z., Sahayanathan S., Iqbal N., Manzoor A., 2022, @doi [ ] 10.1093/mnras/stac1616 , https://ui.adsabs.harvard.edu/abs/2022MNRAS.514.4259M 514, 4259
2022 doi
-
[53]
P., 2014, @doi [ ] 10.1088/0004-637X/780/1/87 , https://ui.adsabs.harvard.edu/abs/2014ApJ...780...87M 780, 87
Marscher A. P., 2014, @doi [ ] 10.1088/0004-637X/780/1/87 , https://ui.adsabs.harvard.edu/abs/2014ApJ...780...87M 780, 87
2014 doi
-
[54]
Mereu I., 2020, The Astronomer's Telegram, https://ui.adsabs.harvard.edu/abs/2020ATel13521....1M 13521, 1
2020
-
[55]
Mirzoyan R., 2015, The Astronomer's Telegram, https://ui.adsabs.harvard.edu/abs/2015ATel.7416....1M 7416, 1
2015
-
[56]
Mirzoyan R., 2017, The Astronomer's Telegram, https://ui.adsabs.harvard.edu/abs/2017ATel11061....1M 11061, 1
2017
-
[57]
Mirzoyan R., 2020, The Astronomer's Telegram, https://ui.adsabs.harvard.edu/abs/2020ATel13412....1M 13412, 1
2020
-
[58]
Mukherjee R., 2015, The Astronomer's Telegram, https://ui.adsabs.harvard.edu/abs/2015ATel.7433....1M 7433, 1
2015
-
[59]
Mukherjee R., VERITAS Collaboration 2017, The Astronomer's Telegram, https://ui.adsabs.harvard.edu/abs/2017ATel11075....1M 11075, 1
2017
-
[60]
Naurois M., 2018, The Astronomer's Telegram, https://ui.adsabs.harvard.edu/abs/2018ATel11239....1N 11239, 1
2018
-
[61]
Pacciani L., 2015, The Astronomer's Telegram, https://ui.adsabs.harvard.edu/abs/2015ATel.7402....1P 7402, 1
2015
-
[62]
S., Sahayanathan S., Stalin C
Paliya V. S., Sahayanathan S., Stalin C. S., 2015, @doi [ ] 10.1088/0004-637X/803/1/15 , https://ui.adsabs.harvard.edu/abs/2015ApJ...803...15P 803, 15
2015 doi
-
[63]
M., et al., 2001, @doi [ ] 10.1051/0004-6361:20011112 , https://ui.adsabs.harvard.edu/abs/2001A&A...377..396R 377, 396
Raiteri C. M., et al., 2001, @doi [ ] 10.1051/0004-6361:20011112 , https://ui.adsabs.harvard.edu/abs/2001A&A...377..396R 377, 396
2001 doi
-
[64]
Shah Z., Sahayanathan S., Mankuzhiyil N., Kushwaha P., Misra R., Iqbal N., 2017, @doi [ ] 10.1093/mnras/stx1194 , https://ui.adsabs.harvard.edu/abs/2017MNRAS.470.3283S 470, 3283
2017 doi
-
[65]
Shah Z., Mankuzhiyil N., Sinha A., Misra R., Sahayanathan S., Iqbal N., 2018, @doi [Research in Astronomy and Astrophysics] 10.1088/1674-4527/18/11/141 , https://ui.adsabs.harvard.edu/abs/2018RAA....18..141S 18, 141
2018 doi
-
[66]
Shah Z., Jithesh V., Sahayanathan S., Misra R., Iqbal N., 2019, @doi [ ] 10.1093/mnras/stz151 , https://ui.adsabs.harvard.edu/abs/2019MNRAS.484.3168S 484, 3168
2019 doi
-
[67]
M., Padovani P., 1995, @doi [ ] 10.1086/133630 , https://ui.adsabs.harvard.edu/abs/1995PASP..107..803U 107, 803
Urry C. M., Padovani P., 1995, @doi [ ] 10.1086/133630 , https://ui.adsabs.harvard.edu/abs/1995PASP..107..803U 107, 803
1995 doi
-
[68]
J., 2020, The Astronomer's Telegram, https://ui.adsabs.harvard.edu/abs/2020ATel13632....1W 13632, 1
Wagner S. J., 2020, The Astronomer's Telegram, https://ui.adsabs.harvard.edu/abs/2020ATel13632....1W 13632, 1
2020
-
[69]
Wagner S., Rani B., H. E. S. S. Collaboration 2021, The Astronomer's Telegram, https://ui.adsabs.harvard.edu/abs/2021ATel15020....1W 15020, 1
2021
-
[70]
Zacharias M., et al., 2019, @doi [Galaxies] 10.3390/galaxies7010041 , https://ui.adsabs.harvard.edu/abs/2019Galax...7...41Z 7, 41
2019 doi
Reviewed August 7, 2026 · model on record in the stance chip above.
Discussion (0). Sign in to comment.