REVIEW 3 major objections 5 minor 77 references
DTBIA: An Immersive Visual Analytics System for Brain-Inspired Research
T0 review · 3 major / 5 minor · reviewed 2026-08-07 · deepseek-v4-flash
Pith's one-line read An immersive VR analytics system, DTBIA, lets brain researchers explore Digital Twin Brain simulations from whole regions down to individual voxels and slices.
desk verdict A well-built immersive analytics system for Digital Twin Brain data, but the 'strong evidence' claim outruns the qualitative, co-designer-heavy evaluation. read the letter →
The pith
A machine-rendered reading of the paper's core claim, the machinery that carries it, and where it could break.
The reading
What carries the argument
The central mechanism is a two-scale immersive brain model combined with a three-level exploration workflow. A Real-Scale brain model, positioned near the user for walking and overview, carries functional BOLD-encoded spheres and voxel cubes; a Large-Scale brain model supports egocentric flying for navigation inside the data. The workflow follows the overview-first principle as it moves from region-level to voxel-level to slice-section-level analysis, letting users teleport from a selected region into the large-scale model. The 3D Force-Directed Edge Bundling (3D-FDEB) algorithm carries the structural-analysis load: it takes the top 10% of connections by weight, computes endpoint coordinates, and clusters spatially similar edges using spring and electrostatic-repulsion forces so DTI pathways read as coherent bundles rather than overlapping lines.
What would settle it
A controlled study in which external, non-design users attempt the three defined analytic tasks with DTBIA and with the 2D DTBVis baseline, measuring time, error, and insight quality, would settle the claim: if DTBIA shows no measurable advantage, or if external users cannot reproduce the case-study findings such as the three-time-point BOLD delay, the effectiveness claim would be refuted.
Extended reading notes
Core claim
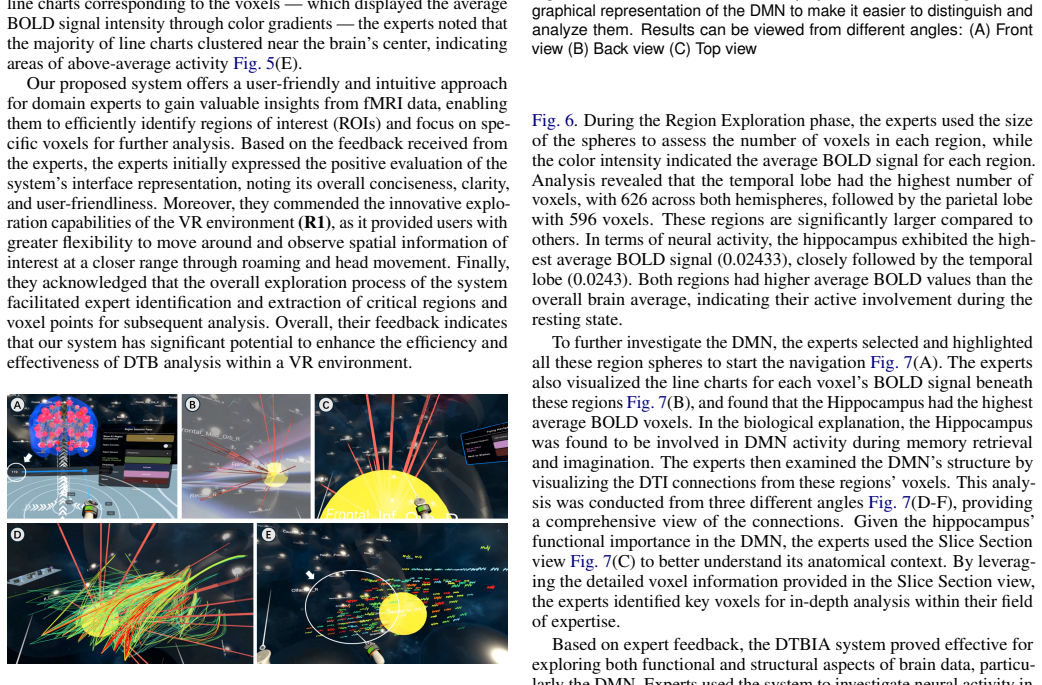
On the paper's own terms, the discovery is a system-design result: a VR environment organized around a hierarchical, top-down workflow enables domain experts to perform the three analytical tasks they said existing tools did not support. DTBIA's workflow moves from region-level comparison of BOLD signals to voxel-level inspection of time-series line charts and DTI connections, and finally to sagittal, horizontal, and coronal slice views; at each stage a Real-Scale brain supports overview and a Large-Scale brain supports immersive flying navigation. A 3D force-directed edge bundling algorithm filters the DTI data to its top 10% of connections, 38,036 links, so structural pathways do not collapse into visual clutter. In the case studies, experts observed that DTB-simulated BOLD signals peaked about three time points later and were weaker than biological signals, and a neuroscience expert used the system to examine the seven-region Default Mode Network, finding high hippocampal BOLD activity consistent with its role in memory and imagination. The paper concludes that these observations and expert feedback provide strong evidence for the system's practicality and effectiveness.
Load-bearing premise
The effectiveness claim rests on the assumption that experts' observations and think-aloud feedback, gathered from a group that includes people who helped design DTBIA, fairly measure how well the system works.
Editorial extensions
If this is right
- Domain experts can visually compare simulated DTB BOLD signals against biological fMRI side by side, so discrepancies such as timing delays or weaker amplitudes become directly observable.
- The region-to-voxel-to-slice workflow gives researchers a path from whole-brain overview to specific voxels and anatomical planes, supporting both functional and structural analysis in one environment.
- The 3D-FDEB filtering to the top 10% of DTI connections makes large structural networks legible in VR, and thresholding lets users isolate the most significant pathways.
- Because the same workflow handles human and macaque data, DTBIA supports cross-species comparisons of functional and structural brain organization.
- If the case-study evidence is accepted, VR-based exploration is a viable alternative to 2D tools for DTB research, and the system can aid model validation rather than only post-hoc visualization.
Reading between the lines
- The side-by-side comparison could be extended into a quantitative benchmark: automatically computing the three-time-point lag and amplitude ratio between simulated and biological BOLD signals would turn the observed delay into a measurable model-fidelity score.
- The same hierarchical immersive workflow could transfer to other simulation-validation settings, such as climate or fluid-dynamics models, wherever a 3D spatial field has time series at many points and a dense network of connections.
- A natural next test is a controlled study with external, task-naive participants comparing DTBIA against DTBVis on the three defined analytic tasks, to separate the contribution of the VR interface from the contribution of the hierarchical data design.
- The paper's own acknowledged limitations—subjective bias from interactive exploration, cybersickness at low thresholds, and the absence of gesture controls—suggest that usability, not data capacity, is the current bottleneck.
Editorial analysis
A structured set of objections, weighed in public.
Referee Report
Summary. The paper presents DTBIA, an immersive visual analytics system for exploring Digital Twin Brain (DTB) data. The system supports hierarchical exploration at region, voxel, and slice levels, with two VR brain models (real-scale and large-scale) and a 3D force-directed edge bundling (FDEB) algorithm for structural DTI connectivity. The authors derive tasks T1-T3 and requirements R1-R3 from a year-and-a-half co-design process with ten domain experts, then report two case studies (Sections 6.1 and 6.2) in which four experts actively used the system and eight others observed. The abstract and Section 8 state that the system's utility and effectiveness are 'validated' and that the studies provide 'strong evidence' for these claims.
Significance. If the validation claim were sound, DTBIA would be a noteworthy contribution to immersive visual analytics for neuroscience, and the co-design with domain experts over an extended period is a genuine strength. The system offers concrete, potentially useful features: hierarchical spatiotemporal navigation, side-by-side simulated-versus-biological comparison, and edge bundling for dense connectivity. However, the current evidence is a feasibility demonstration, not a validation: the case studies involve only four active participants, two of whom co-designed the system, there are no quantitative outcome measures, no baseline comparison, and the authors themselves concede a 'potential for subjective biases' in Section 7.2. The central claim is therefore not supported as written.
major comments (3)
- [Sections 6 and 8; Abstract] The central claim that the system's utility and effectiveness are 'validated' by the two case studies is not supported by the reported evidence. Only four experts actively used the system (E1, E5, E11, E12), and two of them (E1, E5) were part of the co-design team described in Section 3.2; the other eight original-group experts only observed screen streaming. The study reports no task-completion times, accuracy, error rates, insight counts, or other quantitative metrics, and there is no baseline comparison, for example against DTBVis or a 2D desktop view. The sessions were also assisted by the authors ('we assisted the experts', Section 6.1), so the external participants did not work independently. Section 7.2 itself states that 'further research is needed to assess the reliability and objectivity of the findings.' The abstract and Section 8 overstate the strength of this evidence.
- [Sections 3.2 and 6] The evaluation is circular in a load-bearing way. Tasks T1-T3 and requirements R1-R3 were derived from the same ten experts (E1-E10) who later evaluated the system, with E1 and E5 serving as primary case-study participants and the remaining eight providing additional feedback. The two external experts (E11, E12) were not involved in task definition, but they constitute only a small fraction of the feedback. The positive statements from E1 and E5 after an 18-month co-design process cannot serve as an impartial test of the system's effectiveness for its intended user population. This circularity is a core weakness, not a presentation issue, and it directly affects the validity of the 'strong evidence' conclusion.
- [Section 4.3, Eq. (1)] The 3D-FDEB algorithm, which is a claimed contribution for reducing visual clutter, is not specified precisely enough to be reproduced. In Eq. (1), the summation over Q is written as ∑_{Q∈E} ‖p_i − q_i‖ / Ce(P,Q), but the points q_i and the exact form of the compatibility function Ce(P,Q) are not defined. The free parameters kP and Ce are not given any default values or tuning procedure, and the 'top 10%' threshold for selecting connections is used without justification or sensitivity analysis (it appears again in Sections 5.1.1 and 5.2.2). Without this information, the reader cannot assess whether the bundling actually improves clarity, and the contribution is not reproducible.
minor comments (5)
- [Section 5] The heading 'Reion-Level Exploration' contains a typo; it should read 'Region-Level Exploration'.
- [Section 6, opening paragraph] The text says '12 experts participated in the evaluation,' but only four experts actively interacted with the system; the other eight observed a screen stream. This phrasing overstates the amount of hands-on evaluation.
- [Abstract] The phrase 'involving with brain research experts' is awkward; consider 'involving brain research experts' or 'with brain research experts.'
- [Sections 4.3 and 6.1] The thresholds are stated without rationale: the 'top 10%' in Section 4.3 and the '0.8' connection-weight threshold in Section 6.1. A brief explanation of how these values were chosen would help readers understand their role in the findings.
- [Section 6.1] The sentence 'Based on the feedback received from the experts, the experts initially expressed the positive evaluation of the system's interface representation' is redundant and could be streamlined.
Circularity Check
The effectiveness claim is partially circular: the tasks and requirements were derived from the same expert group that later supplied the positive case-study feedback, leaving only two external evaluators as an independent check.
-
fitted input called prediction
[Sections 3.2.1, 3.2.2, 6, and 8]
"Section 3.2.1: "Based on expert feedback, we categorized them into the following areas: T1: Exploring Similarity Between Simulated and Real Neural Signals ... T3: Topological Analysis of Structural Brain Data." Section 6: "In total, 12 experts participated in the evaluation: two from the original group (E1 and E5) and two external experts (E11 and E12). The remaining eight experts from the original group provided additional feedback by observing the VR interactions of the selected experts (E1 and E5) via screen streaming.""
The design inputs (tasks T1-T3, requirements R1-R3) were elicited from E1-E10 over a year and a half, with E1, E2, E3, E5, E7 explicitly named as the sources of the tasks. The evidence for the central claim that DTBIA is 'validated' and provides 'strong evidence supporting the practicality and effectiveness of our system' is then the positive feedback of E1 and E5 plus eight other members of that same original group. Thus the criterion used to confirm success and the specification used to build the system are supplied by the same people; their approval is not an independent test.
full rationale
The paper contains no mathematical derivation whose output is equivalent to its input: the FDEB force formula is standard, the three-level workflow is implemented as described, and the DTBIA/DtbVis relationship is presented as incremental prior work rather than as a load-bearing uniqueness theorem. The circularity is confined to the evaluation of the effectiveness claim. The tasks and requirements were co-designed with E1-E10, and the case studies then treat those same experts' affirmative feedback, plus screen-streamed comments from the rest of the original group, as 'validation.' Because the acceptance metric (expert satisfaction) is drawn from the same population that generated the design specification, agreement is close to forced; only E11 and E12 are external, and their sessions were assisted. Section 7.2's own admission of 'potential for subjective biases' and the need for 'further research' supports this reading. The algorithmic and system contributions are not circular, so the score is moderate rather than severe.
Assumptions & free parameters
free parameters (2)
- Top 10% connection threshold =
10% (reported as 38,036 links for 22,703 voxels)
- FDEB force parameters (kP and compatibility Ce) =
not specified
assumptions (5)
- domain assumption AAL atlas parcellation provides valid anatomical regions for human DTB and biological BOLD data.
- domain assumption DTB-simulated BOLD signals are comparable to biological resting-state BOLD signals for side-by-side visual assessment.
- domain assumption Force-directed edge bundling improves interpretability of dense DTI connections without distorting important topology.
- domain assumption Immersive VR navigation provides better spatial understanding than 2D displays for this type of data.
- domain assumption Qualitative expert feedback is sufficient evidence to establish the system's utility and effectiveness.
Cite this review
Pith. "Pith review of DTBIA: An Immersive Visual Analytics System for Brain-Inspired Research." pith.science (2026). https://pith.science/paper/MRCFGVEF
@misc{pith2026250523730,
  author       = {Pith},
  title        = {Pith review of: DTBIA: An Immersive Visual Analytics System for Brain-Inspired Research},
  year         = {2026},
  howpublished = {\url{https://pith.science/paper/MRCFGVEF}},
  note         = {Machine review of arXiv:2505.23730}
}
read the original abstract
The Digital Twin Brain (DTB) is an advanced artificial intelligence framework that integrates spiking neurons to simulate complex cognitive functions and collaborative behaviors. For domain experts, visualizing the DTB's simulation outcomes is essential to understanding complex cognitive activities. However, this task poses significant challenges due to DTB data's inherent characteristics, including its high-dimensionality, temporal dynamics, and spatial complexity. To address these challenges, we developed DTBIA, an Immersive Visual Analytics System for Brain-Inspired Research. In collaboration with domain experts, we identified key requirements for effectively visualizing spatiotemporal and topological patterns at multiple levels of detail. DTBIA incorporates a hierarchical workflow - ranging from brain regions to voxels and slice sections - along with immersive navigation and a 3D edge bundling algorithm to enhance clarity and provide deeper insights into both functional (BOLD) and structural (DTI) brain data. The utility and effectiveness of DTBIA are validated through two case studies involving with brain research experts. The results underscore the system's role in enhancing the comprehension of complex neural behaviors and interactions.
Figures


Figures from the paper (4 more)



Reference graph
Works this paper leans on
-
[1]
A system hierarchy for brain-inspired computing
Youhui Zhang, Peng Qu, Yu Ji, Weihao Zhang, Guangrong Gao, Guanrui Wang, Sen Song, Guoqi Li, Wenguang Chen, Weimin Zheng, et al. A system hierarchy for brain-inspired computing. Nature, 586(7829):378– 384, 2020. 1, 2
work page 2020
-
[2]
Brain-inspired computing: Models and architectures
Keshab K Parhi and Nanda K Unnikrishnan. Brain-inspired computing: Models and architectures. IEEE Open Journal of Circuits and Systems, 1:185–204, 2020. 1, 2
work page 2020
-
[3]
How ai and neuroscience drive each other forwards
Neil Savage. How ai and neuroscience drive each other forwards. Nature, 571(7766):S15–S15, 2019. 1
work page 2019
-
[4]
How ai could lead to a better understanding of the brain
Viren Jain. How ai could lead to a better understanding of the brain. Nature, 623(7986):247–250, 2023. 1, 2
work page 2023
-
[5]
Brain-inspired computing: A systematic survey and future trends
Guoqi Li, Lei Deng, Huajin Tang, Gang Pan, Yonghong Tian, Kaushik Roy, and Wolfgang Maass. Brain-inspired computing: A systematic survey and future trends. Proceedings of the IEEE, 2024. 1, 2
work page 2024
-
[6]
Human brain computing and brain-inspired intelligence, 2024
Jianfeng Feng, Viktor Jirsa, and Wenlian Lu. Human brain computing and brain-inspired intelligence, 2024. 1, 2
work page 2024
-
[7]
The human digital twin brain in the resting state and in action
Wenlian Lu, Qibao Zheng, Ningsheng Xu, Jianfeng Feng, and DTB Con- sortium. The human digital twin brain in the resting state and in action. arXiv preprint arXiv:2211.15963, 2022. 1, 2
arXiv 2022
-
[8]
Digital Twin Brain: a simulation and assimilation platform for whole human brain
Wenlian Lu, Longbin Zeng, Xin Du, Wenyong Zhang, Shitong Xiang, Huarui Wang, Jiexiang Wang, Mingda Ji, Yubo Hou, Minglong Wang, et al. Digital twin brain: a simulation and assimilation platform for whole human brain. arXiv preprint arXiv:2308.01241, 2023. 1, 2
work page Pith review arXiv 2023
Show all 77 references
-
[9]
The digital twin brain: A bridge between biological and artificial intelligence
Hui Xiong, Congying Chu, Lingzhong Fan, Ming Song, Jiaqi Zhang, Yawei Ma, Ruonan Zheng, Junyang Zhang, Zhengyi Yang, and Tianzi Jiang. The digital twin brain: A bridge between biological and artificial intelligence. Intelligent Computing, 2:0055, 2023. 2
2023
-
[10]
Dtbvis: An interactive visual comparison system for digital twin brain and human brain
Yuxiao Li, Xinhong Li, Siqi Shen, Longbin Zeng, Richen Liu, Qibao Zheng, Jianfeng Feng, and Siming Chen. Dtbvis: An interactive visual comparison system for digital twin brain and human brain. Visual Infor- matics, 7(2):41–53, 2023. 2, 5
2023
-
[11]
The blue brain project
Henry Markram. The blue brain project. Nature reviews neuroscience, 7(2):153–160, 2006. 2
2006
-
[12]
The human brain project: creating a european research infrastructure to decode the human brain
Katrin Amunts, Christoph Ebell, Jeff Muller, Martin Telefont, Alois Knoll, and Thomas Lippert. The human brain project: creating a european research infrastructure to decode the human brain. Neuron, 92(3):574– 581, 2016. 2
2016
-
[13]
The virtual brain: a simulator of primate brain network dynamics
Paula Sanz Leon, Stuart A Knock, M Marmaduke Woodman, Lia Do- mide, Jochen Mersmann, Anthony R McIntosh, and Viktor Jirsa. The virtual brain: a simulator of primate brain network dynamics. Frontiers in neuroinformatics, 7:10, 2013. 2
2013
-
[14]
The spinnaker project
Steve B Furber, Francesco Galluppi, Steve Temple, and Luis A Plana. The spinnaker project. Proceedings of the IEEE, 102(5):652–665, 2014. 2
2014
-
[15]
Building a spiking neural network model of the basal ganglia on spinnaker
Basabdatta Sen-Bhattacharya, Sebastian James, Oliver Rhodes, Indar Sugiarto, Andrew Rowley, Alan B Stokes, Kevin Gurney, and Steve B Furber. Building a spiking neural network model of the basal ganglia on spinnaker. IEEE Transactions on Cognitive and Developmental Systems, 10(...
2018
-
[16]
fmriprep: a robust preprocessing pipeline for functional mri
Oscar Esteban, Christopher J Markiewicz, Ross W Blair, Craig A Moodie, A Ilkay Isik, Asier Erramuzpe, James D Kent, Mathias Goncalves, Eliz- abeth DuPre, Madeleine Snyder, et al. fmriprep: a robust preprocessing pipeline for functional mri. Nature methods, 16(1):111–116, 2019. 2
2019
-
[17]
Opinion: Mapping context and content: the brainmap model
Peter T Fox and Jack L Lancaster. Opinion: Mapping context and content: the brainmap model. Nature reviews. Neuroscience, 3(4):319—321, April
-
[18]
The human connectome project: A retrospective
Jennifer Elam, Matthew Glasser, Michael Harms, Stamatios Sotiropoulos, Jesper Andersson, Gregory Burgess, Sandra Curtiss, Robert Oostenveld, Linda Larson-Prior, Jan-Mathijs Schoffelen, Michael Hodge, Eileen Cler, Daniel Marcus, Deanna Barch, Essa Yacoub, Stephen Smith, Kamil U...
2021
-
[19]
Brainbrowser: Distributed, web-based neurological data visualization
Tarek Sherif, Nicolas Kassis, Marc-Étienne Rousseau, Reza Adalat, and Alan Evans. Brainbrowser: Distributed, web-based neurological data visualization. Frontiers in neuroinformatics, 8:89, 01 2014. 2
2014
-
[20]
Connexel visualization: a software implementation of glyphs and edge-bundling for dense connectivity data using braingl
Joachim Böttger, Ralph Schurade, Estrid Jakobsen, Alexander Schäfer, and Daniel Margulies. Connexel visualization: a software implementation of glyphs and edge-bundling for dense connectivity data using braingl. Frontiers in Neuroscience, 8, 2014. 2
2014
-
[21]
The representation of semantic information across human cerebral cortex during listening versus reading is invariant to stimulus modality
Fatma Deniz, Anwar Nunez-Elizalde, Alexander Huth, and Jack Gallant. The representation of semantic information across human cerebral cortex during listening versus reading is invariant to stimulus modality. The Journal of Neuroscience, 39:0675–19, 08 2019. 2
2019
-
[22]
Arsiwalla, Riccardo Zucca, Alberto Betella, Enrique Martinez, David Dalmazzo, Pedro Omedas, Gustavo Deco, and Paul F
Xerxes D. Arsiwalla, Riccardo Zucca, Alberto Betella, Enrique Martinez, David Dalmazzo, Pedro Omedas, Gustavo Deco, and Paul F. M. J. Ver- schure. Network dynamics with brainx3: a large-scale simulation of the human brain network with real-time interaction. Frontiers in Neuroi...
2015
-
[23]
Al-Awami, Johanna Beyer, Hendrik Strobelt, Narayanan Kasthuri, Jeff W
Ali K. Al-Awami, Johanna Beyer, Hendrik Strobelt, Narayanan Kasthuri, Jeff W. Lichtman, Hanspeter Pfister, and Markus Hadwiger. Neurolines: A subway map metaphor for visualizing nanoscale neuronal connectivity. IEEE Transactions on Visualization and Computer Graphics, 20(12):2...
2014
-
[24]
Garcia-Cantero, Juan P
Juan J. Garcia-Cantero, Juan P. Brito, Susana Mata, Sofia Bayona, and Luis Pastor. Neurotessmesh: A tool for the generation and visualiza- tion of neuron meshes and adaptive on-the-fly refinement. Frontiers in Neuroinformatics, 11, 2017. 2
2017
-
[25]
Krum, Thai Phan, Dominique Duncan, Ryan Essex, Mark Bolas, and Arthur Toga
Tyler Ard, David M. Krum, Thai Phan, Dominique Duncan, Ryan Essex, Mark Bolas, and Arthur Toga. Nivr: Neuro imaging in virtual reality. In 2017 IEEE Virtual Reality (VR), pages 465–466, 2017. 2
2017
-
[26]
Springer, 2018
Kim Marriott, Falk Schreiber, Tim Dwyer, Karsten Klein, Nathalie Henry Riche, Takayuki Itoh, Wolfgang Stuerzlinger, and Bruce H Thomas.Im- mersive analytics, volume 11190. Springer, 2018. 2
2018
-
[27]
Tim Dwyer, Kim Marriott, Tobias Isenberg, Karsten Klein, Nathalie Riche, Falk Schreiber, Wolfgang Stuerzlinger, and Bruce H. Thomas. Immersive Analytics: An Introduction, pages 1–23. Springer International Publishing, Cham, 2018. 2
2018
-
[28]
Metaverse: Perspectives from graphics, interactions and visualization
Yuheng Zhao, Jinjing Jiang, Yi Chen, Richen Liu, Yalong Yang, Xi- angyang Xue, and Siming Chen. Metaverse: Perspectives from graphics, interactions and visualization. Visual Informatics, 6(1):56–67, 2022. 2
2022
-
[29]
Survey of immersive analytics
Adrien Fonnet and Yannick Prie. Survey of immersive analytics. IEEE transactions on visualization and computer graphics, 27(3):2101–2122,
-
[30]
Immersive analytics with abstract 3d visualizations: A survey
Matthias Kraus, Johannes Fuchs, Björn Sommer, Karsten Klein, Ulrich En- gelke, Daniel Keim, and Falk Schreiber. Immersive analytics with abstract 3d visualizations: A survey. In Computer Graphics Forum, volume 41, pages 201–229. Wiley Online Library, 2022. 2
2022
-
[31]
Grand challenges in immersive analytics
Barrett Ens, Benjamin Bach, Maxime Cordeil, Ulrich Engelke, Marcos Serrano, Wesley Willett, Arnaud Prouzeau, Christoph Anthes, Wolfgang Büschel, Cody Dunne, et al. Grand challenges in immersive analytics. In Proceedings of the 2021 CHI Conference on Human Factors in Computing ...
2021
-
[32]
Timetables: Embodied exploration of immersive spatio- temporal data
Yidan Zhang, Barrett Ens, Kadek Ananta Satriadi, Arnaud Prouzeau, and Sarah Goodwin. Timetables: Embodied exploration of immersive spatio- temporal data. In 2022 IEEE Conference on Virtual Reality and 3D User Interfaces (VR), pages 599–605, 2022. 2
2022
-
[33]
Mapstack: Exploring multilayered geospatial data in virtual reality
Maxim Spur, Vincent Tourre, Erwan David, Guillaume Moreau, and Patrick Callet. Mapstack: Exploring multilayered geospatial data in virtual reality. pages 88–99, 01 2020. 2
2020
-
[34]
Immersive visualisation of geo-temporal narratives in law enforcement
Andrew Cunningham, James Walsh, and Bruce Thomas. Immersive visualisation of geo-temporal narratives in law enforcement. In 2018 International Symposium on Big Data Visual and Immersive Analytics (BDVA), pages 1–8, 2018. 2
2018
-
[35]
Tivee: Visual exploration and explanation of badminton tactics in immersive visual- izations
Xiangtong Chu, Xiao Xie, Shuainan Ye, Haolin Lu, Hongguang Xiao, Zeqing Yuan, Zhutian Chen, Hui Zhang, and Yingcai Wu. Tivee: Visual exploration and explanation of badminton tactics in immersive visual- izations. IEEE Transactions on Visualization and Computer Graphics , 28(1)...
2022
-
[36]
Shuttlespace: Exploring and analyzing movement trajectory in immersive visualization
Shuainan Ye, Zhutian Chen, Xiangtong Chu, Yifan Wang, Siwei Fu, Lejun Shen, Kun Zhou, and Yingcai Wu. Shuttlespace: Exploring and analyzing movement trajectory in immersive visualization. IEEE Transactions on Visualization and Computer Graphics, 27(2):860–869, 2021. 2
2021
-
[37]
Urbanvr: An immersive analytics system for context-aware urban design
Chi Zhang, Wei Zeng, and Ligang Liu. Urbanvr: An immersive analytics system for context-aware urban design. Computers & Graphics, 99:128– 138, 2021. 2
2021
-
[38]
Iatk: An immer- sive analytics toolkit
Maxime Cordeil, Andrew Cunningham, Benjamin Bach, Christophe Hurter, Bruce H Thomas, Kim Marriott, and Tim Dwyer. Iatk: An immer- sive analytics toolkit. In 2019 IEEE Conference on Virtual Reality and 3D User Interfaces (VR), pages 200–209. IEEE, 2019. 2
2019
-
[39]
Dxr: A toolkit for building immer- sive data visualizations
Ronell Sicat, Jiabao Li, Junyoung Choi, Maxime Cordeil, Won-Ki Jeong, Benjamin Bach, and Hanspeter Pfister. Dxr: A toolkit for building immer- sive data visualizations. IEEE transactions on visualization and computer graphics, 25(1):715–725, 2018. 2
2018
-
[40]
Johnson J. G. Keiriz, Liang Zhan, Olusola Ajilore, Alex D. Leow, and An- gus G. Forbes. NeuroCave: A web-based immersive visualization platform for exploring connectome datasets. Network Neuroscience, 2(3):344–361, 09 2018. 3
2018
-
[41]
Sonia: an immersive customizable virtual reality system for the education and exploration of brain networks
Owen Hellum, Christopher Steele, and Yiming Xiao. Sonia: an immersive customizable virtual reality system for the education and exploration of brain networks. arXiv preprint arXiv:2301.09772, 2023. 3
2023 arXiv
-
[42]
Exploration of virtual and augmented reality for visual analytics and 3d volume rendering of functional magnetic resonance imaging (fmri) data
Michael de Ridder, Younhyun Jung, Robin Huang, Jinman Kim, and David Dagan Feng. Exploration of virtual and augmented reality for visual analytics and 3d volume rendering of functional magnetic resonance imaging (fmri) data. In 2015 Big Data Visual Analytics (BDVA), pages 1–8....
2015
-
[43]
Multiuser virtual reality environment for visualising neuroimaging data
David W Shattuck. Multiuser virtual reality environment for visualising neuroimaging data. Healthcare Technology Letters, 5(5):183–188, 2018. 3
2018
-
[44]
A taxonomy of spatial-temporal data visualization
Ying Zhu, Pragna Reddy Kancharla, and Chaitanya Sai Kumar Talluru. A taxonomy of spatial-temporal data visualization. In 2021 25th Interna- tional Conference Information Visualisation (IV), pages 223–228. IEEE,
2021
-
[45]
A survey of multi-space techniques in spatio-temporal simulation data visualization
Xueyi Chen, Liming Shen, Ziqi Sha, Richen Liu, Siming Chen, Genlin Ji, and Chao Tan. A survey of multi-space techniques in spatio-temporal simulation data visualization. Visual Informatics, 3(3):129–139, 2019. 3
2019
-
[46]
Andrienko, Gennady L
Natalia V . Andrienko, Gennady L. Andrienko, and Peter Gatalsky. Ex- ploratory spatio-temporal visualization: an analytical review. J. Vis. Lang. Comput., 14:503–541, 2003. 3
2003
-
[47]
The space-time cube revisited from a geovisualization perspective
Menno-Jan Kraak. The space-time cube revisited from a geovisualization perspective. Proc 21st Int Cartogr Conf, 07 2008. 3
2008
-
[48]
Andrienko, and Gennady L
Peter Gatalsky, Natalia V . Andrienko, and Gennady L. Andrienko. Inter- active analysis of event data using space-time cube. Proceedings. Eighth International Conference on Information Visualisation, 2004. IV 2004., pages 145–152, 2004. 3
2004
-
[49]
Sidharth Thakur and Andrew J. Hanson. A 3d visualization of multiple time series on maps. In 2010 14th International Conference Information Visualisation, pages 336–343, 2010. 3
2010
-
[50]
The great wall of space-time
Christian Tominski and Hans-Jörg Schulz. The great wall of space-time. pages 199–206, 01 2012. 3
2012
-
[51]
A comparison of spatiotemporal visualizations for 3d urban analytics
Roberta Mota, Nivan Ferreira, Julio Daniel Silva, Marius Horga, Marcos Lage, Luis Ceferino, Usman Alim, Ehud Sharlin, and Fabio Miranda. A comparison of spatiotemporal visualizations for 3d urban analytics. IEEE transactions on visualization and computer graphics, 29(1):1277–1287,
-
[52]
V o, Juliana Freire, and Cláudio T
Nivan Ferreira, Jorge Poco, Huy T. V o, Juliana Freire, and Cláudio T. Silva. Visual exploration of big spatio-temporal urban data: A study of new york city taxi trips.IEEE Transactions on Visualization and Computer Graphics, 19(12):2149–2158, 2013. 3
2013
-
[53]
Variable-based spatiotemporal trajectory data visualization illustrated
Jing He, Haonan Chen, Yijin Chen, Xinming Tang, and Yebin Zou. Variable-based spatiotemporal trajectory data visualization illustrated. IEEE Access, 7:143646–143672, 2019. 3
2019
-
[54]
Fabian Nagel, Giuliano Castiglia, Gemza Ademaj, Juri Buchmller, Udo Schlegel, and Daniel A. Keim. cpmviz: A web-based visualization tool for uncertain spatiotemporal data. In 2019 IEEE Conference on Visual Analytics Science and Technology (VAST), pages 140–141, 2019. 3
2019
-
[55]
V oila: Visual anomaly detection and monitoring with streaming spatiotemporal data
Nan Cao, Chaoguang Lin, Qiuhan Zhu, Yu-Ru Lin, Xian Teng, and Xidao Wen. V oila: Visual anomaly detection and monitoring with streaming spatiotemporal data. IEEE Transactions on Visualization and Computer Graphics, 24(1):23–33, 2018. 3
2018
-
[56]
Ddlvis: Real-time visual query of spatiotemporal data distribution via density dictionary learning
Chenhui Li, George Baciu, Yunzhe Wang, Junjie Chen, and Changbo Wang. Ddlvis: Real-time visual query of spatiotemporal data distribution via density dictionary learning. IEEE Transactions on Visualization and Computer Graphics, 28(1):1062–1072, 2022. 3
2022
-
[57]
Mapping, learning, visualization, classification, and understand- ing of fmri data in the neucube evolving spatiotemporal data machine of spiking neural networks
Nikola K Kasabov, Maryam Gholami Doborjeh, and Zohreh Gholami Doborjeh. Mapping, learning, visualization, classification, and understand- ing of fmri data in the neucube evolving spatiotemporal data machine of spiking neural networks. IEEE transactions on neural networks and l...
2016
-
[58]
Interactive visualization for brain spatio-temporal networks
Andrea Purgato, Marco D Santambrogio, Tanya Berger-Wolf, and Angus G Forbes. Interactive visualization for brain spatio-temporal networks. In 2017 IEEE EMBS International Conference on Biomedical & Health Informatics (BHI), pages 21–24. IEEE, 2017. 3
2017
-
[59]
Tzourio-Mazoyer, B
N. Tzourio-Mazoyer, B. Landeau, D. Papathanassiou, F. Crivello, O. Etard, N. Delcroix, B. Mazoyer, and M. Joliot. Automated anatomical labeling of activations in spm using a macroscopic anatomical parcellation of the mni mri single-subject brain. NeuroImage, 15(1):273–289, 2002. 3
2002
-
[60]
Resting-state functional mri: every- thing that nonexperts have always wanted to know
Han Lv, Zhenchang Wang, Elizabeth Tong, Leanne M Williams, Greg Zaharchuk, Michael Zeineh, Andrea N Goldstein-Piekarski, Tali M Ball, Chengde Liao, and Max Wintermark. Resting-state functional mri: every- thing that nonexperts have always wanted to know. American Journal of Ne...
2018
-
[61]
Cognitive transfer of spatial awareness states from immersive virtual environments to reality
Katerina Mania, Shahrul Badariah, Matthew Coxon, and Phil Watten. Cognitive transfer of spatial awareness states from immersive virtual environments to reality. ACM Transactions on Applied Perception (TAP), 7(2):1–14, 2010. 4
2010
-
[62]
Immersive virtual reality to enhance the spatial awareness of students
Fabin Rasheed, Prasad Onkar, and Marisha Narula. Immersive virtual reality to enhance the spatial awareness of students. In Proceedings of the 7th Indian Conference on Human-Computer Interaction, pages 154–160,
-
[63]
Locomotion tech- niques for dynamic environments: Effects on spatial knowledge and user experiences
Hyunjeong Kim, Sang-Bin Jeon, and In-Kwon Lee. Locomotion tech- niques for dynamic environments: Effects on spatial knowledge and user experiences. IEEE Transactions on Visualization and Computer Graphics,
-
[64]
Scene transitions and teleportation in virtual reality and the implications for spatial awareness and sickness
Kasra Rahimi, Colin Banigan, and Eric D Ragan. Scene transitions and teleportation in virtual reality and the implications for spatial awareness and sickness. IEEE transactions on visualization and computer graphics, 26(6):2273–2287, 2018. 4
2018
-
[65]
The effects of head-mounted display mechanical properties and field of view on distance judgments in virtual environments
Peter Willemsen, Mark B Colton, Sarah H Creem-Regehr, and William B Thompson. The effects of head-mounted display mechanical properties and field of view on distance judgments in virtual environments. ACM Transactions on Applied Perception (TAP), 6(2):1–14, 2009. 4
2009
-
[66]
An immersive virtual reality system for semi-autonomous driving simulation: a comparison between realistic and 6-dof controller-based interaction
Daniele Sportillo, Alexis Paljic, Mehdi Boukhris, Philippe Fuchs, Luciano Ojeda, and Vincent Roussarie. An immersive virtual reality system for semi-autonomous driving simulation: a comparison between realistic and 6-dof controller-based interaction. In Proceedings of the 9th ...
2017
-
[67]
The craft of informa- tion visualization
Ben Shneiderman, B Bederson, and B Shneiderman. The craft of informa- tion visualization. 2003. 4
2003
-
[68]
A taxonomy of 3d occlusion management for visualization
Niklas Elmqvist and Philippas Tsigas. A taxonomy of 3d occlusion management for visualization. IEEE transactions on visualization and computer graphics, 14(5):1095–1109, 2008. 5
2008
-
[69]
Vr exploration assistance through automatic occlusion removal
Lili Wang, Jian Wu, Xuefeng Yang, and V oicu Popescu. Vr exploration assistance through automatic occlusion removal. IEEE transactions on visualization and computer graphics, 25(5):2083–2092, 2019. 5
2019
-
[70]
The effect of exploration mode and frame of reference in immersive analytics
Jorge Wagner, Wolfgang Stuerzlinger, and Luciana Nedel. The effect of exploration mode and frame of reference in immersive analytics. IEEE Transactions on Visualization and Computer Graphics, 28(9):3252–3264,
-
[71]
Occlusion management in vr: A comparative study
Lili Wang, Han Zhao, Zesheng Wang, Jian Wu, Bingqiang Li, Zhiming He, and V oicu Popescu. Occlusion management in vr: A comparative study. In 2019 IEEE Conference on Virtual Reality and 3D User Interfaces (VR), pages 708–716. IEEE, 2019. 5
2019
-
[72]
Conservative occlusion culling for urban visualization using a slice-wise data structure
Türker Yılmaz and U˘gur Güdükbay. Conservative occlusion culling for urban visualization using a slice-wise data structure. Graphical Models, 69(3-4):191–210, 2007. 5
2007
-
[73]
Interactive 3d force-directed edge bundling
Daniel Zielasko, Benjamin Weyers, Bernd Hentschel, and Torsten W Kuhlen. Interactive 3d force-directed edge bundling. InComputer graphics forum, volume 35, pages 51–60. Wiley Online Library, 2016. 5
2016
-
[74]
Force-directed edge bundling for graph visualization
Danny Holten and Jarke J Van Wijk. Force-directed edge bundling for graph visualization. In Computer graphics forum , volume 28, pages 983–990. Wiley Online Library, 2009. 5
2009
-
[75]
Visual comparison for information visualization
Michael Gleicher, Danielle Albers, Rick Walker, Ilir Jusufi, Charles D Hansen, and Jonathan C Roberts. Visual comparison for information visualization. Information Visualization, 10(4):289–309, 2011. 6
2011
-
[76]
The cell-type specific cortical microcircuit: relating structure and activity in a full-scale spiking network model
Tobias C Potjans and Markus Diesmann. The cell-type specific cortical microcircuit: relating structure and activity in a full-scale spiking network model. Cerebral cortex, 24(3):785–806, 2014. 9
2014
-
[77]
Multi-scale account of the network struc- ture of macaque visual cortex
Maximilian Schmidt, Rembrandt Bakker, Claus C Hilgetag, Markus Dies- mann, and Sacha J Van Albada. Multi-scale account of the network struc- ture of macaque visual cortex. Brain Structure and Function, 223(3):1409– 1435, 2018. 9
2018
Reviewed August 7, 2026 · model on record in the stance chip above.
Discussion (0). Sign in to comment.