REVIEW 4 major objections 5 minor 95 references
The role of bars in triggering active galactic nuclei galaxies
T0 review · 4 major / 5 minor · reviewed 2026-08-07 · deepseek-v4-flash
Pith's one-line read Barred spiral galaxies are more likely than similar unbarred ones to host a powerful active nucleus, according to a matched survey of thousands of AGNs.
desk verdict A solid, incremental empirical paper: the barred-unbarred AGN excess is real but mostly a reprise of the group's earlier work; the new value is in the GZ DECaLS-based strong/weak bar and environment analysis, and the main soft spot is the control sample's mixed origin and unmatched inclination. read the letter →
The pith
A machine-rendered reading of the paper's core claim, the machinery that carries it, and where it could break.
The reading
What carries the argument
The central machinery is a matched control sample: barred spirals from Galaxy Zoo DECaLS (selected with bar and face-on probability thresholds above 0.7, at z < 0.1) are compared to unbarred spirals drawn from the same catalog and supplemented with Galaxy Zoo 2, matched on redshift, stellar mass, local density Σ5, absolute r-band magnitude, and concentration index, with KS and Anderson-Darling tests confirming the distributions match. Nuclear power is measured by the [OIII]λ5007 luminosity, used as a star-formation-insensitive tracer of AGN power, with thresholds log Lum[OIII] = 6.2 (powerful) and 7 (extremely powerful), and by the accretion rate R = log(Lum[OIII])/M_BH computed from black hole masses derived from the M_BH-σ* relation. Bar strength is taken from the Galaxy Zoo DECaLS strong- versus weak-bar probabilities, and environment from the fifth-nearest-neighbor density Σ5, split into three density regimes.
What would settle it
Re-run the analysis with the unbarred control selected from the same DECaLS imaging, requiring the same face-on inclination cut (p_disk_edge_on_no > 0.7) and the same visual bar-confirmation procedure used for the barred sample, and check whether the roughly 11 percentage-point excess in powerful AGN fraction survives; if it shrinks to null, the result is an orientation or survey-depth artifact rather than a bar effect.
Extended reading notes
Core claim
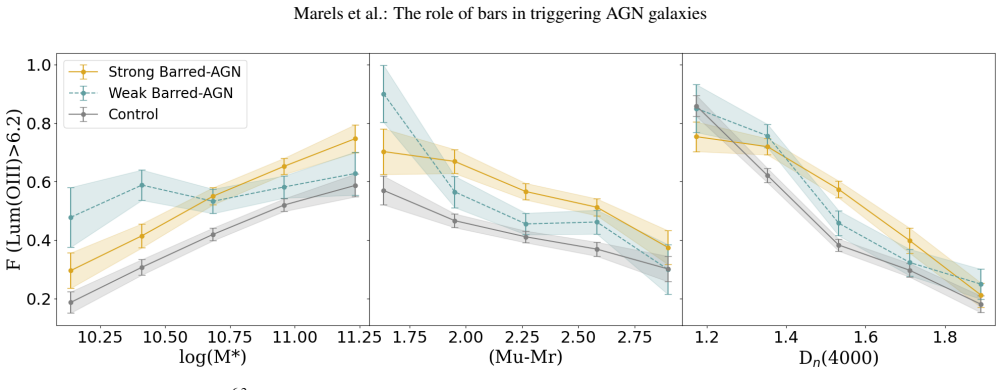
On the paper's own terms, the discovery is that the presence of a bar raises the chance that an AGN is powerful: the fraction of AGNs with log Lum[OIII] > 6.2 is about 11 percentage points higher in barred galaxies than in a control sample matched on redshift, stellar mass, local density, absolute magnitude, and concentration index. The same offset appears for extremely powerful AGNs (log Lum[OIII] > 7) and for the accretion-rate parameter R, defining powerful AGNs as R > -0.9. The paper also reports that barred galaxies show a mild tendency to host less massive black holes that accrete more efficiently, and that when bars are split by strength, strong bars show higher nuclear activity than weak bars, with the difference appearing mainly at the low- and high-density extremes of the environment distribution. The authors interpret the excess as bars channeling gas inward, enhancing black hole feeding without being the sole determinant of AGN activity.
Load-bearing premise
The whole comparison stands on the assumption that the unbarred control sample is a true counterfactual for the barred sample in every respect that affects [OIII] luminosity, even though the control was partly built from a different survey and was not explicitly matched on galaxy inclination, while the barred sample is restricted to face-on systems.
Editorial extensions
If this is right
- Bar fraction should be included as a covariate in any local-Universe AGN demographics or black-hole growth study, since barred and unbarred hosts differ in nuclear power at fixed stellar mass.
- If strong bars feed black holes more efficiently, galaxy evolution models that include secular evolution should tie bar strength to supermassive black hole accretion episodes.
- The reported tendency for barred galaxies to host less massive, more efficiently accreting black holes implies the M_BH-σ* relation may need separate calibrations for barred hosts.
- Environment-dependent differences suggest that the bar's fueling role is modulated by gas availability: strong bars matter most where the gas supply is either scarce (low density) or being replenished by interactions (high density).
Reading between the lines
- A testable extension is to measure the same excess using bar classifications from infrared imaging (for example, Spitzer) to check that the optical Galaxy Zoo labels are not biased by dust or inclination.
- The paper's matched-sample logic could be applied to radio-selected or X-ray-selected AGNs to see whether the bar enhancement is specific to narrow-line [OIII] selection.
- If bars channel gas in the way the paper suggests, the excess should correlate with signs of recent nuclear inflow, such as central molecular gas concentrations or nuclear star formation; that correlation is not tested here.
- Because the control is not explicitly inclination-matched, an orientation-dependent projection of the bar onto the [OIII] selection could mimic part of the excess; comparing edge-on barred galaxies would separate bar physics from geometry.
Editorial analysis
A structured set of objections, weighed in public.
Referee Report
Summary. This paper compares the nuclear activity of barred and unbarred AGN host galaxies using Galaxy Zoo DECaLS morphological classifications and SDSS DR7/MPA-JHU spectroscopy. The authors construct 1330 barred AGNs and 1651 unbarred controls matched on redshift, stellar mass, local density, absolute magnitude, and concentration, and report that barred galaxies host a higher fraction of powerful AGNs at both log(Lum[OIII])=6.2 (53.4% vs 42.3%) and log(Lum[OIII])=7 (15% vs 10%), as well as a higher fraction with accretion-rate parameter R>-0.9 (45% vs 35%). They also examine trends with stellar mass, color, Dn(4000), black-hole mass, bar strength, and environment, concluding that bars enhance AGN activity, especially for strong bars in low- and high-density environments.
Significance. If the control-sample construction is sound, the central result adds to observational evidence that bars are associated with enhanced AGN activity, using deeper DECaLS imaging than most previous SDSS-based studies. The paper's strengths include the use of an independent luminosity threshold (log Lum[OIII]>7 from Kauffmann et al. 2003), KS and Anderson-Darling tests for the matched parameters, bootstrap errors, and a large, visually classified sample with bar-strength information. The secondary claims about black-hole mass, accretion efficiency, and environmental dependence are interesting but rest on additional assumptions that need scrutiny. The manuscript does not provide reproducibility code, but the catalogs are public and the selection steps are, in principle, reproducible.
major comments (4)
- [3.2 (control sample)] The unbarred control is the load-bearing comparison for the central claim, but its construction is not matched to the barred sample in inclination. Section 3.1 restricts barred galaxies to face-on orientation with p_disk_edge_on_no > 0.7, while Section 3.2 does not state any inclination cut for the large GZ2 supplement (~1450 of 1651 galaxies); it only says that GZ2 galaxies were visually inspected in DECaLS imaging to confirm the absence of a bar. If the GZ2 supplement contains systematically more edge-on or dusty systems, their [OIII] luminosities could be attenuated (even after Balmer-decrement correction) and/or their bar classification could be affected, shifting the unbarred fraction of powerful AGNs downward and producing exactly the reported excess. Please either restrict the control to face-on systems, match the p_disk_edge_on_no distribution between the two samples, or repeat the comparison using only the ~200 GZ DECaLS unbarred AGNs and demonstrate that the excess persists.
- [4 (threshold definitions)] The definition of the 'powerful AGN' threshold needs clarification. The text states that log(Lum[OIII])=6.2 'coincides with the median of the data' and that the vertical line in Fig. 3 represents 'the median of the barred sample.' If the threshold is the barred-sample median, then the 53.4% quoted for barred galaxies with Lum[OIII]>6.2 is inconsistent with a median by definition; if it is the median of the combined sample, that should be stated explicitly. The same issue applies to R=-0.9. The independent check at log Lum[OIII]>7 is reassuring, but the median-based thresholds should be justified, and it should be made clear whether they were set before or after examining the sample being compared.
- [4.2 / Table 5] The environmental claim in the abstract and conclusions—that strong bars show enhanced activity in low- and high-density environments but not intermediate-density ones—is stronger than the quoted uncertainties support. For example, in low-density environments, the Lum[OIII]>6.2 fractions are 54.4%±3.7% (strong) vs 46.5%±4.9% (weak), a difference of roughly 1.3 sigma; the R>-0.9 low-density difference (48.8%±3.7% vs 29.7%±4.5%) is the only comparison approaching 3 sigma. Please add explicit significance tests for the environment subsamples and temper the conclusion accordingly, or show that the differences are significant after multiple-comparison correction.
- [4 (black hole mass and accretion rate)] The conclusion that barred galaxies host less massive black holes and accrete more efficiently is derived by applying the same MBH-sigma relation to both samples, as stated in Section 4. Since the paper itself cites Graham (2008) that velocity dispersion may be affected by bars and the MBH-sigma relation may differ for barred galaxies, the black-hole-mass and R trends could be partly a scaling-relation artifact. Please show the distributions of sigma and black-hole mass for both samples and test the sensitivity of the R results to alternative MBH-sigma calibrations, including the barred-specific values mentioned in the text.
minor comments (5)
- [Throughout] The manuscript contains numerous typographical and grammatical errors (e.g., 'wich' for 'which', 'ins section' for 'in Section', 'avaliable' for 'available', missing superscripts in units). A thorough language edit is needed.
- [Fig. 3 / Section 4] The caption and text are inconsistent about the dashed line in the lower panel: the text explains that different alpha/beta values were explored but the same values are used in the rest of the analysis, while the caption appears to present the dashed line as the standard case. Please clarify what the dashed line actually shows.
- [3.2] The Anderson-Darling test is mentioned as supporting the KS results, but the AD p-values are not presented in Fig. 2 or Table 1. Please provide them, at least in a table or appendix.
- [Tables 2, 4, and 5] The error bars on the percentages are not described in the text or captions. If they are bootstrap errors, state the resampling procedure and number of iterations; if they are binomial errors, say so.
- [References] Some references are duplicated or inconsistently formatted (e.g., Abazajian et al. 2009a and 2009b both cite ApJS 182, 543), and the in-text citation 'Alonso et al. (2006)' has a reference entry that is unusually formatted. Please check the reference list against the journal style.
Circularity Check
Secondary threshold choices are data-defined, but the central barred-versus-unbarred AGN comparison is an external, testable observational result.
-
self definitional
[Section 4, paragraph defining powerful/weak AGN thresholds (page 5, after Fig. 3; see also Table 2)]
"In the case of accretion rate, we also define R = -0.9 as the value at which the excess becomes significant for the barred galaxies relative to the control sample, in the same way as for Lum[OIII], this value represents the median of the data."
The 'powerful AGN' threshold for R is not an independent physical cut but is set from the same barred/control comparison, at the point where the excess is already significant and at the sample median. The resulting percentages in Table 2 (45% vs 35%) therefore reflect the chosen cut and are not an independent measurement of the bar-AGN connection. The same issue applies to the Lum[OIII] threshold, which 'coincides with the median of the data.' This is a secondary, summary-level circularity: the central claim does not rest on these percentages alone, because the full-distribution KS tests reject equality and the fixed Kauffmann limit log Lum[OIII] > 7 reproduces the Lum[OIII] excess.
full rationale
The paper's central claim that barred AGN hosts show a higher fraction of powerful [OIII] AGNs than unbarred controls is an observational comparison of two samples rather than a prediction derived from a fitted model. The samples are matched on redshift, stellar mass, local density, absolute magnitude, and concentration using KS and Anderson-Darling tests, and the difference is checked against an external Kauffmann et al. (2003) cut at log Lum[OIII] > 7, which reproduces the excess. Self-citations, including the Coldwell et al. (2017) AGN catalog and Alonso et al. (2018) for the [OIII] threshold, are background methodology and prior results rather than the load-bearing derivation; the AGN selection is BPT-based on SDSS data, and the black-hole masses use the external Tremaine et al. (2002) relation. The only mild circularity is summary-level: the 'powerful' thresholds for Lum[OIII] and R are set from the sample median, and R = -0.9 is explicitly chosen as the value at which the excess becomes significant, so the percentages in Table 2 are partly shaped by that choice. This does not force the central result because the full-distribution KS tests also reject equality and the fixed external luminosity threshold confirms the trend. The unmatched-inclination control-sample issue raised by the skeptic is a potential selection bias rather than a circularity and should be weighed as a correctness risk instead of in this score.
Assumptions & free parameters
free parameters (4)
- Powerful AGN luminosity threshold log(Lum[OIII]) = 6.2 Lsun =
6.2 (log Lsun)
- Accretion-rate threshold R = -0.9 =
-0.9
- Galaxy Zoo morphology probability thresholds =
0.7 (barred and face-on), 0.3 (unbarred)
- Environment density bins log(Sigma5) =
-0.57 and 0.05
assumptions (6)
- domain assumption BPT diagram with Kauffmann et al. (2003) demarcation correctly identifies AGNs in the Coldwell et al. (2017) catalog.
- domain assumption [OIII] 5007 luminosity is a reliable tracer of nuclear activity with negligible star formation contamination.
- domain assumption The Tremaine et al. (2002) MBH-sigma relation applies with the same coefficients to barred and unbarred galaxies.
- domain assumption Local density Sigma5 from the fifth nearest neighbor with Mr < -20.5 and dv < 1000 km/s is an adequate environmental measure.
- domain assumption Matching on z, M*, Sigma5, Mr, and C removes the relevant confounders between barred and unbarred samples.
- domain assumption Galaxy Zoo DECaLS bar probabilities correctly classify bars, and visual inspection of GZ2 galaxies removes misclassified bars.
Cite this review
Pith. "Pith review of The role of bars in triggering active galactic nuclei galaxies." pith.science (2026). https://pith.science/paper/ZT2GVMRK
@misc{pith2026250523958,
  author       = {Pith},
  title        = {Pith review of: The role of bars in triggering active galactic nuclei galaxies},
  year         = {2026},
  howpublished = {\url{https://pith.science/paper/ZT2GVMRK}},
  note         = {Machine review of arXiv:2505.23958}
}
read the original abstract
Bars are considered an efficient mechanism for transporting gas toward the central regions of galaxies, potentially enhancing nuclear activity. However, the extent to which bars influence active galactic nuclei (AGNs), and whether their efficiency varies with environment, remain open questions. In this study, we aim to quantify the role of bars in triggering AGNs by comparing the AGN fraction in barred and non-barred galaxies across different environments. We constructed a sample from the Galaxy Zoo DECaLS catalog, ensuring a control selection where both samples share similar distributions in stellar mass, redshift, magnitude, concentration index, and local density parameter. AGNs were identified using spectroscopic data from the Sloan Digital Sky Survey, yielding 1330 barred AGNs and 1651 unbarred AGNs. We use the [OIII]5007 luminosity (Lum[OIII]) and the accretion rate parameter R as indicators of nuclear activity. Based on these, we applied criteria to distinguish powerful from weak AGNs, allowing a more precise assessment of the bar's impact on the supermassive black hole. Our analysis reveals that barred galaxies tend to host a higher fraction of powerful AGNs. From Lum[OIII], we find that more active nuclei reside in massive, blue galaxies with young stellar populations. We also observe a slight tendency for barred galaxies to host less massive black holes accreting more efficiently. The classification of strong and weak bars shows that more prominent bars correlate with higher nuclear activity. While this trend shows no significant differences in intermediate-density environments, it becomes evident in both low- and high-density regions, where galaxies with strong bars show enhanced AGN activity.
Figures


Figures from the paper (6 more)




Reference graph
Works this paper leans on
-
[1]
G., Valdes, F., Yee, H
Abraham, R. G., Valdes, F., Yee, H. K. C., & van den Bergh, S. 1994, ApJ, 432, 75
1994
-
[2]
Aguerri, J. A. L., Cuomo, V ., Rojas-Roncero, A., & Morelli, L. 2023, A&A, 679, A5
2023
-
[3]
Alexander, D. M. & Hickox, R. C. 2012, New A Rev., 56, 93
2012
-
[4]
S., Coldwell, G., & Lambas, D
Alonso, M. S., Coldwell, G., & Lambas, D. G. 2013, A&A, 549, A141
2013
-
[5]
S., Tissera, P
Alonso, M. S., Tissera, P. B., Lambas, D. G., & Coldwell, G. 2006, in Revista Mexicana de Astronomia y Astrofisica Conference Series, V ol. 26, Revista Mexicana de Astronomia y Astrofisica Conference Series, 187
2006
-
[6]
Alonso, S., Coldwell, G., Duplancic, F., Mesa, V ., & Lambas, D. G. 2018, A&A, 618, A149
2018
-
[7]
Alonso, S., Coldwell, G., & Lambas, D. G. 2014, A&A, 572, A86
2014
-
[8]
2024, A&A, 690, A273
Alonso, S., Vera-Rueda, M., Coldwell, G., Duplancic, F., & Mesa, V . 2024, A&A, 690, A273
2024
Show all 95 references
-
[9]
2003, MNRAS, 341, 1179
Athanassoula, E. 2003, MNRAS, 341, 1179
2003
-
[10]
Athanassoula, E., Machado, R. E. G., & Rodionov, S. A. 2013, MNRAS, 429, 1949
2013
-
[11]
A., Phillips, M
Baldwin, J. A., Phillips, M. M., & Terlevich, R. 1981, PASP, 93, 5
1981
-
[12]
L., Baldry, I
Balogh, M. L., Baldry, I. K., Nichol, R., et al. 2004, ApJ, 615, L101
2004
-
[13]
L., Morris, S
Balogh, M. L., Morris, S. L., Yee, H. K. C., Carlberg, R. G., & Ellingson, E. 1999, ApJ, 527, 54
1999
-
[14]
D., Bhavsar, S
Barrow, J. D., Bhavsar, S. P., & Sonoda, D. H. 1984, MNRAS, 210, 19P
1984
-
[15]
H., & Fricke, K
Berentzen, I., Athanassoula, E., Heller, C. H., & Fricke, K. J. 2004, MNRAS, 347, 220
2004
-
[16]
Blanton, M. R. & Roweis, S. 2007, AJ, 133, 734
2007
-
[17]
R., Schlegel, D
Blanton, M. R., Schlegel, D. J., Strauss, M. A., et al. 2005, AJ, 129, 2562
2005
-
[18]
Brinchmann, J., Charlot, S., White, S. D. M., et al. 2004, MNRAS, 351, 1151
2004
-
[19]
& Combes, F
Buta, R. & Combes, F. 1996, Fund. Cosmic Phys., 17, 95
1996
-
[20]
C., et al
Calzetti, D., Armus, L., Bohlin, R. C., et al. 2000, ApJ, 533, 682
2000
-
[21]
R., Athanassoula, E., et al
Cheung, E., Trump, J. R., Athanassoula, E., et al. 2015, MNRAS, 447, 506
2015
-
[22]
& Gadotti, D
Coelho, P. & Gadotti, D. A. 2011, ApJ, 743, L13
2011
-
[23]
V ., Lambas, D
Coldwell, G. V ., Lambas, D. G., Söchting, I. K., & Gurovich, S. 2009, MNRAS, 399, 88
2009
-
[24]
V ., Pereyra, L., Alonso, S., Donoso, E., & Duplancic, F
Coldwell, G. V ., Pereyra, L., Alonso, S., Donoso, E., & Duplancic, F. 2017, MN- RAS, 467, 3338
2017
-
[25]
& Elmegreen, B
Combes, F. & Elmegreen, B. G. 1993, A&A, 271, 391
1993
-
[26]
& Sanders, R
Combes, F. & Sanders, R. H. 1981, A&A, 96, 164
1981
-
[27]
& Maiolino, R
Cresci, G. & Maiolino, R. 2018, Nature Astronomy, 2, 179 de Vaucouleurs, G. 1963, ApJS, 8, 31
2018
-
[28]
J., Lang, D., et al
Dey, A., Schlegel, D. J., Lang, D., et al. 2019, AJ, 157, 168 Di Matteo, T., Springel, V ., & Hernquist, L. 2005, Nature, 433, 604
2019
-
[29]
1980, ApJ, 236, 351
Dressler, A. 1980, ApJ, 236, 351
1980
-
[30]
L., Nair, P., Patton, D
Ellison, S. L., Nair, P., Patton, D. R., et al. 2011, MNRAS, 416, 2182
2011
-
[31]
L., Wong, T., Sánchez, S
Ellison, S. L., Wong, T., Sánchez, S. F., et al. 2021, MNRAS, 505, L46
2021
-
[32]
Bissell, B. A. 1996, AJ, 111, 2233
1996
-
[33]
M., Elmegreen, B
Elmegreen, D. M., Elmegreen, B. G., & Bellin, A. D. 1990, ApJ, 364, 415
1990
-
[34]
2018, MNRAS, 474, 5372
Erwin, P. 2018, MNRAS, 474, 5372
2018
-
[35]
B., Frogel, J
Eskridge, P. B., Frogel, J. A., Pogge, R. W., et al. 2000, AJ, 119, 536
2000
-
[36]
Fabian, A. C. 2012, ARA&A, 50, 455
2012
-
[37]
& Merritt, D
Ferrarese, L. & Merritt, D. 2000, ApJ, 539, L9
2000
-
[38]
2017, A&A, 601, A143
Fiore, F., Feruglio, C., Shankar, F., et al. 2017, A&A, 601, A143
2017
-
[39]
2019, MNRAS, 483, 4586
Fluetsch, A., Maiolino, R., Carniani, S., et al. 2019, MNRAS, 483, 4586
2019
-
[40]
Gadotti, D. A. 2011, MNRAS, 415, 3308
2011
-
[41]
Gadotti, D. A. & Dos Anjos, S. 2001, in Astronomical Society of the Pacific Conference Series, V ol. 230, Galaxy Disks and Disk Galaxies, ed. J. G. Funes & E. M. Corsini, 237–238
2001
-
[42]
A., Willett, K
Galloway, M. A., Willett, K. W., Fortson, L. F., et al. 2015, MNRAS, 448, 3442
2015
-
[43]
L., Walmsley, M., Silcock, M
Garland, I. L., Walmsley, M., Silcock, M. S., et al. 2024, MNRAS, 532, 2320 Géron, T., Smethurst, R. J., Lintott, C., et al. 2023, MNRAS, 521, 1775 Géron, T., Smethurst, R. J., Lintott, C., et al. 2021, MNRAS, 507, 4389
2024
-
[44]
Graham, A. W. 2008, ApJ, 680, 143
2008
-
[45]
Greene, J. E. & Ho, L. C. 2007, ApJ, 670, 92
2007
-
[46]
Heckman, T. M. 1980, A&A, 87, 152
1980
-
[47]
M., Kauffmann, G., Brinchmann, J., et al
Heckman, T. M., Kauffmann, G., Brinchmann, J., et al. 2004, ApJ, 613, 109
2004
-
[48]
Hopkins, P. F. 2012, MNRAS, 420, L8
2012
-
[49]
2022, MNRAS, 513, 3768 Jr., F
Irodotou, D., Fragkoudi, F., Pakmor, R., et al. 2022, MNRAS, 513, 3768 Jr., F. J. M. 1951, Journal of the American Statistical Association, 46, 68
2022
-
[50]
M., Tremonti, C., et al
Kauffmann, G., Heckman, T. M., Tremonti, C., et al. 2003, MNRAS, 346, 1055
2003
-
[51]
J., Heisler, C
Kewley, L. J., Heisler, C. A., Dopita, M. A., & Lumsden, S. 2001, ApJS, 132, 37
2001
-
[52]
& Choi, Y .-Y
Kim, M. & Choi, Y .-Y . 2020, ApJ, 901, L38
2020
-
[53]
A., et al
Kim, T., Sheth, K., Gadotti, D. A., et al. 2015, ApJ, 799, 99
2015
-
[54]
H., Shlosman, I., & Peletier, R
Knapen, J. H., Shlosman, I., & Peletier, R. F. 2000, ApJ, 529, 93
2000
-
[55]
Kormendy, J. & Ho, L. C. 2013, ARA&A, 51, 511
2013
-
[56]
& Kennicutt, Jr., R
Kormendy, J. & Kennicutt, Jr., R. C. 2004, ARA&A, 42, 603
2004
-
[57]
H., & Peletier, R
Laine, S., Shlosman, I., Knapen, J. H., & Peletier, R. F. 2002, ApJ, 567, 97
2002
-
[58]
G., et al
Lee, G.-H., Woo, J.-H., Lee, M. G., et al. 2012, ApJ, 750, 141
2012
-
[59]
2017, ApJ, 838, 105 Łokas, E
Lin, L., Li, C., He, Y ., Xiao, T., & Wang, E. 2017, ApJ, 838, 105 Łokas, E. L., Ebrová, I., del Pino, A., et al. 2016, ApJ, 826, 227
2017
-
[60]
1969, Nature, 223, 690
Lynden-Bell, D. 1969, Nature, 223, 690
1969
-
[61]
& Roy, J.-R
Martin, P. & Roy, J.-R. 1994, ApJ, 424, 599 Martínez, H. J. & Muriel, H. 2011, MNRAS, 418, L148
1994
-
[62]
L., Nichol, R., Bamford, S., et al
Masters, K. L., Nichol, R., Bamford, S., et al. 2010, MNRAS, 404, 792
2010
-
[63]
L., Nichol, R
Masters, K. L., Nichol, R. C., Hoyle, B., et al. 2011, MNRAS, 411, 2026
2011
-
[64]
McConnell, N. J. & Ma, C.-P. 2013, ApJ, 764, 184 Méndez-Abreu, J., Sánchez-Janssen, R., & Aguerri, J. A. L. 2010, ApJ, 711, L61 Menéndez-Delmestre, K., Sheth, K., Schinnerer, E., Jarrett, T. H., & Scoville, N. Z. 2007, ApJ, 657, 790
2013
-
[65]
Mihos, J. C. & Hernquist, L. 1996, ApJ, 464, 641
1996
-
[66]
C., McGaugh, S
Mihos, J. C., McGaugh, S. S., & de Blok, W. J. G. 1997, ApJ, 477, L79
1997
-
[67]
Nair, P. B. & Abraham, R. G. 2010, ApJS, 186, 427
2010
-
[68]
A., Wisotzki, L., et al
Neumann, J., Gadotti, D. A., Wisotzki, L., et al. 2019, A&A, 627, A26
2019
-
[69]
Oh, S., Oh, K., & Yi, S. K. 2012, ApJS, 198, 4
2012
-
[70]
2009, MNRAS, 397, 748
Perez, J., Tissera, P., & Blaizot, J. 2009, MNRAS, 397, 748
2009
-
[71]
G., Stone, J
Piner, B. G., Stone, J. M., & Teuben, P. J. 1995, ApJ, 449, 508
1995
-
[72]
Reines, A. E. & V olonteri, M. 2015, ApJ, 813, 82
2015
-
[73]
A., Bender, R., et al
Richstone, D., Ajhar, E. A., Bender, R., et al. 1998, Nature, 385, A14
1998
-
[74]
Robichaud, F., Williamson, D., Martel, H., Kawata, D., & Ellison, S. L. 2017, MNRAS, 469, 3722
2017
-
[75]
& Elmegreen, B
Saha, K. & Elmegreen, B. 2018, ApJ, 858, 24
2018
-
[76]
M., Charlot, S., et al
Salim, S., Rich, R. M., Charlot, S., et al. 2007, ApJS, 173, 267
2007
-
[77]
2007, MNRAS, 382, 1415
Schawinski, K., Thomas, D., Sarzi, M., et al. 2007, MNRAS, 382, 1415
2007
-
[78]
Scholz, F. W., . S. M. A. 1987, Journal of the American Statistical Association, 82(399), 918–924
1987
-
[79]
Sellwood, J. A. 2014, Reviews of Modern Physics, 86, 1
2014
-
[80]
C., & Frank, J
Shlosman, I., Begelman, M. C., & Frank, J. 1990, Nature, 345, 679
1990
-
[81]
& Rees, M
Silk, J. & Rees, M. J. 1998, A&A, 331, L1
1998
-
[82]
A., Martins, L
Silva-Lima, L. A., Martins, L. P., Coelho, P. R. T., & Gadotti, D. A. 2022, A&A, 661, A105
2022
-
[83]
A., Masters, K
Skibba, R. A., Masters, K. L., Nichol, R. C., et al. 2012, MNRAS, 423, 1485
2012
-
[84]
J., Lintott, C
Smethurst, R. J., Lintott, C. J., Simmons, B. D., et al. 2016, MNRAS, 463, 2986
2016
-
[85]
R., et al
Strateva, I., Ivezi´c, Ž., Knapp, G. R., et al. 2001, AJ, 122, 1861
2001
-
[86]
A., Weinberg, D
Strauss, M. A., Weinberg, D. H., Lupton, R. H., et al. 2002, AJ, 124, 1810
2002
-
[87]
2002, ApJ, 574, 740
Tremaine, S., Gebhardt, K., Bender, R., et al. 2002, ApJ, 574, 740
2002
-
[88]
A., Heckman, T
Tremonti, C. A., Heckman, T. M., Kauffmann, G., et al. 2004, ApJ, 613, 898
2004
-
[89]
& Osterbrock, D
Veilleux, S. & Osterbrock, D. E. 1987, ApJS, 63, 295
1987
-
[90]
2016, A&A, 595, A63
Vera, M., Alonso, S., & Coldwell, G. 2016, A&A, 595, A63
2016
-
[91]
2007, A&A, 474, 43
Verley, S., Combes, F., Verdes-Montenegro, L., Bergond, G., & Leon, S. 2007, A&A, 474, 43
2007
-
[92]
2022, MNRAS, 509, 3966
Walmsley, M., Lintott, C., Géron, T., et al. 2022, MNRAS, 509, 3966
2022
-
[93]
W., Lintott, C
Willett, K. W., Lintott, C. J., Bamford, S. P., et al. 2013, MNRAS, 435, 2835
2013
-
[94]
G., Adelman, J., Anderson, John E., J., et al
York, D. G., Adelman, J., Anderson, John E., J., et al. 2000, AJ, 120, 1579
2000
-
[95]
& King, A
Zubovas, K. & King, A. R. 2014, MNRAS, 439, 400 Article number, page 12 of 12
2014
Reviewed August 7, 2026 · model on record in the stance chip above.
Discussion (0). Sign in to comment.