REVIEW 4 major objections 4 minor 24 references
Fault-Tolerant IoT System Using Software-Based "Digital Twin"
T0 review · 4 major / 4 minor · reviewed 2026-08-07 · deepseek-v4-flash
Pith's one-line read This paper claims that a triplicated IoT sensing system with software digital twins can keep outputting the correct sensed value even when one sensor fails hard and a second develops a soft, transient, or intermittent fault during the…
desk verdict Plausible architecture, unproven central claim: the forecast-driven twin could in principle preserve TMR voting, but the paper never tests the threshold behavior that makes or breaks it. read the letter →
The pith
A machine-rendered reading of the paper's core claim, the machinery that carries it, and where it could break.
The reading
What carries the argument
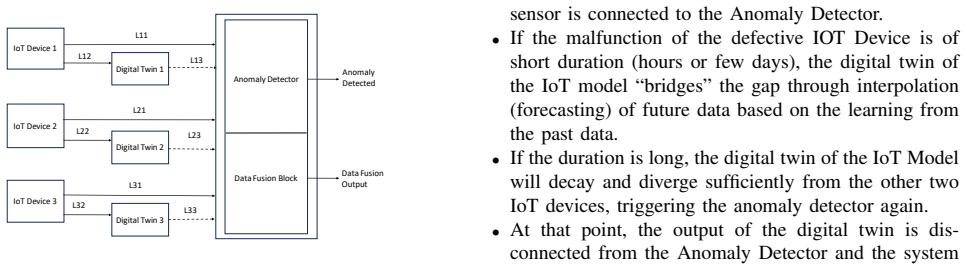
The load-bearing mechanism is the software-based digital twin: a forecasting model trained on a sensor's past readings that is substituted into the TMR voting structure when the sensor is flagged as faulty. The paper pairs this with a centralized anomaly detector, taken from a prior machine-learning study, and a TMR data-fusion block whose composite estimate, a running average, is used to repair anomalous individual readings. The twin carries the argument because it is what keeps the majority vote intact during the repair window; the data fusion block is what turns the three streams, including the twin, into a single corrected output.
What would settle it
Run an end-to-end fault-injection test on a real or recorded sensor stream: let one sensor fail hard, then let a second sensor develop a transient fault during the repair window, and record whether the fused output's error stays below the anomaly threshold until repair completes. The scheme is disproved if, for a realistic threshold, the digital twin's drift (for example, TFT on the voltage channel in the paper's dataset) is rejected by the anomaly detector before the repair is finished, leaving only two physical sensors.
Extended reading notes
Core claim
The central claim is that a triple-modular-redundant IoT structure remains correct under multiple fault conditions once each physical sensor has a software-based digital twin. The twin is a time-series forecasting model, Prophet or TFT, that continuously tracks the sensor's readings; when the anomaly detector flags a sensor, that sensor is disconnected and its twin is connected to the detector and the data fusion block. The twin's forecast readings participate in the majority vote, preserving a three-way vote even though only two physical sensors remain. The paper's data fusion layer then averages the streams and, when a reading deviates from the composite estimate beyond a threshold, replaces it with the last composite value, which the authors say detects and corrects hard, soft, intermittent, and transient faults. Because of the twin plus this fusion scheme, the paper claims the structure outputs the correct sensed value when one sensor sustains a hard fault and one of the remaining two experiences a soft, transient, or intermittent fault, and in fact under multiple fault conditions.
Load-bearing premise
The load-bearing premise is that a forecasting model trained on a sensor's past readings will keep producing values close enough to the true ones to pass the anomaly detector's threshold for the whole repair window, which can be hours to days.
Editorial extensions
If this is right
- If the claim holds, a high-reliability IoT installation can survive a sensor failure followed by a second, different fault within roughly a day to two days of the first failure, without adding a fourth physical sensor.
- The repair or replacement window for the failed device becomes a designed parameter: about one day for a Prophet twin and about two days for a TFT twin, based on the reported tracking behaviour.
- The system's failure mode shifts from 'second fault during repair breaks majority voting' to 'twin drift exceeding the anomaly detector's threshold before repair completes'.
- Because the twin is software, the marginal cost of the added fault tolerance is computation and memory rather than another sensing device, which the paper identifies as the main advantage.
- A system that already collects historical sensor data for monitoring can reuse that data to train the twins, so the scheme is applicable where time-series history exists.
Reading between the lines
- Editorial: the paper's own Figure 3(d) shows the TFT twin deviating substantially on the voltage channel, and the authors attribute this to noisy training data; a test on a clean voltage series would settle whether the twin degrades gracefully or fails exactly on the channel where the physical sensor is most likely to be noisy.
- Editorial: the anomaly detector that decides when to swap in the twin and when to drop it is referenced as prior work but not evaluated here, so the full closed-loop claim depends on that detector's threshold behaviour; a natural extension is to inject faults end-to-end and measure the detector's swap timing against the twin's forecast horizon.
- Editorial: one could push the scheme further by using ensemble forecasting or retraining the twin during the repair window from the two healthy sensors' readings, which the paper does not consider.
Editorial analysis
A structured set of objections, weighed in public.
Referee Report
Summary. The manuscript proposes a fault-tolerant IoT architecture that combines triple modular redundancy (TMR) with software-based digital twins. Each physical sensor is paired with a twin implemented by a time-series forecasting model (Prophet or Temporal Fusion Transformer). When a sensor fault is detected by an anomaly detector, the corresponding digital twin is substituted into the voting structure until the physical device is repaired, and a centralized data fusion block combines the three inputs. The authors report qualitative forecasting results on the Intel Berkeley sensor dataset and claim that the resulting structure outputs the correct sensed value even when one sensor has a hard fault and another has a soft, transient, or intermittent fault.
Significance. If validated, the proposal would be an interesting low-cost extension of TMR for high-reliability IoT systems, replacing a failed physical sensor with a software twin during the repair window. The paper makes a concrete, falsifiable architectural claim and uses real-world sensor data for its forecasting examples. The strengths are a clearly described system concept and the exploration of two well-known forecasting models. However, the central claims are not supported by the presented evidence: there is no end-to-end fault-injection experiment, no quantitative accuracy assessment of the forecasting models, and no specification or evaluation of the anomaly detector and data-fusion thresholds that the architecture depends on.
major comments (4)
- [Section III (Figs. 2, 3) and Section III.C] The evaluation of the digital-twin forecasting models is purely qualitative. The text asserts that Prophet and TFT 'track the sensor closely' without reporting any error metric (e.g., MAE, RMSE, or maximum deviation) or any comparison against the anomaly detector's acceptance threshold, which is never defined. Figure 3(d) explicitly shows TFT deviating substantially on the voltage channel; Section III.C dismisses this as an artifact of noisy training data and asserts that 'for clean data, even for voltage, the TFT model should work very well,' but the stated clean-data test is not performed. This is a load-bearing issue because the system-level guarantee in Section V requires the digital twin's forecast to stay within the acceptance band for the entire repair window; the manuscript provides no quantitative evidence of that.
- [Section II (Figure 1 and bullet list) and Section V] The Section V claim that 'the TMR structure is able to output the correct value of the sensed parameter when one of the sensors sustains a hard fault and in addition one of the remaining two sensors experiences a soft, transient, or intermittent fault' is contradicted by the architecture's own operating rules. Section II states that if the digital twin decays and diverges, the anomaly detector disconnects it and the system continues with two physical devices; if an anomaly is detected before repair, 'the usual practice in TMR structure is to randomly select one of the devices.' In the claimed scenario, after the twin is dropped there would be only one healthy physical sensor plus one faulty sensor, so no majority vote is possible. The paper does not present any end-to-end fault-injection experiment that actually exercises this double-fault scenario, so the central correctness claim is unsupported.
- [Section IV (data fusion algorithm, steps a-f)] The TMR-based data fusion scheme is presented as a single hand-worked numerical example. The deviation threshold in step (f) is not defined, the look-back number N is chosen arbitrarily, and the rule for replacing missing or erroneous readings with the last composite value has no correctness analysis. The statement that the algorithm 'detects and corrects hard faults, soft faults, intermittent faults, and transient faults' is not backed by a proof, a simulation, or a sensitivity study. In particular, the paper does not show that the composite estimate remains equal to the true sensed parameter when two of the three inputs are faulty (one physical and one digital twin), which is the scenario claimed in the conclusion.
- [Section II and Reference [17]] The entire switching mechanism depends on an anomaly detector that is an unpublished, self-authored manuscript [17]. Its detection reliability, reaction time, false-alarm rate, and miss rate are unknown, yet the proposed architecture requires this detector to identify faults, substitute digital twins, and later disconnect twins that drift. Without characterizing this component or replacing it with a fully specified detector, the system-level reliability claim cannot be assessed. This is particularly serious because the anomaly detector is the block that decides when the digital twin is trusted in the majority vote.
minor comments (4)
- [Figure 3 caption] The caption contains an incomplete sentence: 'TFT. TFT struggles to learn the voltage data...' The first 'TFT.' should be removed or completed.
- [Section IV, step (b)] The composite output is given as 7.20, which is the average of (6.66, 7, 7.66, 7.66, 7); the rounding and precision conventions should be stated explicitly to avoid apparent arithmetic ambiguities.
- [Section III.A] The text says '6500 minutes... corresponds to 10000 total readings' and later '3400 minutes, which corresponded to 5000 real data readings.' Given the stated 31-second sampling interval, the relationship between minutes and number of readings should be clarified, as the numbers are not self-explanatory.
- [Throughout] The manuscript uses inconsistent spelling ('IoT' vs. 'IOT') and some sentences are run-ons, e.g., in the introduction: 'The abnormal or unexpected behavior of a sensor node is called a fault in the sensor [5, 6]. The fault in active mode deviates...' A careful copyedit is needed.
Circularity Check
Central multiple-fault claim is carried by a self-cited unpublished anomaly detector [17] and by a data-fusion rule that defines 'correct' as the composite average of the very readings it is supposed to correct; the Prophet/TFT forecast evaluations themselves are genuine out-of-sample predictions.
-
self citation load bearing
[Section II, first paragraph (proposed structure description)]
"The actual implementation envisions each critical IoT device to be triplicated and the output of each device is connected to an anomaly detector of the type discussed in [17]. This anomaly detector is based on the use of an AI/ML-based software model, and it detects mismatches among the IoT device outputs reliably and with a short reaction time."
The entire switching mechanism of the proposed TMR structure—disconnect a faulty IoT device and substitute its digital twin—and therefore the Section V conclusion that the structure 'is able to output the correct value... under multiple fault conditions' depends on the anomaly detector actually detecting mismatches with short reaction time. That property is not demonstrated in this paper; it is imported from [17], an unpublished manuscript by three of the same authors (Baranwal, Varada, Das). No false-alarm/miss rates, thresholds, or independent evaluation are provided, so the load-bearing premise is accepted on the authors' own authority rather than on external evidence. This is a load-bearing self-citation, not a minor reference.
-
self definitional
[Section IV, data fusion algorithm steps (b) and (f)]
"each element of a sensor reading value is compared with the Composite Value (which is the best estimate at any given point) and if the deviation is more than a 'threshold', the sensor reading is deemed erroneous and needs to be corrected. In that case, the erroneous reading is replaced with the last composite value. This algorithm detects and corrects hard faults, soft faults, intermittent faults, and transient faults."
The algorithm's 'best estimate' (Composite Value) is defined as the average of the three sensor readings, including any faulty ones. A reading is labeled erroneous only when it deviates from this average, and is then replaced with the average. Hence the fusion output is by construction within threshold of the average of the inputs; it never establishes that this average equals the true sensed parameter. The Section V claim that the TMR structure outputs the correct value when one sensor has a hard fault and another has a soft/transient/intermittent fault therefore reduces to the assumption that the composite of possibly faulty readings is correct. No ground-truth comparison or fault-injection test is provided, so 'correct value' is defined relative to the fusion block's own output.
full rationale
No circularity was found in the core forecast demonstration: Prophet and TFT are trained on past Intel Berkeley readings and evaluated on held-out future readings, so those plots (Figures 2 and 3) are genuine out-of-sample predictions. The circularity attaches to the paper's system-level conclusion (Section V). First, the switching that preserves majority voting depends on the anomaly detector of [17], an unpublished self-citation by the same authors, whose reliability ('detects mismatches... reliably and with a short reaction time') is asserted without data. Second, the Section IV fusion algorithm treats the composite average of the three sensor streams as the 'best estimate', then declares any reading that deviates from that composite erroneous and replaces it with the composite; the final output is therefore close to the composite by construction, and the claim that this output is the 'correct value' under one hard plus one soft/transient/intermittent fault is not independently established. The acknowledged voltage weakness (Section III.C: 'TFT struggles to learn the voltage data'; 'For clean data, even for voltage, the TFT model should work very well') is a missing-support/correctness-risk issue rather than a circularity, but it reinforces that the two-day repair-window premise is not demonstrated. Because the central fault-tolerance claim reduces partly to a self-citation and partly to a self-referential correction rule, while the forecasting component itself is independently evaluated, a score of 6 is appropriate.
Assumptions & free parameters
free parameters (5)
- Anomaly detector threshold and reaction time
- Data fusion deviation threshold
- Data fusion look-back N
- Prophet training window and prediction horizon =
6500 minutes train, 3400 minutes predict
- TFT context and forecast horizons =
4 days context, 2 days forecast
assumptions (6)
- domain assumption The future behavior of each sensed signal follows the same statistical patterns as its past (stationarity or learnability).
- ad hoc to paper The anomaly detector [17] reliably detects faults and switches digital twins in and out without error or significant delay.
- domain assumption A software twin's output can be treated as a valid third vote in the majority-voting scheme.
- ad hoc to paper The averaging-and-replacement heuristic in the data fusion block preserves the true parameter estimate under multiple simultaneous faults.
- ad hoc to paper TFT would track voltage well on 'clean' data.
- standard math Standard definitions of time series components (trend, seasonality, cycle, noise) and TMR majority voting are accepted.
Cite this review
Pith. "Pith review of Fault-Tolerant IoT System Using Software-Based "Digital Twin"." pith.science (2026). https://pith.science/paper/C3QRPARO
@misc{pith2026250524047,
  author       = {Pith},
  title        = {Pith review of: Fault-Tolerant IoT System Using Software-Based "Digital Twin"},
  year         = {2026},
  howpublished = {\url{https://pith.science/paper/C3QRPARO}},
  note         = {Machine review of arXiv:2505.24047}
}
read the original abstract
In this article, we present a novel redundancy scheme to realize a fault-tolerant IoT structure for application in high-reliability systems. The proposed fault-tolerant structure uses a centralized data fusion block and triplicated IoT devices, along with software-based "digital twins", that duplicate the function of each of the sensors. In case of a fault in one of the IoT devices, the pertinent digital twin takes over the function of the actual IoT device for some time in the triplicated structure till the faulty device is either replaced or repaired when possible. The use of software-based digital twins as a duplicate for each physical sensor improves the reliability of the operation with minimal increase in the overall system cost.
Figures


Reference graph
Works this paper leans on
-
[17]
Tanish Baranwal, Srihari Varda, Santanu Das, and Arnab Das, “Ma- chine Learning-Based Anomaly Detection of Correlated Sensor Data: An Integrated Principal Component Analysis-Autoencoder Approach”, Unpublished Paper, October 2023
work page 2023
-
[1]
Internet of Things (IoT), https://en.wikipedia.org/wiki/Internet of things
-
[2]
Internet of Things (IoT): What it is and why it matters, https://www.sas.com/en us/insights/big-data/internet-of-things.html
-
[3]
Fault Tolerance strategies for Wireless Sensor Networks – A Comprehensive Survey
M Shyama & Anju S Pillai. “Fault Tolerance strategies for Wireless Sensor Networks – A Comprehensive Survey”, 15-16 November 2018. (https://ieeexplore.ieee.org/abstract/document/9034298/)
-
[4]
Fault tolerant and scalable IoT-based architecture for health monitoring
Gia, T. N., Rahmani, A. M., Westerlund, T., Liljeberg, P., & Tenhunen, H. (2015, April). “Fault tolerant and scalable IoT-based architecture for health monitoring”. In 2015 IEEE Sensors Applications Symposium (SAS) (pp. 1-6). IEEE (https://ieeexplore.ieee.org/abstract/document/7133626/ )
-
[5]
Fault detection of wireless sensor networks
Myeong-Hyeon Lee, Yoon-Hwa Choi “Fault detection of wireless sensor networks” Computer Communications V olume 31, Issue 14, 5 September 2008, Pages 3469-3475
work page 2008
-
[6]
Automated Fault Diagnosis in Wireless Sensor Networks: A Comprehensive Survey
Swain, R.R., Dash, T. & Khilar, P.M. “Automated Fault Diagnosis in Wireless Sensor Networks: A Comprehensive Survey”. Wireless Pers Commun 127, 3211–3243 (2022). https://doi.org/10.1007/s11277-022- 09916-3
-
[7]
Adday, G.H.; Subramaniam, S.K.; Zukarnain, Z.A.; Samian, N. “Fault Tolerance Structures in Wireless Sensor Networks (WSNs): Sur- vey, Classification, and Future Directions”. Sensors 2022, 22, 6041. https://doi.org/10.3390/s22166041
Show all 24 references
-
[8]
Detection, identification, and quan- tification of sensor fault
J. Kullaa, “Detection, identification, and quan- tification of sensor fault” PROCEEDINGS OF ISMA2010 INCLUDING USD2010 (https://past.isma- isaac.be/downloads/isma2010/papers/isma2010 0205.pdf)
-
[9]
Fault- Tolerant Approaches for IoT Integrated Smart City
Dr. Hitesh Mohapatra, Dr. Soumya Ranjan Mishra “Fault- Tolerant Approaches for IoT Integrated Smart City” Academia Engineering Special Issues, February 2024 (https://www.academia.edu/journals/academia-engineering/special- issues/10/Fault-Tolerant-Approaches-for-IoT-Integrated-...
2024
-
[10]
Redundancy and its applications in wireless sensor net- works: A survey
Curiac, D. I., V olosencu, C., Pescaru, D., Jurca, L., & Doboli, A. (2009). “Redundancy and its applications in wireless sensor net- works: A survey”. WSEAS Transactions on Computers, 8(4), 705-714. (https://www.academia.edu/download/77020360/29-149.pdf)
2009
-
[11]
Analysis on the redundancy of wireless sensor networks
Gao, Y ., Wu, K., & Li, F. (2003, September). “Analysis on the redundancy of wireless sensor networks”. In Proceed- ings of the 2nd ACM international conference on Wireless sensor networks and applications (pp. 108-114). (https://cmps- people.ok.ubc.ca/yongg/research/papers/se...
2003
-
[12]
A survey on wireless sensor networks deployment
Bojkovic, Z., & Bakmaz, B. (2008). “A survey on wireless sensor networks deployment”. WSEAS Transactions on Communications, 7(12), 1172-1181. (http://www.wseas.us/e- library/transactions/communications/2008/28-466.pdf)
2008
-
[13]
Redundancy as a measure of fault-tolerance for the Internet of Things: A review
Rullo, A., Serra, E., & Lobo, J. (2019). “Redundancy as a measure of fault-tolerance for the Internet of Things: A review”. Policy-Based Autonomic Data Governance, 202-226. (https://link.springer.com/chapter/10.1007/978-3-030-17277-0 11)
2019 doi
-
[14]
Using redundancy to de- tect security anomalies: towards IoT security attack detectors: ubiquity symposium: the internet of things
Roopak Venkatakrishnan, Mladen A. V ouk ,“Using redundancy to de- tect security anomalies: towards IoT security attack detectors: ubiquity symposium: the internet of things”, Ubiquity, V olume 2016, Number January (2016), Pages 1-19 (https://dx.doi.org/10.1145/2822881)
2016 doi
-
[15]
”What is a digital twin?” (https://www.ibm.com/topics/what-is-a- digital-twin), June 2022
2022
-
[16]
Wikipedia, The Free Encyclopedia, 16 Feb
”Triple modular redundancy.” Wikipedia, The Free Encyclopedia. Wikipedia, The Free Encyclopedia, 16 Feb. 2024. Web. 26 Feb. 2024
2024
-
[18]
10 Incredibly Useful Time Series Forecasting Algorithms
Gavita Regunath & Dan Lantos, “10 Incredibly Useful Time Series Forecasting Algorithms”, Advancing Analytics, (https://www.advancinganalytics.co.uk/blog/2021/06/22/10- incredibly-useful-time-series-forecasting-algorithms), June 22, 2021
2021
-
[19]
Time Series Analysis using Facebook Prophet
Geeks for Geeks. “Time Series Analysis using Facebook Prophet” (https://www.geeksforgeeks.org/time-series-analysis-using-facebook- prophet/), January 31, 2024
2024
-
[20]
Interpretable Deep Learn- ing for Time Series Forecasting
Sercan O. Arik and Tomas Pfister, “Interpretable Deep Learn- ing for Time Series Forecasting”, Google Research, Decem- ber 13, 2021 (https://blog.research.google/2021/12/interpretable-deep- learning-for-time.html)
2021
-
[21]
Time Series Forecasting using Kalman Filter
Mehul Gupta, “Time Series Forecasting using Kalman Filter”, July 31, 2022, (https://medium.com/data-science-in-your-pocket/time- series-forecasting-using-kalman-filter-814e9171d780)
2022
-
[22]
Intel Berkeley Research Lab Sensor Data
Divyansh Agrawal, “Intel Berkeley Research Lab Sensor Data”, Feb 06, 2020, (https://www.kaggle.com/datasets/divyansh22/intel- berkeley-research-lab-sensor-data)
2020
-
[23]
Tempo- ral Fusion Transformers for Interpretable Multi-horizon Time Series Forecasting
Bryan Lim, Sercan O. Arik, Nicolas Loeff, Tomas Pfister “Tempo- ral Fusion Transformers for Interpretable Multi-horizon Time Series Forecasting”, September 27, 2020, (https://arxiv.org/)
2020
-
[24]
Mitchell, Multi-Sensor Data Fusion, 2010, Section 3.3, Pages 33-44
H.B. Mitchell, Multi-Sensor Data Fusion, 2010, Section 3.3, Pages 33-44
2010
Reviewed August 7, 2026 · model on record in the stance chip above.
Discussion (0). Sign in to comment.