REVIEW 3 major objections 4 minor 6 references
Inferring Obscured Cosmic Black Hole Accretion History from AGN Found by JWST/MIRI CEERS Survey
T0 review · 3 major / 4 minor · reviewed 2026-08-07 · deepseek-v4-flash
Pith's one-line read Obscured black hole growth peaked at z 1-3 in JWST census
desk verdict First JWST/MIRI AGN luminosity function and BHAD, worth refereeing despite a garbled Vmax equation and heavy reliance on fixed faint-end slopes. read the letter →
The pith
A machine-rendered reading of the paper's core claim, the machinery that carries it, and where it could break.
The reading
What carries the argument
The load-bearing objects are the rest-frame 8-1000 micron AGN luminosity functions, built with the 1/Vmax estimator from the MIRI-selected sample and fit with a modified Schechter function (faint-end slope fixed at $\alpha$ = 1.2 or 1.5, $\sigma$ = 0.5) and with a double power law (slopes fixed from the literature). The conversion to accretion density uses $$\rho_{\mathrm{LF}} = \int L\,\$\varphi$(L)\,d\log L \times \frac{1-\varepsilon}{\varepsilon $c^{2}$}$$ with epsilon = 0.1, while the direct estimate converts SED-fit accretion-disk luminosities through $$\mathrm{BHAR} = \frac{L_{\mathrm{disk}}(1-\varepsilon)}{\varepsilon $c^{2}$}$$. The machinery's work is to extrapolate a sparse, flux-limited sample to the faint population and to expose how much the choice of LF functional form moves the inferred peak redshift.
What would settle it
Take a deep JWST MIRI field with enough sources in the z=2-3 bins to fit the faint-end LF slope directly (or stack Chandra/XMM data on the CEERS MIR-selected AGNs): if the measured slope matches the Lacy et al. value near gamma~1 or if stacked X-rays imply the same BHAR as the MIR-derived rho_LF, the early z~3 peak and the X-ray-missed population claimed here would not survive.
Extended reading notes
Core claim
The paper's central claim is that the obscured AGN population discovered in the JWST CEERS mid-infrared data has a black hole accretion history that peaks at z~1-3 rather than at lower redshift, and that the luminosity-function-based estimate extends to $10^{7}$ Lsun, revealing a faint obscured population absent from pre-JWST samples. For the direct disk-luminosity estimate and the double-power-law LF, the peak sits at z~1-2; for the modified Schechter LF it sits at z~2-3. At z~3 the LF-based rho_LF exceeds the X-ray-derived BHAD of Aird et al. and Ananna et al., which the paper interprets as evidence that mid-infrared selection recovers obscured AGNs missed by X-rays. The paper is explicit that the differences are within overlapping error bars and that the fixed faint-end slopes shape where the peak falls, so the claim is an initial exploration rather than a definitive measurement.
Load-bearing premise
The luminosity function shapes below the survey's completeness limit, especially the faint-end slopes, are borrowed from earlier datasets rather than measured here, and those borrowed slopes can move the inferred peak from z~2 to z~3.
Editorial extensions
If this is right
- Faint obscured AGNs down to 10^7 Lsun are now measurable with JWST, so the faint end of the AGN luminosity function no longer has to be extrapolated from brighter samples.
- If the z~2-3 Schechter peak holds, the most rapid obscured black hole growth occurred before or coincident with the cosmic star-formation peak at z~2, a timing that current formation models do not naturally produce.
- At z~3, a mid-infrared-selected BHAD that sits above X-ray estimates implies a population of heavily obscured AGN that hard X-ray surveys undercount.
- The peak redshift shifts by roughly one unit in z between LF models, so future accretion-history claims must treat LF form as a systematic uncertainty, not just fit noise.
- Larger JWST mid-infrared samples should determine whether the BHAD-to-star-formation ratio rises, the signature that would force revision of current co-evolution models.
Reading between the lines
- Fit the faint-end slope of the CEERS MIR AGN LF as a free parameter: the resulting value would directly quantify how far the fixed literature slopes bias the peak redshift.
- Stack the X-ray data already available in the CEERS field under the MIR-selected AGNs; if the stacked X-ray luminosity implies the same BHAR as the mid-infrared rho_LF at z~3, the claimed X-ray-missed population would be ruled out.
- Apply the same LF construction to wider MIRI surveys to shrink redshift bins from ~1 to ~0.3, turning the broad z=1-3 peak into a testable evolutionary sequence.
- Compare this obscured-selected BHAD with a Type I/optically selected BHAD at identical redshifts to separate the growth history from the redshift evolution of the obscured fraction.
Editorial analysis
A structured set of objections, weighed in public.
Referee Report
Summary. The paper estimates the cosmic black hole accretion density (BHAD) of obscured AGNs using 41 JWST/MIRI CEERS sources (11 AGNs and 30 composites with f_AGN,IR > 0.2). Two approaches are used: (i) a direct sum of black hole accretion rates (from CIGALE L_disk) divided by a redshift-bin volume (Eq. 3), and (ii) construction of rest-frame TIR AGN luminosity functions (LFs) fit with modified Schechter and double power-law forms, then integrated to derive rho_LF (Eq. 9). The LFs are fit only above a luminosity limit (10^9 or 10^10 L_sun) but are integrated down to 10^7 L_sun using faint-end slopes fixed from the literature. The results suggest BHAD peaks at z~1-2 for the direct method and the double power law, and at z~2-3 for the modified Schechter function, with a possible excess over X-ray estimates at z~3. The authors explicitly acknowledge the small sample and the model dependence of the peak redshift.
Significance. If the results hold, this is the first JWST MIR-rest-frame AGN luminosity function and BHAD estimate reaching two orders of magnitude fainter than pre-JWST surveys. The paper is transparent about its limitations and provides a useful comparison of three LF models. It also proposes a concrete, falsifiable claim: MIR observations may reveal obscured AGNs missed by X-ray surveys at z~3. However, the central results rest on two extrapolations whose validity is not fully demonstrated: the Vmax correction and the integration of LFs far below the fitted luminosity range. The statistical power is limited by the sample of 41 sources, and the error bars shown in Figure 2 may underrepresent the uncertainty from the fixed slopes and the small-number Poisson noise. Given these caveats, the paper is an interesting exploratory study but its quantitative conclusions require additional verification.
major comments (3)
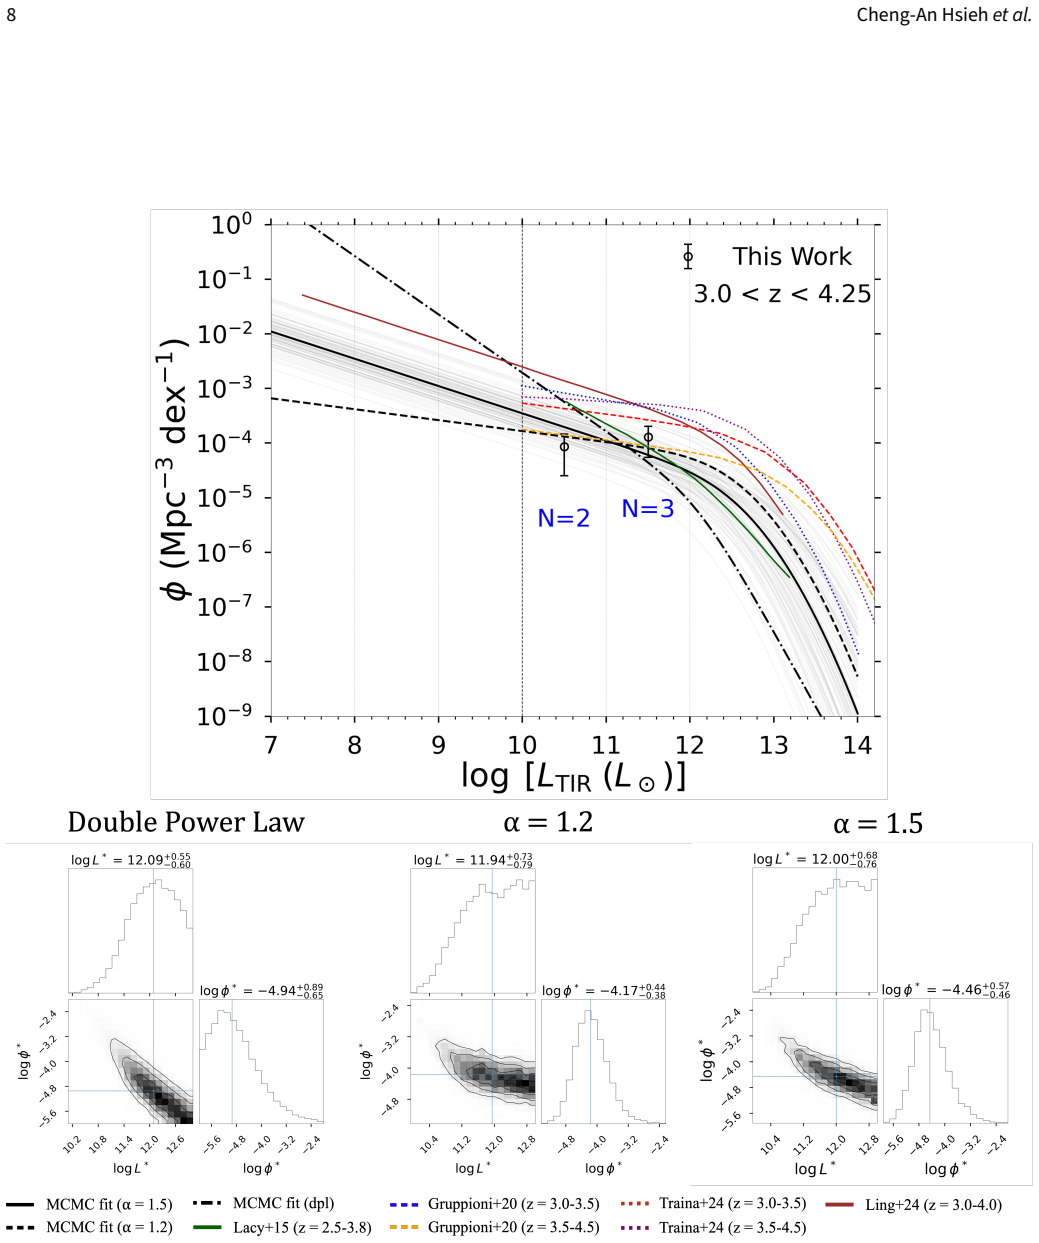
- [Section 2.2, Eq. (4)] The LF is fit only to data with L_TIR > 10^9 or 10^10 L_sun, yet rho_LF is integrated down to 10^7 L_sun (Eq. 9). The faint-end slopes (alpha = 1.2, 1.5 and gamma1) are fixed to values from the literature (Gruppioni et al. 2013; Lacy et al. 2015; Ling et al. 2024) because they cannot be constrained by the current data. The z~2-3 peak of the modified Schechter-based rho_LF is therefore largely inherited from these fixed slopes and the extrapolation. The paper acknowledges in Section 4 that 'the choice of LF model can influence the inferred BHAD evolution,' but it does not quantify how the fixed slopes or the integration limit affect the peak. Please provide a robustness test, for example by varying the slopes over their published uncertainties or by integrating only over the luminosity range actually probed by the data, and discuss how the peak redshift shifts.
- [Section 3.1 and Figure 2] The MCMC parameters in Table 1 have large uncertainties (e.g., L* with ~1 dex), yet the rho_LF error bars in Figure 2 appear quite small. The text says the 1-sigma uncertainties come from the MCMC results, but it is unclear whether the uncertainty in the fixed slopes (alpha, gamma1) is propagated. If the integration is performed using the best-fit L* and phi* while keeping the slopes fixed at their adopted values, the quoted errors will under-represent the total model uncertainty. In addition, the paper uses a Gaussian likelihood in log space (Eq. 8) for the LF fit, but some luminosity bins contain only one source, and empty bins are not included. A Poisson likelihood or a likelihood that handles upper limits would be more appropriate for these small counts. Please clarify the error propagation and justify the use of a Gaussian likelihood for such sparse bins.
- [Equation (9) and Abstract] The lower integration limit in Eq. (9) appears to be '8' rather than '7', which would be inconsistent with the abstract's statement that 'both rho_LF extend to luminosities as low as 10^7 L_sun.' If this is a typesetting error, please correct it; if not, the discrepancy between the integration limit and the stated minimum luminosity must be resolved, since it directly affects the integrated BHAD values.
minor comments (4)
- [General] There are several typographical and grammatical issues that should be corrected, including 'ploted' in the Figure 2 caption, 'consisting with' instead of 'consistent with' in Section 4, and 'lFs' in Section 5. These do not affect the science but should be fixed in revision.
- [Section 3.1] The sentence 'with which the majority of the AGN LFs in this study intersect' is incomplete and should be rephrased. Also, the comparison to the galaxy LFs of Gruppioni et al. (2020) and Ling et al. (2024) would benefit from a clearer statement of whether the AGN LF is expected to lie below the total galaxy LF, since the present sample excludes SFGs with f_AGN,IR < 0.2.
- [Section 2.1] The text says the AGN sample is defined by f_AGN,IR >= 0.5, but later states that composites and AGNs are taken as the galaxy sample (f_AGN,IR > 0.2). Please clarify the exact selection used for the BHAD and LF analyses, as the difference matters for the interpretation of the luminosity functions.
- [Section 2.2] Equation (3) uses the notation Vmax,i but the text afterward refers to Vmax as a single quantity; clarify whether the sum is over individual sources with different Vmax or over redshift bins with the same Vmax. Also define the cosmology used in the comoving volume calculation.
Circularity Check
No load-bearing circularity: the direct Ldisk BHAD is independent, and the LF-based BHAD is a transparent model extrapolation using literature-fixed slopes, not a derivation that reduces to its own inputs.
full rationale
The paper's central derivation chain is self-contained at the level of the direct estimate: Eq. (3) sums CIGALE-based BHAR values divided by Vmax, so rho_Ldisk is an empirical estimator with no fitted parameter reintroduced as a prediction. The LF-based rho_LF is obtained by fitting L* and phi* of three luminosity-function forms to binned 1/Vmax data (Eqs. 5-7) and then integrating L phi(L) (Eq. 9). That integral is a standard conversion from luminosity density to accretion density, not a circular identity: the fitted parameters are constrained by the binned data points, and the faint-end slopes in the initial fits are fixed from external literature values (Gruppioni et al. 2013; Lacy et al. 2015; Ling et al. 2024). The paper does not hide this dependence; Section 4 states 'the choice of LF model can influence the inferred BHAD evolution' and explicitly varies alpha and the double-power-law gamma1 to explore it. The self-citations (Chien et al. 2024 catalog, Ling et al. 2024 slopes and completeness limits, Kim et al. 2024 comparison) are prior data products and measurements rather than uniqueness theorems or ansatze used to forbid alternatives. No equation in the paper reduces to an input by construction: for example, the modified-Schechter peak at z~2-3 is not equal to the fixed alpha by itself; it also depends on the fitted L* and phi* evolution. The suspicious Vmax expression (Eq. 4) is an estimator-validity concern, not a circularity: even if it miscomputes per-source maximum volumes, it is an input to the binned LF rather than a quantity that is predicted from the LF. Overall, the derivation is model-dependent but not circular, and the minor same-group citations do not make the central BHAD conclusions forced by definition.
Assumptions & free parameters
free parameters (5)
- L* (characteristic luminosity) per redshift bin and LF model =
log L*/Lsun ~ 11.3 to 12.5 (Table 1)
- φ* (normalization) per redshift bin and LF model =
log φ*/Mpc^-3 dex^-1 ~ -3.7 to -5.3 (Table 1)
- Modified Schechter faint-end slope α =
1.2 and 1.5 (fixed, not fitted)
- Modified Schechter bright-end width σ =
0.5 (fixed, not fitted)
- Double power law slopes γ1 and γ2 =
γ1 ~ 0.55 to 0.66 when fitted in Section 4 (Table 2); γ2 fixed from Lacy et al. 2015
assumptions (6)
- domain assumption The CIGALE-derived AGN accretion disk luminosity and AGN fraction correctly separate the AGN from the host galaxy in the SED fits of Chien et al. (2024).
- domain assumption The Vmax method in Eq. 4 correctly gives the maximum observable volume for each source.
- domain assumption The 10 μm 80% completeness flux limit from Ling et al. (2022) and Wu et al. (2023) accurately describes the MIRI detection threshold, and the survey covers 9.2 arcmin^2.
- ad hoc to paper The chosen LF functional forms (modified Schechter and double power law) remain valid when extrapolated below the completeness limit to luminosities as low as 10^7 Lsun.
- standard math The radiative efficiency ε = 0.1 and the conversion BHAR = L_disk(1-ε)/(ε c^2) are appropriate.
- standard math A flat ΛCDM cosmology as implemented in Astropy is assumed for comoving volume calculations.
Cite this review
Pith. "Pith review of Inferring Obscured Cosmic Black Hole Accretion History from AGN Found by JWST/MIRI CEERS Survey." pith.science (2026). https://pith.science/paper/I67VOEYY
@misc{pith2026250524308,
  author       = {Pith},
  title        = {Pith review of: Inferring Obscured Cosmic Black Hole Accretion History from AGN Found by JWST/MIRI CEERS Survey},
  year         = {2026},
  howpublished = {\url{https://pith.science/paper/I67VOEYY}},
  note         = {Machine review of arXiv:2505.24308}
}
abstract
This study presents the black hole accretion history (BHAH) of obscured active galactic nuclei (AGNs) identified from the JWST CEERS survey by Chien et al. (2024) using mid-infrared (MIR) SED fitting. We compute black hole accretion rates (BHARs) to estimate the black hole accretion density (BHAD), $\rho_{L_{\mathrm{disk}}}$, across $0 < z < 4.25$. MIR luminosity functions (LFs) are also constructed for these sources, modeled with modified Schechter and double power law forms, and corresponding BHAD, $\rho_{\mathrm{LF}}$, is derived by integrating the LFs and multiplying by the luminosity. Both $\rho_{\mathrm{LF}}$ extend to luminosities as low as $10^7 \, L_{\odot}$, two orders of magnitude fainter than pre-JWST studies. Our results show that BHAD peaks between redshifts 1 and 3, with the peak varying by method and model, $z \approx 1$--2 for $\rho_{L_{\mathrm{disk}}}$ and the double power law, and $z \approx 2$--3 for the modified Schechter function. A scenario where AGN activity peaks before cosmic star formation would challenge existing black hole formation theories, but our present study, based on early JWST observations, provides an initial exploration of this possibility. At $z \sim 3$, $\rho_{\mathrm{LF}}$ appears higher than X-ray estimates, suggesting that MIR observations are more effective in detecting obscured AGNs missed by X-ray observations. However, given the overlapping error bars, this difference remains within the uncertainties and requires confirmation with larger samples. These findings highlight the potential of JWST surveys to enhance the understanding of co-evolution between galaxies and AGNs.
Figures


Figures from the paper (6 more)




Reference graph
Works this paper leans on
-
[5]
Monthly Notices of the Royal Astronomical Society451 (2): 1892–1927. Ananna, Tonima Tasnim, Ezequiel Treister, C Megan Urry, Claudio Ricci, Allison Kirkpatrick, Stephanie LaMassa, Johannes Buchner, Francesca Civano, Michael Tremmel, and Stefano Marchesi
work page 1927
-
[167]
arXiv: 2206.14220 [astro-ph.IM]
https://doi.org/10.3847/1538- 4357/ac7c74. arXiv: 2206.14220 [astro-ph.IM]. Boquien, M, D Burgarella, Y Roehlly, V Buat, L Ciesla, D Corre, AK Inoue, and H Salas
-
[1984]
Astrophysical Journal, Part 2-Letters to the Editor (ISSN 0004-637X), vol
The infrared astronomical satellite (iras) mission. Astrophysical Journal, Part 2-Letters to the Editor (ISSN 0004-637X), vol. 278, March 1, 1984, p. L1-L6. Research supported by the Science and Engineering Re- search Council and NASA. 278:L1–L6. Rodighiero, Gea, Marcella Brusa, E Daddi, M Negrello, JR Mullaney, Ivan Delvecchio, D Lutz, A Renzini, Alberto...
work page 1984
-
[2018]
Monthly Notices of the Royal Astronomical Society 475 (2): 1887–1911
Linking black hole growth with host galaxies: the accretion–stellar mass relation and its cosmic evolution. Monthly Notices of the Royal Astronomical Society 475 (2): 1887–1911. Yang, G, KI Caputi, C Papovich, P Arrabal Haro, MB Bagley, P Behroozi, EF Bell, L Bisigello, V Buat, D Burgarella, et al
work page 1911
-
[2021]
Supermassive black holes in cosmological simulations i: m bh- m⋆ relation and black hole mass function.Monthly Notices of the Royal Astronomical Society503 (2): 1940–1975. Heckman, TM, R Gonzalez-Delgado, C Leitherer, GR Meurer, J Krolik, AS Wilson, A Koratkar, and A Kinney
work page 1940
-
[2023]
The xxl survey lii: the evolution of radio agn luminosity function determined via parametric methods from gmrt, atca, vla and cambridge interferometer observations. arXiv preprint arXiv:2312.14683. Stefanon, Mauro, Haojing Yan, Bahram Mobasher, Guillermo Barro, Jen- nifer L Donley, Adriano Fontana, Shoubaneh Hemmati, Anton M Koeke- moer, BoMee Lee, Seong-...
Reviewed August 7, 2026 · model on record in the stance chip above.
Discussion (0). Sign in to comment.