REVIEW 4 major objections 5 minor 31 references
Inhomogeneous mark correlation functions for general marked point processes
T0 review · 4 major / 5 minor · reviewed 2026-08-07 · deepseek-v4-flash
Pith's one-line read Inhomogeneous mark correlation functions, defined as intensity-weighted ratios of pair correlations, detect mark association and variation in uneven spatial point patterns where stationary versions fail.
desk verdict A natural and practically motivated extension of mark correlation to inhomogeneous patterns, with convincing simulations but a real gap in the theoretical definition: the distance-only estimand and its normalization rely on an unstated mark-independence assumption. read the letter →
The pith
A machine-rendered reading of the paper's core claim, the machinery that carries it, and where it could break.
The reading
What carries the argument
The central object is the inhomogeneous mark correlation function $\kappa^{\mathrm{inhom}}_{tf}(r) = \lambda^{(2)}_{w,tf}(r)/\lambda^{(2)}_w(r)$, the ratio of the mark-weighted, intensity-reweighted second-order product density to the intensity-reweighted pair correlation function of the ground process. The weight $w(x,y)=1/(\lambda(x)\lambda(y))$ removes the distorting effect of spatial inhomogeneity, and the proposed estimators are ratio-unbiased kernel-based plug-in estimators that use an estimated intensity. Because the definition is built as a ratio of pair-correlation-type quantities, the same construction extends to inhomogeneous K-functions and J-functions, giving mark-weighted versions of those summary statistics as well.
What would settle it
Simulate a Poisson process with a strong intensity gradient and assign marks independently from a location-dependent distribution, for example with mean mark increasing linearly with x. If the distance-only claim is right, $\kappa^{\mathrm{inhom}}_{mm}(r)$ should be close to one for all r; if it deviates from one or shifts with the observation window or smoothing bandwidth, the function is not purely distance-dependent.
Extended reading notes
Core claim
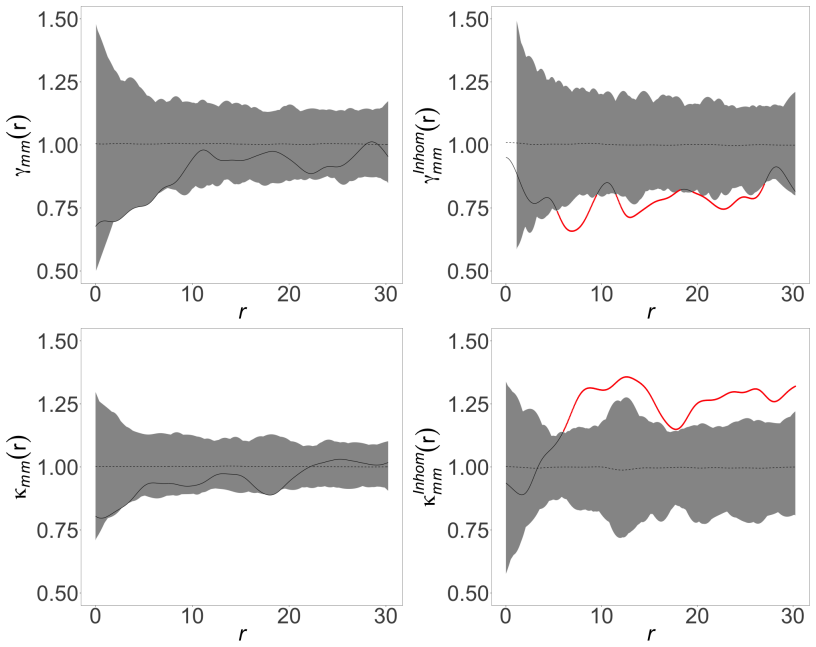
The central claim is that defining the inhomogeneous mark correlation function as the ratio of the mark-weighted inhomogeneous pair correlation function to the inhomogeneous pair correlation function of the ground process yields a distance-dependent summary of mark association/variation that remains valid under second-order intensity-reweighted stationarity. With the weight factor $1/(\lambda(x)\lambda(y))$, the unnormalised function becomes a ratio of two intensity-corrected product densities, and the normalising constants are the global mean square mark for Stoyan's mark correlation function and the mark variance for the mark variogram. Simulation results show that the homogeneous versions fail under inhomogeneity—missing associations, detecting the wrong sign, or misidentifying the spatial range—while the inhomogeneous versions identify the imposed association or variation in the large majority of patterns. The method is formulated for general state spaces with real-valued marks, and the two forest applications demonstrate that ecological conclusions about tree growth can change substantially once spatial intensity is taken into account.
Load-bearing premise
After intensity weighting, the mark pair density must depend on location only through the interpoint distance; otherwise the estimator is not a pure function of distance, and results may depend on the observation window and the local mark distribution.
Editorial extensions
If this is right
- For inhomogeneous patterns, homogeneous mark correlation functions can miss the vast majority of real mark associations: the detection rate for the inhomogeneous Poisson scenario was 100% with the new function versus 15% with Stoyan's classical function.
- The inhomogeneous mark variogram identifies both the sign and the spatial range of mark variation, whereas the homogeneous variogram often stays inside the random-labelling envelope and detects nothing.
- The ratio formulation generalises beyond pair correlation, so inhomogeneous mark-weighted K-functions and J-functions can be defined and interpreted in the same way.
- In the Longleaf pine analysis, intensity correction flips the conclusion: homogeneous methods suggest negative dbh association at short distances, while the inhomogeneous function shows positive association across the whole range considered.
Reading between the lines
- A natural robustness check not reported by the paper: simulate marks that have a spatial trend but are independent of interpoint distance, and check whether $\kappa^{\mathrm{inhom}}_{mm}(r)$ stays near one; if it drifts with the bandwidth or window, the distance-only interpretation is not universal.
- Because the estimators plug in an estimated intensity, their performance under misspecified or poorly smoothed intensity is an open question; the reported high detection rates assume a reasonably accurate intensity estimate.
- The authors mention extensions to linear networks and multivariate/cross characteristics; those extensions are plausible but will need network-specific edge corrections and redefined normalization factors to avoid bias.
- The method is stated for general state spaces and real-valued marks, so with suitable normalisation it could be carried over to function-valued or graph-valued marks, though the independence baselines would need to be reworked.
Editorial analysis
A structured set of objections, weighed in public.
Referee Report
Summary. The paper proposes a class of inhomogeneous mark correlation functions for marked point processes with real-valued marks, obtained by replacing the homogeneous pair correlation functions in the classical ratio formulation with intensity-reweighted (inhomogeneous) pair correlation functions. Nonparametric kernel estimators are introduced, including a claimed ratio-unbiased estimator. The methodology is evaluated by simulation under inhomogeneous Poisson and log-Gaussian Cox processes with planted mark association or variation, and is applied to Longleaf pine (dbh) and Pfynwald Scots pine (height) data. The central empirical claim is that the inhomogeneous versions detect mark association/variation and its spatial range far more often than their homogeneous counterparts when the point intensity is spatially varying.
Significance. If the proposed functions are well-defined and their estimators have the claimed properties, the paper would fill a genuine gap: classical mark correlation functions assume stationarity, and applied ecologists regularly analyze marked patterns with strong intensity gradients. The simulation study is a useful stress test and the two forestry applications are relevant and clearly presented. The paper also connects the new objects to inhomogeneous K- and J-functions, which is a helpful conceptual extension. However, the central definitional and inferential issues described below mean that the manuscript in its current form does not yet establish that the estimand is a well-defined, window-independent summary of mark association for general inhomogeneous marked point processes.
major comments (4)
- [Section 3, Eqs. (8)-(9)] The definition of c_inhom_tf(r) as a function of the distance r alone is not justified. Second-order intensity-reweighted stationarity of the ground process only implies that the ground-process pair correlation g(u,v) depends on u,v through d(u,v); it imposes no restriction on the conditional mark density f^{(2)}(m,m'|u,v). In the numerator of (9), for a fixed r one integrates tf(m,m') f^{(2)}(m,m'|u,v) g(d(u,v)) over pairs whose locations are separated by r. If f^{(2)} varies with u and v, this integral is a window-dependent weighted average of location-specific mark expectations, not a pure function of r. The estimator (11) estimates exactly this window average. The authors should either state an explicit additional assumption, such as f^{(2)}(m,m'|u,v) depending on u,v only through d(u,v), or define the proposed functions as window-specific empirical summaries and discuss how the inferential target changes.
- [Lemma 1] The proof of Lemma 1 assumes f^{(2)}(m(u),m(v)|u,v)=f(m(u))f(m(v)) and then replaces the marginal mark densities by the global density f. This is the random-labelling null hypothesis, not the general case in which the estimator is used. When marks have a spatial trend, the null of 'no mark association' does not imply that the marginal mark distribution is location-independent; a process with no association between marks at nearby points but with a spatial gradient in the mark mean will have a location-dependent f(m|u). Under such a process, the normalization by the global mean square mark µ_m^2 does not make the ratio in (9) equal to 1 at large r, so the associated test can reject random labelling because of mark trend alone. The applications in Section 5 explicitly document spatial trends in dbh and height, so this is not a peripheral technicality. The lemma statement and proof need to state precisely which null model is assumed and what happens when that model fails.
- [Section 3.1, Eq. (13) and Section 6] The estimator (13) is called 'ratio-unbiased', but the ratio of two unbiased estimators is not unbiased in general, and no bias expression or asymptotic argument is provided. If the authors intend a weaker property, such as ratio-consistency under moment and bandwidth conditions, this should be stated and proved or cited. In addition, the estimators plug in an estimated intensity (e.g., (15)) into (11)-(12), and the effect of this plug-in step on bias and variance is not addressed. The claim in Section 6 that the estimators 'remain ratio-unbiased' is therefore unsupported and should be revised or removed until a precise statement is available.
- [Section 4] The simulation study evaluates power and type I error by comparing global envelope tests for the proposed and homogeneous functions, but it does not directly assess the bias or window-dependence of the proposed estimand under spatial mark trends. A concrete diagnostic would be to generate marks with a spatial trend but no pairwise association (e.g., independent marks with location-dependent mean) and check whether the proposed κ_inhom_mm and γ_inhom_mm stay near their null values across distances and across different observation windows. The current type I error study permutes the observed marks globally, which preserves the empirical mark distribution but does not generate a spatially varying mark distribution; it therefore does not address the concern raised in the definitional comments above. Adding such a simulation would clarify what the reported power rates are measuring.
minor comments (5)
- [Section 2, Eq. (4)] In (4), the normalization factor is written with ν(dm(x))ν(dm(y)) rather than f(m(x))f(m(y))ν(dm(x))ν(dm(y)); as written it suggests the reference measure itself is the mark distribution. Please clarify the notation.
- [Lemma 1 proof] The proof contains typos: the integrals mix dmpuqdvdmpyq, where the last differential should be dmpvq, and the variable y appears where v is intended. These should be corrected.
- [Section 4] The reported power and type I error rates are based on 100 simulated patterns, but no standard errors or confidence intervals are given. Given the observed rates (e.g., 9%, 6%, 7%), a small simulation summary with binomial standard errors would help the reader judge the Monte Carlo uncertainty.
- [Section 3, Eq. (10)] The K-function-based expression in (10) introduces L and e(x,y) without defining them in the display; L appears to be the observation window or network, and e(x,y) is presumably an edge-correction factor. Please define all symbols in the displayed equation.
- [Section 5.1] The word 'homogenous' appears in the discussion of the Longleaf application; it should be 'homogeneous'.
Circularity Check
No significant circularity: the inhomogeneous mark correlation functions are anchored to external inhomogeneous pair-correlation theory and evaluated on independently planted mark associations.
full rationale
The paper's core construction defines the inhomogeneous mark correlation function as the ratio of a mark-weighted inhomogeneous pair correlation function to the inhomogeneous pair correlation function of the ground process, following Baddeley et al. (2000) and standard Palm calculus. No parameter is fitted to a subset of data and then renamed as a prediction; the simulation study generates patterns with known mark associations and compares the proposed estimators against those known associations. The normalization factor in Lemma 1 is derived under a mark-independence assumption, which is the null hypothesis used for inference, not an input fitted from the data. Self-citations to Eckardt and Moradi (2024a, 2024b, 2025) appear only as literature pointers or for definitions of classical stationary mark correlation functions; they do not carry the derivation of the inhomogeneous estimators. The main unresolved mathematical concern is that the estimator may not be a distance-only summary when marks have a spatial trend, because the proof in Lemma 1 explicitly assumes mark independence; this is a well-definedness or identifiability gap, not a circular reduction. The paper also asserts ratio-unbiasedness in Section 6 without proof, but that is an unproven statistical claim rather than an input forced by construction. Overall, the derivation chain is self-contained relative to the external benchmarking used.
Assumptions & free parameters
free parameters (1)
- bandwidth of kernel intensity estimator =
selected per dataset by Cronie and van Lieshout (2018) criterion
assumptions (4)
- domain assumption The marked point process is second-order intensity-reweighted stationary, with the ground pair correlation depending only on distance (Eq. 1).
- domain assumption Mark independence at large pairwise distances gives the normalization c_tf = ∫∫ tf dν dν (Eq. 4).
- ad hoc to paper The mark pair density f^{(2)}(m,m'|u,v) factorizes into location-independent mark densities under the null (implicit in Lemma 1).
- domain assumption Plug-in estimates of the intensity function converge to the true intensity on the observation window.
Cite this review
Pith. "Pith review of Inhomogeneous mark correlation functions for general marked point processes." pith.science (2026). https://pith.science/paper/WOUSDBHZ
@misc{pith2026250524501,
  author       = {Pith},
  title        = {Pith review of: Inhomogeneous mark correlation functions for general marked point processes},
  year         = {2026},
  howpublished = {\url{https://pith.science/paper/WOUSDBHZ}},
  note         = {Machine review of arXiv:2505.24501}
}
read the original abstract
Spatial phenomena in environmental and biological contexts often involve events that are unevenly distributed across space and carry attributes, whose associations/variations are space-dependent. In this paper, we introduce the class of inhomogeneous mark correlation functions, capturing mark associations/variations, while explicitly accounting for the spatial inhomogeneity of events. The proposed functions are designed to quantify how, on average, marks vary or associate with one another as a function of pairwise spatial distances. We develop nonparametric estimators and evaluate their performance through simulation studies covering a range of scenarios with mark association or variation, spanning from nonstationary point patterns without spatial interaction to those characterised by clustering tendencies. Our simulations reveal the shortcomings of traditional methods in the presence of spatial inhomogeneity, underscoring the necessity of our approach. Furthermore, the results show that our estimators accurately identify both the positivity/negativity and effective spatial range for detected mark associations/variations. The proposed inhomogeneous mark correlation functions are then applied to two distinct forest ecosystems: Longleaf pine trees in southern Georgia, USA, marked by their diameter at breast height, and Scots pine trees in Pfynwald, Switzerland, marked by their height. Our findings reveal that the inhomogeneous mark correlation functions provide deeper and more detailed insights into tree growth patterns compared to traditional methods
Figures


Figures from the paper (5 more)


Reference graph
Works this paper leans on
-
[1]
Ang, Q. W., Baddeley, A., and Nair, G. (2012). Geometrically corrected second order analysis of events on a linear network, with applications to ecology and criminology. Scandinavian Journal of Statistics 39, 591--617
work page 2012
-
[2]
Baddeley, A. (2010). Handbook of Spatial Statistics , chapter Multivariate and Marked Point Processes, pages 371--402. Chapman & Hall/CRC Handbooks of Modern Statistical Methods. CRC Press
work page 2010
-
[3]
Baddeley, A., M ller, J., and Waagepetersen, R. (2000). Non-and semi-parametric estimation of interaction in inhomogeneous point patterns. Statistica Neerlandica 54, 329--350
work page 2000
-
[4]
Baddeley, A., Rubak, E., and Turner, R. (2015). Spatial Point Patterns: Methodology and Applications with R . CRC Press
work page 2015
-
[5]
Beisbart, C. and Kerscher, M. (2000). Luminosity- and morphology-dependent clustering of galaxies. The Astrophysical Journal 545, 6--25
work page 2000
-
[6]
Cressie, N. (1993). Statistics for Spatial Data . Wiley
work page 1993
-
[7]
marked spatial point processes: Current state and extensions to point processes on linear networks
Cronie, O., Jansson, J., and Konstantinou, K. (2024). Discussion of the paper “marked spatial point processes: Current state and extensions to point processes on linear networks”. Journal of Agricultural, Biological and Environmental Statistics 29, 379--388
work page 2024
-
[8]
Cronie, O., Moradi, M., and Mateu, J. (2020). Inhomogeneous higher-order summary statistics for point processes on linear networks. Statistics and Computing 30, 1221--1239
work page 2020
Show all 31 references
-
[9]
and van Lieshout, M
Cronie, O. and van Lieshout, M. (2018). A non-model-based approach to bandwidth selection for kernel estimators of spatial intensity functions. Biometrika 105, 455--462
2018
-
[10]
and Vere-Jones, D
Daley, D. and Vere-Jones, D. (2003). An Introduction to the theory of point processes. Volume I . Springer, Berlin-Heidelberg
2003
-
[11]
and Moradi, M
Eckardt, M. and Moradi, M. (2024a). Marked spatial point processes: Current state and extensions to point processes on linear networks. Journal of Agricultural, Biological and Environmental Statistics 29, 346--378
2024
-
[12]
and Moradi, M
Eckardt, M. and Moradi, M. (2024b). Rejoinder on `marked spatial point processes: Current state and extensions to point processes on linear networks'. Journal of Agricultural, Biological and Environmental Statistics 29, 405--416
2024
-
[13]
and Moradi, M
Eckardt, M. and Moradi, M. (2025). Local indicators of mark association for spatial marked point processes
2025
-
[14]
Illian, J., Penttinen, A., Stoyan, H., and Stoyan, D. (2008). Statistical Analysis and Modelling of Spatial Point Patterns . John Wiley & Sons, New York
2008
-
[15]
Isham, V. (1985). Marked point processes and their correlations. In Spatial processes and spatial time series analysis , pages 63--75. Publications des Facultes Universitaires Saint-Louis Brussels
1985
-
[16]
and Moradi, M
Mateu, J. and Moradi, M. (2024). Non-parametric intensity estimation for spatial point patterns with r. In Flexible nonparametric curve estimation , pages 113--151. Springer
2024
-
[17]
Moradi, M. (2018). Spatial and S patio- T emporal P oint P atterns on L inear N etworks . PhD dissertation, University Jaume I
2018
-
[18]
Moradi, M., Cronie, O., Rubak, E., Lachieze-Rey, R., Mateu, J., and Baddeley, A. (2019). Resample-smoothing of V oronoi intensity estimators. Statistics and Computing 29, 995–1010
2019
-
[19]
Myllym \"a ki, M., Mrkvi c ka, T., Grabarnik, P., Seijo, H., and Hahn, U. (2017). Global envelope tests for spatial processes. Journal of the Royal Statistical Society Series B: Statistical Methodology 79, 381--404
2017
-
[20]
Penttinen, A., Stoyan, D., and Henttonen, H. M. (1992). Marked point processes in forest statistics. Forest science 38, 806--824
1992
-
[21]
J., Evans, G
Platt, W. J., Evans, G. W., and Rathbun, S. L. (1988). The population dynamics of a long-lived conifer (pinus palustris). The American Naturalist 131, 491--525
1988
-
[22]
C., and Rodr \'i guez-Soalleiro, R
Pommerening, A., Gon c alves, A. C., and Rodr \'i guez-Soalleiro, R. (2011). Species mingling and diameter differentiation as second-order characteristics. Allgemeine Forst- und Jagdzeitung 182, 115--129
2011
-
[23]
and Grabarnik, P
Pommerening, A. and Grabarnik, P. (2019). Individual-based methods in forest ecology and management , volume 411. Springer
2019
-
[24]
and S \"a rkk \"a , A
Pommerening, A. and S \"a rkk \"a , A. (2013). What mark variograms tell about spatial plant interactions. Ecological Modelling 251, 64--72
2013
-
[25]
Schaub, M., Haeni, M., Hug, C., Gessler, A., and Rigling, A. (2016). Tree measurements 2002-2016 from the long-term irrigation experiment pfynwald, switzerland
2016
-
[26]
Schlather, M., Riberio, P., and Diggle, P. (2004). Detecting dependence between marks and locations of marked point processes. Journal of the Royal Statistical Society, Series B (Methodological) 66, 79--93
2004
-
[27]
Shimatani, K. (2002). Point processes for fine-scale spatial genetics and molecular ecology. Biometrical Journal 44, 325--352
2002
-
[28]
Stoyan, D. (1984). Correlations of the marks of marked point processes - statistical inference and simple models. Elektronische Informationsverarbeitung und Kybernetik 20, 285--294
1984
-
[29]
and Penttinen, A
Stoyan, D. and Penttinen, A. (2000). Recent applications of point process methods in forestry statistics. Statistical science pages 61--78
2000
-
[30]
and Stoyan, H
Stoyan, D. and Stoyan, H. (1994). Fractals, Random Shapes, and Point Fields: Methods of Geometrical Statistics . Wiley, Chichester, New York
1994
-
[31]
van Lieshout, M. N. M. (2011). A J -function for inhomogeneous point processes. Statistica Neerlandica 65, 183--201
2011
Reviewed August 7, 2026 · model on record in the stance chip above.
Discussion (0). Continue with ORCID to comment.