REVIEW 2 major objections 4 minor 47 references
Epidemic dynamics in physical-information-social multilayer networks
T0 review · 2 major / 4 minor · reviewed 2026-08-07 · deepseek-v4-flash
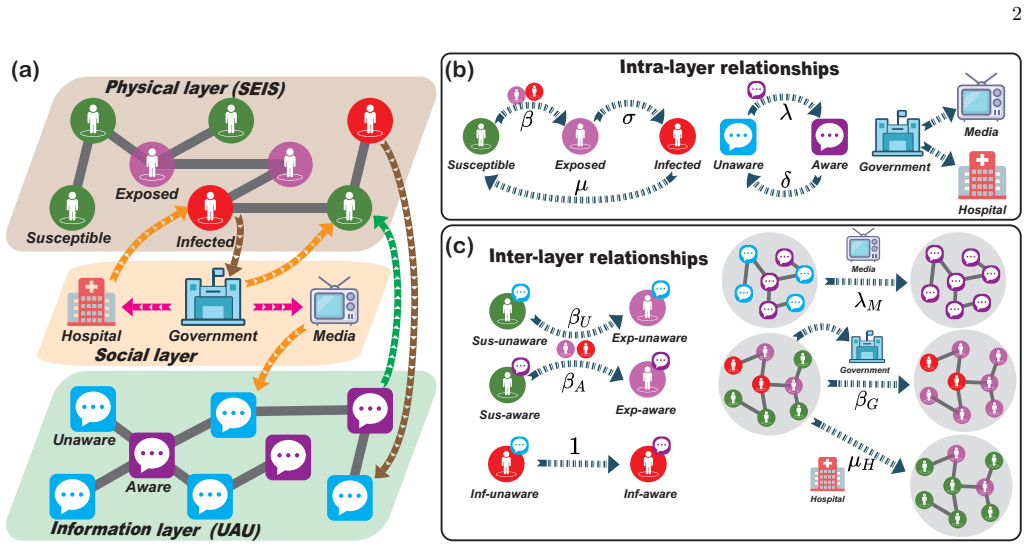
Pith's one-line read The paper claims the basic reproduction number of a coupled epidemic–awareness–institution model factorizes into government, hospital, and media terms, yielding a closed-form epidemic threshold at three description scales.
desk verdict Worth reviewing, but the headline R0 formula is only proven for the unclipped parameter subdomain; the paper needs a modest revision, not a desk reject. read the letter →
The pith
A machine-rendered reading of the paper's core claim, the machinery that carries it, and where it could break.
The reading
What carries the argument
The load-bearing object is the factorization identity $R_0 = \beta\,R_0^G\,R_0^H\,R_0^M$ together with the matrix $H$ whose dominant eigenvalue carries the media–awareness contribution. The entries $h_{ij} = (1 - (1 - \gamma_A)p_i^A)\,a_{ji}$ are the physical-layer adjacency matrix reweighted by each node's awareness: an unaware node transmits with the full infection probability while an aware node transmits with the discounted probability $\gamma_A$, so $\Lambda_{\max}(H)$ plays the role that the largest adjacency eigenvalue plays in single-layer network epidemiology. Institutional feedback enters through three response functions: government attention $g = f_{\mathrm{obs}}^g(\mathrm{obs})$ is a three-step piecewise-constant map from observed prevalence to the levels $g_l, g_m, g_h$ with boundaries $x_{lm}$ and $x_{mh}$, while media and hospital attention are truncated linear maps $m = \mathrm{clip}(k_g^m g, 0, 1)$ and $h = \mathrm{clip}(k_g^h g, 0, 1)$ with sensitivities $k_g^m$ and $k_g^h$. The next-generation matrix method applied at the disease-free equilibrium turns the epidemic threshold into an eigenvalue problem, and the block structure of the next-generation matrix is what separates the threshold into the three factors.
What would settle it
The factorization predicts that the epidemic threshold depends only on disease-free quantities — the baseline attention $g_l$, the latent rate $\sigma$, the hospital-boosted recovery $\mu_0^H$, and the media-reweighted eigenvalue — and not on the response boundaries $x_{lm}$, $x_{mh}$ or the high-intensity attention $g_h$. A concrete test is to run quasi-stationary simulations on two identical networks with the same $g_l$ but different step positions, say $x_{lm} = 1/3$ versus $x_{lm} = 1/10$: the theory predicts identical $\beta_c$, with only the above-threshold epidemic size differing. If the measured thresholds differ, the three-factor form misses a dependence on the shape of the institutional response.
Extended reading notes
Core claim
The central claim is that the response of social institutions to an outbreak can be folded into the basic reproduction number as three multiplicative factors, so the epidemic threshold is $\beta_c = 1/(R_0^G\,R_0^H\,R_0^M)$. Here $R_0^G = 1 - g_l$ is the reduction of the infection probability under the government's baseline attention, $R_0^H = 1/\sigma + 1/\mu_0^H$ is the mean duration of the exposed plus infectious phases with the hospital-boosted recovery rate $\mu_0^H = \mu + k_g^h g_l - \mu\,k_g^h g_l$, and $R_0^M$ is the awareness and media contribution. At the microscopic level $R_0^M = \Lambda_{\max}(H)$ with $h_{ij} = (1 - (1 - \gamma_A)p_i^A)\,a_{ji}$; at the mesoscopic level, for independent uncorrelated layers, $R_0^M = \langle k_1^2\rangle(1 - (1 - \gamma_A)p^A)/\langle k_1\rangle$; and at the macroscopic level $R_0^M = \langle k_1\rangle(1 - (1 - \gamma_A)p^A)$. The paper derives these thresholds from both the Microscopic Markov Chain Approach and the continuous-time quenched mean-field equations via the next-generation matrix method, obtains identical forms in discrete and continuous time, and verifies numerically that the mesoscopic threshold best matches quasi-stationary simulation peaks. It further claims that awareness exchange curbs transmission, earlier and stronger government responses reduce epidemic size, hospital influence outperforms media influence, physical-contact-heavy information-poor groups such as students carry the highest infection rates, and weaker physical heterogeneity combined with stronger information heterogeneity raises the threshold, as argued for rural areas with high internet penetration.
Load-bearing premise
The argument rests on the assumption that government attention is a piecewise-constant step function of observed prevalence with exactly three discrete levels, and that media and hospital attention are truncated linear functions of government attention; if real institutions respond continuously, with lag or hysteresis, or with different saturation behavior, the derived threshold and the policy rankings built on it could change.
Editorial extensions
If this is right
- The epidemic threshold is set entirely by the disease-free state — baseline attention $g_l$, latent and recovery rates with hospital boosting, and media-reweighted network susceptibility — so response timing and high-intensity levels change the final epidemic size but not whether an outbreak starts.
- Because the three factors multiply, strengthening any one lever lowers the threshold by the same multiplicative factor at equal relative strength, which lets policies be compared by their effect on $g_l$, $\mu_0^H$, and awareness levels.
- Hospital sensitivity $k_g^h$ raises the threshold and cuts epidemic size more than equal media sensitivity $k_g^m$, so the paper's ranking of institutional levers is hospitals first, media second.
- In a fixed community, groups with high physical degree and low information degree — students in the paper's reading — have the highest infection rates and need sustained targeted protection.
- Across different community topologies, weaker physical-layer heterogeneity with stronger information-layer heterogeneity raises the threshold (rural areas with high internet penetration), and in community-structured contact networks epidemics reach adjacent communities before distant ones, so containment should be staged by proximity.
Reading between the lines
- The multiplicative structure implies a separation principle the paper leaves implicit: the threshold can be optimized by varying government, hospital, and awareness parameters independently, making the model a template for decomposing required control effort by institution.
- A direct testable extension is to replace the three-step response with a continuous or delayed response function: the factorization predicts the threshold will depend only on the response value at the disease-free point, and numerical tests could check whether that survival of the formula holds.
- Adding resource constraints — the model assumes hospitals only improve recovery, while cited work shows information demand can strain resources — would couple the hospital factor to epidemic size and likely break the clean factorization away from the threshold.
- The rural-area prediction that higher internet penetration inhibits outbreaks is a quantitative statement that could be checked against regional epidemiological data once physical contact structure and internet access rates are jointly measured.
Editorial analysis
A structured set of objections, weighed in public.
Referee Report
Summary. The manuscript develops a tripartite epidemic model on a multilayer network with physical (SEIS), information (UAU), and social (government/media/hospital) layers. Using MMCA and mean-field approximations, it derives kinetic equations at microscopic, mesoscopic, and macroscopic scales, and obtains the basic reproduction number R0 = β(1−gl)(1/σ + 1/μ0_H)Λ(H) via the next-generation matrix. The epidemic threshold βc = 1/R0 is validated against quasi-stationary simulations on UCM and BA networks. The paper reports that earlier and stronger government responses, stronger media/hospital influence, and higher awareness reduce epidemic size and raise the threshold.
Significance. If the derived closed-form threshold holds, the paper provides a tractable three-scale analytical framework for epidemic dynamics with institutional feedback, a useful extension of standard UAU-SIS multiplex models. The MMCA equations are standard, the NGM derivation is self-contained, and the authors provide public source code and independent quasi-stationary validation, which are strengths. The main results are, however, conditional on an unstated parameter restriction and a possible error in the macroscopic mean-field equations, so the claims of general validity are not yet fully supported.
major comments (2)
- [Section II and Appendix A.1 (Eqs. A1, A3, A6; Table II)] The linearization near the disease-free state uses λM ≈ k_m^g gl and μ0_H = μ + k_h^g gl − μ k_h^g gl, but the model defines m = clip(k_m^g g, 0, 1) and h = clip(k_h^g g, 0, 1). For any admissible parameter point with k_m^g gl > 1, the factor (1 − k_m^g gl) appearing in Eq. (8), Eq. (14), and Eq. (A6) is negative, and for k_h^g gl > 1, μ0_H exceeds 1. Consequently, Eqs. (3), (5)–(8), (11), Table II, and the resulting threshold formulas are not derived for the model as stated; they hold only on the unstated subdomain k_m^g gl ≤ 1 and k_h^g gl ≤ 1. The authors should either replace k_m^g gl and k_h^g gl with their clipped images throughout the linearization and re-derive the formulas, or explicitly restrict the valid parameter domain and note that the numerical experiments all lie in the non-clipped regime.
- [Appendix C, Eqs. (C1) and (20)] The macroscopic mean-field equations in Eq. (C1) contain a factor 2 in the interaction terms (2λ⟨k2⟩ and 2βG⟨k1⟩), and Eq. (20) is derived from that form. The standard homogeneous limit of Eq. (A7) with a regular graph of degree ⟨k⟩ gives Σ_j a_ji = ⟨k⟩, and hence λ⟨k2⟩ and βG⟨k1⟩ without the factor 2. If the authors intend the complete-graph approximation with aij = ⟨k⟩/(N−1), that factor should be removed; as written, the effective degree becomes 2⟨k⟩, which conflicts with the definition of ⟨k1⟩. This affects the macroscopic R0^M in Eq. (19) and the pA root in Eq. (20), so the macroscopic-level result is not reliable as stated. Please verify the derivation and correct or justify the factor 2.
minor comments (4)
- [Appendix A.2, Eq. (A7)] The continuous equations assign all recovery from IA to SA (via the +μH pIA term in dpSA/dt) and no direct δμH pIA term in dpSU/dt, whereas the discrete model in Eq. (2) splits recovery as δμH pIA → SU and (1−δ)μH pIA → SA. This makes the continuous model a slightly different process. The epidemic threshold is unaffected because pIA = 0 at the disease-free equilibrium, but the claim that the discrete and continuous formulations are identical should be clarified or the recovery split corrected in the continuous equations.
- [Section III] The phrase 'The mortality rate λM (t) is defined as' should read 'The media-driven awareness rate λM (t) is defined as', since λM is not a mortality rate.
- [Fig. 5 caption] The caption says 'quasi-static numerical simulations'; the term should be 'quasi-stationary' throughout for consistency with the method described in Section V.A.
- [Some parameter notation] The text alternates between kgm/kgh and k_m^g/k_h^g; please standardize to subscript notation to avoid confusion, especially in the Fig. 4 and Fig. 7 captions.
Circularity Check
No significant circularity: the R0 derivation is self-contained, with no fitted parameter renamed as a prediction and no load-bearing self-citation.
full rationale
The central claim, Eq. (3) with threshold Eq. (4), is derived from the model equations rather than assumed. At the disease-free state, the government attention is gl by the piecewise definition of f_g^obs(0), and the media and hospital responses are linearized as k_m^g gl and k_h^g gl. The information-layer stationary probabilities pA_i are obtained by iterating Eqs. (7)-(8), and the media contribution R0^M is then the dominant eigenvalue of the matrix H defined in Eq. (6). The threshold beta_c = sigma mu0_H / (Lambda_max(H)(sigma + mu0_H)(1 - gl)) follows from the next-generation matrix calculation in Appendix A3 and is then compared with independent quasi-stationary simulations in Fig. 5. No parameter is fitted to the simulated epidemic and then called a prediction; the parameters gl, k_m^g, k_h^g, gamma_A, lambda, delta are model inputs. The paper does not rely on a uniqueness theorem or on self-citation to justify its central result; citation [32] is the standard NGM method, and [16,17,33,34] are standard prior network-epidemic results used for comparison or approximation. The reviewer-identified clipping issue for k_m^g gl > 1 or k_h^g gl > 1 is a domain-validity concern about the linearized threshold formulas, not a circularity: the derivation is still an honest mathematical consequence of the unclipped approximations, even if those approximations fail on part of the stated parameter domain. Thus no circular step is present.
Assumptions & free parameters
free parameters (6)
- gl (low government attention) =
0.1 (chosen in simulations)
- gm, gh (medium and high government attention) =
0.5, 0.9 (chosen in simulations)
- xlm, xmh (response boundaries) =
1/3, 2/3 (chosen in simulations)
- k_m^g (media sensitivity) =
0.5 (chosen in simulations)
- k_h^g (hospital sensitivity) =
0.5 (chosen in simulations)
- γA (awareness protection factor) =
0.3 (chosen in simulations)
assumptions (5)
- standard math Perron-Frobenius theorem and next-generation matrix theory are valid for the linearized infection system.
- domain assumption The physical and information layers are independent and uncorrelated in the simplified mesoscopic formulas.
- domain assumption Infected individuals are always aware, so IU states are excluded.
- ad hoc to paper Government attention is a piecewise-constant function of observed prevalence with thresholds xlm and xmh.
- ad hoc to paper Media and hospital attention are truncated-linear functions of government attention.
invented entities (1)
-
Social-layer institutional nodes (government, media, hospital)
Cite this review
Pith. "Pith review of Epidemic dynamics in physical-information-social multilayer networks." pith.science (2026). https://pith.science/paper/55HNMM7R
@misc{pith2026250600104,
  author       = {Pith},
  title        = {Pith review of: Epidemic dynamics in physical-information-social multilayer networks},
  year         = {2026},
  howpublished = {\url{https://pith.science/paper/55HNMM7R}},
  note         = {Machine review of arXiv:2506.00104}
}
read the original abstract
During epidemic outbreaks, information dissemination enhances individual protection, while social institutions influence the transmission through measures like government interventions, media campaigns, and hospital resource allocation. Here we develop a tripartite physical-information-social epidemic model and derive the corresponding kinetic equations in different scales by using the Microscopic Markov Chain Approach and mean-field approximations. The basic reproduction number and epidemic thresholds are explicitly derived by the next generation matrix method. Our results reveal that (1) active information exchange curbs disease transmission, (2) earlier and stronger government responses reduce the epidemic size, and (3) stronger governmental influence on media and hospitals further decreases disease transmission, particularly in hospital nodes. In fixed community structures, groups with frequent physical contact but weak information access (e.g., students) exhibit higher infection rates. For diverse communities, weaker physical layer heterogeneity but stronger information layer heterogeneity (e.g., high internet penetration in rural areas) inhibits epidemic outbreaks. These findings offer valuable insights for epidemic prevention and control strategies.
Figures


Figures from the paper (6 more)


Reference graph
Works this paper leans on
-
[1]
Conversely, the SU state (a node in both S and U) retains the baseline infection probability: βU = β
I-layer ⇔ P-layer: the co-located node state SA (where a node belongs to both S and A) reduces the infection probability βA, formulated as: βA = βγA, where γA ∈ [0, 1] represents the transmission rate discount factor due to protective measures. Conversely, the SU state (a node in both S and U) retains the baseline infection probability: βU = β. The node I...
-
[2]
S-layer ⇔ P-layer: the infection level within the population influences the government attention to the epidemic. We define the observational metrics obs for the infection severity: obs = NEI N , where NEI is the total number of nodes in states E and I. The government attention g is determined by a mapping function f g obs, such that g = f g obs(obs). Bas...
-
[3]
I-layer ⇔ S-layer: the media coverage of the epidemic enhances the public awareness, thereby increasing the preventive vigilance. We model this behavioral adaptation by introducing a media-driven transition rate λM , representing the probability that an unaware individual in the I-layer becomes aware due to the media exposure. Formally, we define: λM = m,...
-
[4]
Epidemic threshold in discrete settings When the system is in a stationary state, the probabilities for each state satisfy pi(t + 1) = pi(t) = pi. Near the epidemic threshold, the probability of infection for each individual approaches zero, so we have pSU i ≫ pEU i , pSA i ≫ pEA i + pIA i , g ≈ gl and λM ≈ km g gl. Additionally, since pU i = pSU i + pEU ...
-
[5]
(2), we can derive the continuous microscopic mean-field equations
Continuous microscopic mean-field equations Based on Eq. (2), we can derive the continuous microscopic mean-field equations. Introducing a time step of ∆ t and rearranging Eq. (2), we can take ∆ t → 0 to obtain the following equations: 20 dpSU i dt = − X j (λbjipA j pSU i + βGajipEI j pSU i ) − λM pSU i + δpSA i , dpSA i dt = X j (λbjipA j pSU i − βGAajip...
-
[6]
Epidemic threshold in continuous settings For the disease-free equilibrium (DFE), the basic reproduction number R0 is calculated using the next-generation matrix method [32]. Let F = P j βGaj1pEI j pSU 1 ...P j βGajN pEI j pSU NP j βGAaj1pEI j pSA 1 ...P j βGAajN pEI j pSA N 0 ... 0 denote the rate of new infections, ...
-
[7]
Discrete mesoscopic mean-field equations In this section, we consider a degree-based MMCA approach. First, we begin by assuming that each node (indi- vidual) is characterized by a degree vector k = ( k1, k2), where k1 and k2 denote the node’s degrees in the P-layer and I-layer, respectively. Here, k1 and k2 take discrete values k1 = 0, 1, 2, . . . , kmax ...
-
[8]
Continuous mesoscopic mean-field equations Based on Eq. (B2), we can derive the continuous mesoscopic mean-field equations, also termed the heterogeneous mean-field equations. Considering a time step of ∆ t and rearranging Eq. (B2), we can take ∆ t → 0 to obtain the following equations: dpSU k dt = − k2λϕ2pSU k − k1βGϕ1pSU k − λM pSU k + δpSA k , dpSA k d...
Show all 47 references
-
[9]
Near the epidemic threshold, the probability of infection for each individual approaches zero, so we have pSU k ≫ pEU k , pSA k ≫ pEA k + pIA k , g ≈ gl and λM ≈ km g gl
Epidemic threshold in discrete settings When the system is in a stationary state, the probabilities for each state satisfy pk(t + 1) = pk(t) = pk. Near the epidemic threshold, the probability of infection for each individual approaches zero, so we have pSU k ≫ pEU k , pSA k ≫ ...
-
[10]
Epidemic threshold in the uncorrelated network Assuming the topological connections of the P-layer and I-layer are independent, we have P (k) = PP (k1)PI (k2), where PP and PI are the degree distribution functions of the P-layer and I-layer, respectively. Further assuming that...
-
[11]
Malik, M
S. Malik, M. Asghar, and Y. Waheed, Outlining recent updates on influenza therapeutics and vaccines: A comprehensive review, Vaccine: X 17, 100452 (2024)
2024
-
[12]
Platto, T
S. Platto, T. Xue, and E. Carafoli, COVID19: An announced pandemic, Cell Death & Disease 11, 799 (2020)
2020
-
[13]
Dietz and J
K. Dietz and J. A. P. Heesterbeek, Daniel Bernoulli’s epidemiological model revisited, Mathematical Biosciences 180, 1 (2002)
2002
-
[14]
M. J. Keeling and P. Rohani, Modeling Infectious Diseases in Humans and Animals(Princeton University Press, 2008) j.ctvcm4gk0
2008
-
[15]
Albert, H
R. Albert, H. Jeong, and A.-L. Barab´ asi, Error and attack tolerance of complex networks, Nature 406, 378 (2000)
2000
-
[16]
Newman, Networks: An Introduction(Oxford University Press, 2010)
M. Newman, Networks: An Introduction(Oxford University Press, 2010)
2010
-
[17]
Pastor-Satorras and A
R. Pastor-Satorras and A. Vespignani, Epidemic Spreading in Scale-Free Networks, Physical Review Letters 86, 3200 (2001)
2001
-
[18]
Pastor-Satorras, C
R. Pastor-Satorras, C. Castellano, P. Van Mieghem, and A. Vespignani, Epidemic processes in complex networks, Reviews of Modern Physics 87, 925 (2015)
2015
-
[19]
J. N. Hays, Epidemics and Pandemics: Their Impacts on Human History(ABC-CLIO, Santa Barbara, Calif, 2005)
2005
-
[20]
S. Funk, E. Gilad, and V. A. A. Jansen, Endemic disease, awareness, and local behavioural response, Journal of Theoretical Biology 264, 501 (2010)
2010
-
[21]
X.-X. Zhan, C. Liu, G. Zhou, Z.-K. Zhang, G.-Q. Sun, J. J. Zhu, and Z. Jin, Coupling dynamics of epidemic spreading and information diffusion on complex networks, Applied Mathematics and Computation 332, 437 (2018)
2018
-
[22]
Samanta, S
S. Samanta, S. Rana, A. Sharma, A. K. Misra, and J. Chattopadhyay, Effect of awareness programs by media on the epidemic outbreaks: A mathematical model, Applied Mathematics and Computation 219, 6965 (2013)
2013
-
[23]
Q. Wu, X. Fu, M. Small, and X.-J. Xu, The impact of awareness on epidemic spreading in networks, Chaos 22, 013101 (2012)
2012
-
[24]
G. Liu, Z. Liu, and Z. Jin, Dynamics analysis of epidemic and information spreading in overlay networks, Journal of Theoretical Biology 444, 28 (2018)
2018
-
[25]
Y. Zhou, J. Zhou, G. Chen, and H. E. Stanley, Effective degree theory for awareness and epidemic spreading on multiplex networks, New Journal of Physics 21, 035002 (2019)
2019
-
[26]
Granell, S
C. Granell, S. G´ omez, and A. Arenas, Dynamical Interplay between Awareness and Epidemic Spreading in Multiplex Networks, Physical Review Letters 111, 128701 (2013)
2013
-
[27]
Granell, S
C. Granell, S. G´ omez, and A. Arenas, Competing spreading processes on multiplex networks: Awareness and epidemics, Physical Review E 90, 012808 (2014)
2014
-
[28]
Huang, J
Y.-J. Huang, J. Juang, Y.-H. Liang, and H.-Y. Wang, Global stability for epidemic models on multiplex networks, Journal of Mathematical Biology 76, 1339 (2018)
2018
-
[29]
D. H. Silva, F. A. Rodrigues, and S. C. Ferreira, Accuracy of discrete- and continuous-time mean-field theories for epidemic processes on complex networks, Physical Review E 110, 014302 (2024)
2024
-
[30]
Pan and Z
Y. Pan and Z. Yan, The impact of multiple information on coupled awareness-epidemic dynamics in multiplex networks, Physica A: Statistical Mechanics and its Applications 491, 45 (2018)
2018
-
[31]
Zheng, C
C. Zheng, C. Xia, Q. Guo, and M. Dehmer, Interplay between SIR-based disease spreading and awareness diffusion on multiplex networks, Journal of Parallel and Distributed Computing 115, 20 (2018). 28
2018
-
[32]
C. Xia, Z. Wang, C. Zheng, Q. Guo, Y. Shi, M. Dehmer, and Z. Chen, A new coupled disease-awareness spreading model with mass media on multiplex networks, Information Sciences 471, 185 (2019)
2019
-
[33]
Z. Wang, Q. Guo, S. Sun, and C. Xia, The impact of awareness diffusion on SIR-like epidemics in multiplex networks, Applied Mathematics and Computation 349, 134 (2019)
2019
-
[34]
W. Ma, P. Zhang, X. Zhao, and L. Xue, The coupled dynamics of information dissemination and SEIR-based epidemic spreading in multiplex networks, Physica A: Statistical Mechanics and its Applications 588, 126558 (2022)
2022
-
[35]
P. Zhu, X. Wang, S. Li, Y. Guo, and Z. Wang, Investigation of epidemic spreading process on multiplex networks by incorporating fatal properties, Applied Mathematics and Computation 359, 512 (2019)
2019
-
[36]
He and L
L. He and L. Zhu, Modeling the COVID-19 epidemic and awareness diffusion on multiplex networks, Communications in Theoretical Physics 73, 035002 (2021)
2021
-
[37]
Yu and L
Y. Yu and L. Huo, A coupled UAU-DKD-SIQS model considering partial and complete mapping relationship in time- varying multiplex networks, Expert Systems with Applications 273, 126887 (2025)
2025
-
[38]
Yu and L
Y. Yu and L. Huo, Effects of official information diffusion and rumor-related behavior adoption on epidemic transmission in multiplex networks, Information Sciences 689, 121414 (2025)
2025
-
[39]
J. Chen, M. Hu, and J. Cao, Dynamics of information-awareness-epidemic-activity coevolution in multiplex networks, Physical Review Research 5, 033065 (2023)
2023
-
[40]
J. Chen, Y. Zhang, M. Hu, M. Li, and F. Chen, Nontrivial epidemic dynamics induced by information-driven awareness- activity-resource coevolution, Physical Review E 111, 044301 (2025)
2025
-
[41]
L. Li, G. Dong, H. Zhu, and L. Tian, Impact of multiple doses of vaccination on epidemiological spread in multiple networks, Applied Mathematics and Computation 472, 128617 (2024)
2024
-
[42]
Van Den Driessche and J
P. Van Den Driessche and J. Watmough, Reproduction numbers and sub-threshold endemic equilibria for compartmental models of disease transmission, Mathematical Biosciences 180, 29 (2002)
2002
-
[43]
Chang, C.-R
X. Chang, C.-R. Cai, J.-Q. Zhang, and C.-Y. Wang, Analytical solution of epidemic threshold for coupled information- epidemic dynamics on multiplex networks with alterable heterogeneity, Physical Review E 104, 044303 (2021)
2021
-
[44]
Pastor-Satorras and A
R. Pastor-Satorras and A. Vespignani, Epidemic dynamics and endemic states in complex networks, Physical Review E 63, 066117 (2001)
2001
-
[45]
R. S. Sander, G. S. Costa, and S. C. Ferreira, Sampling methods for the quasistationary regime of epidemic processes on regular and complex networks, Physical Review E 94, 042308 (2016)
2016
-
[46]
S. C. Ferreira, C. Castellano, and R. Pastor-Satorras, Epidemic thresholds of the susceptible-infected-susceptible model on networks: A comparison of numerical and theoretical results, Physical Review E 86, 041125 (2012)
2012
-
[47]
A. S. Mata and S. C. Ferreira, Multiple transitions of the susceptible-infected-susceptible epidemic model on complex networks, Physical Review E 91, 10.1103/physreve.91.012816 (2015)
2015 doi
Reviewed August 7, 2026 · model on record in the stance chip above.
Discussion (0). Sign in to comment.