REVIEW 4 major objections 6 minor 1 cited by
Reconstructing the Milky Way chemical map with Galactic Chemical Evolution tool OMEGA+ from SDSS-MWM
T0 review · 4 major / 6 minor · reviewed 2026-08-07 · deepseek-v4-flash
Pith's one-line read Chemical maps of 393,743 Milky Way stars show the disk assembled in two gas infall episodes, with a second accretion peak 4.13 Gyr after formation, about 10 Gyr ago.
desk verdict A solid, well-documented two-infall GCE fit to the new MWM DR19 sample, but the abstract overclaims: the merger time is fitted, not predicted. read the letter →
The pith
A machine-rendered reading of the paper's core claim, the machinery that carries it, and where it could break.
The reading
What carries the argument
The load-bearing mechanism is the two-peak inflow rate defined in Eq. (5): the sum of two infall events, each with an exponentially rising branch (timescales $\tau_{\mathrm{up}}$ and a fixed early rise) and an exponentially decaying branch ($\tau_1$ and $\tau_2$), with the second peak delayed by $t_{\mathrm{max}}$ and normalized by present-day surface densities $\sigma_1$ and $\sigma_2$. This functional form forces a gap in gas accretion and star formation between the two phases, which produces the loop in the $[\mathrm{Mg}/\mathrm{M}]$ – $[\mathrm{M}/\mathrm{H}]$ plane and the chemical bimodality. The supporting machinery is the linear boundary of Eq. (2) that splits the sample into high- and low-Mg sequences, followed by least-squares fitting of the model parameters to the observed median sequences, with uncertainties estimated by bootstrapping.
What would settle it
Measure asteroseismic or spectroscopic ages for a large sample of low-Mg (thin-disk) stars in the 13–15 kpc ring: the regional model predicts these stars formed only after the second infall at $t_{\mathrm{max}} \approx 2.7$ Gyr, following a star-formation gap about 2 Gyr after the first episode. Discovering a substantial population of thin-disk stars older than roughly 11 Gyr, or a continuous age distribution with no gap, would contradict the two-infall timing.
Extended reading notes
Core claim
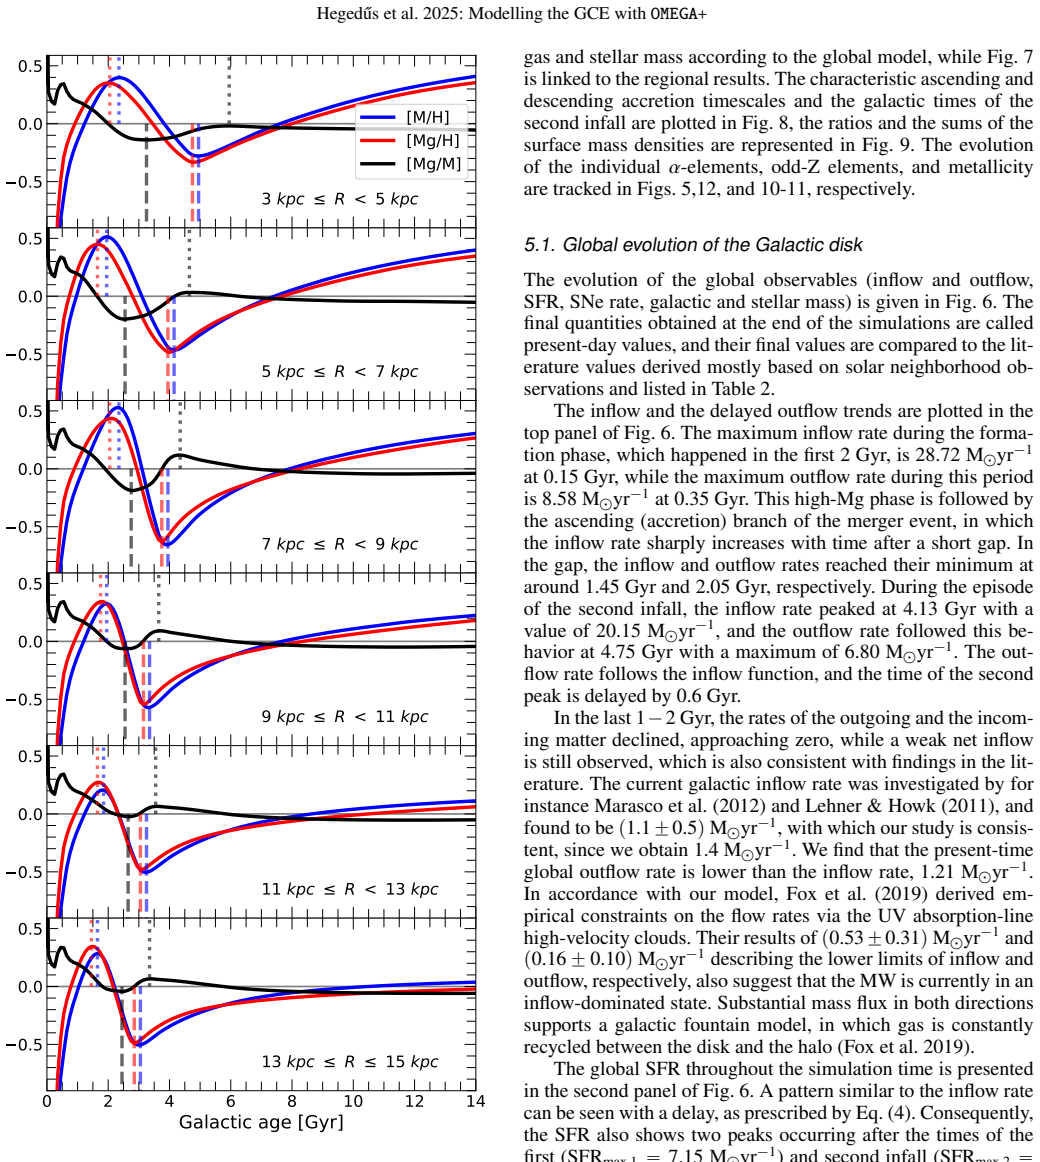
The paper's central claim is that the two observed sequences in the $[\mathrm{Mg}/\mathrm{M}]$ versus $[\mathrm{M}/\mathrm{H}]$ plane are produced by two discrete gas infall events with an exponential rise-and-decay shape. The first event builds the high-Mg population on a timescale of $\tau_1 = 0.32$ Gyr; the second adds the low-Mg population with a peak at $t_{\mathrm{max}} = 4.13$ Gyr and a slower relaxation $\tau_2 = 2.86$ Gyr, and in the global fit carries $\sigma_2/\sigma_1 = 7.61 \pm 0.23$ times the first event's surface density. Across six galactocentric rings, the second infall occurs earlier in the outer disk ($t_{\mathrm{max}}$ decreasing from 4.55 Gyr at 3–5 kpc to 2.67 Gyr at 13–15 kpc) and its mass share grows outward ($\sigma_2/\sigma_1$ from about 2 to about 14), which the authors read as a merger that hit the outer Galaxy first and assembled the disk inside-out. The same models reproduce the present-day inflow rate, star formation rate, supernova rates, and gas and stellar masses within observational uncertainties, and track 14 elements after applying per-element yield scaling factors.
Load-bearing premise
The load-bearing assumption is that the two observed chemical families of disk stars are caused by two separate gas infall events with the specific exponential rise-and-decay shape of Eq. (5) and with gas of primordial composition; if radial migration, a single smooth inflow, or gas recycling can produce the same chemical maps, then the fitted $t_{\mathrm{max}}$ and the inferred merger time are not uniquely determined.
Editorial extensions
If this is right
- The chemical two-sequence structure of the disk is a signature of two discrete accretion episodes, not a single continuous infall.
- A merger or accretion event began in the outer disk around 11.5–11.9 Gyr ago and propagated inward, meaning the thin disk formed inside-out.
- The outer disk is largely built by the second infall ($\sigma_2/\sigma_1$ up to about 14), so its stellar populations should be younger and more merger-dominated than the inner disk.
- Present-day observables (inflow around one solar mass per year, star formation rate, supernova rates, gas and stellar masses) are compatible with a Galaxy that is still slightly inflow-dominated.
- The element abundance patterns beyond magnesium are reproduced to the quality of the underlying yields; the partial failures for oxygen, titanium, and some odd-Z elements point to yield or measurement limitations rather than a different assembly history.
Reading between the lines
- Because the inflow shape is imposed before fitting, the quoted peak time is not a direct measurement of a merger; it is the time of maximum accretion inside the assumed two-peak family, so a smoother or single-inflow model that fits the same sequences would not carry a merger interpretation.
- A testable consequence the paper does not develop: stellar age distributions in the outer disk should show a clear gap between an old high-Mg population and a younger low-Mg population at roughly the regional $t_{\mathrm{max}}$, and the absence of such a gap would favor a migration-based explanation.
- The model neglects radial migration, so a next step would be to fit the same data with a migration-enabled model and compare fit quality; the outcome would quantify how much of the bimodality is accretion versus orbital rearrangement, and could shift all six regional parameters.
- The per-element yield scaling factors are fitted at one value across all metallicities, and some are large (magnesium factor 3.42, aluminum 7.61); if future metallicity-dependent yields reduced these factors, the inflow parameters could shift, although the authors report less than about 10% variation in the main parameters.
Editorial analysis
A structured set of objections, weighed in public.
Referee Report
Summary. The paper constructs one-zone Galactic chemical evolution models with the OMEGA+ code, calibrated against a quality-selected sample of ~394,000 stars from SDSS-V/MWM DR19. The authors split the sample into high- and low-Mg sequences, fit a two-infall accretion law with Levenberg-Marquardt optimization, and report global and galactocentric-region parameters for the two infall episodes, including tmax = 4.13 +/- 0.19 Gyr, tau1 = 0.32 +/- 0.02 Gyr, tau2 = 2.86 +/- 0.70 Gyr, tau_up = 0.55 +/- 0.06 Gyr, and sigma2/sigma1 = 7.61 +/- 0.23. They also derive per-element yield scaling factors fX and compare the predicted present-day SFR, gas mass, stellar mass, and supernova rates with literature values. The central astrophysical claim is that the well-defined second peak in the fitted infall rate confirms a merger event about 10 Gyr ago and that the radial trend of tmax implies an inside-out assembly of the Milky Way disk.
Significance. If the central claim were fully supported, the paper would be a valuable step forward: it uses an order-of-magnitude larger sample than earlier two-infall analyses, divides the disk into six radial zones, and extends the comparison to 14 elements. The visual agreement for Mg, Si, Ca, Mn, and Ni, the reproduction of global observables within broad literature ranges, and the consistency with the earlier Spitoni et al. (2021) results are genuine strengths. The paper also makes effective use of a public, reproducible code base and documents its fitting and bootstrap procedures clearly. However, the headline 'confirming a merger event' is not established by the analysis as presented: the two-infall shape is assumed in the model family, not inferred from the data, and no alternative model class is fitted or tested. The significance of the paper therefore depends on whether the authors either add such tests or substantially soften the physical interpretation.
major comments (4)
- [§3.2, Eq. (5); §4.2; §6] The abstract and Section 6 state that the best-fit models 'confirm a merger event about 10 Gyr ago,' but this is not a model-independent inference. Equation (5) defines the infall rate as the sum of two exponential rise-and-decay peaks, and tmax is a free parameter in Pglobal (Table 1, Section 4.2). The fit can move the second peak within this predetermined two-peak family but cannot certify that a second episode exists. No one-infall model, smoothly varying single inflow, or migration-based model is fitted or compared, even though Section 1 and Section 6 cite Sharma et al. (2021) and Prantzos et al. (2023) as alternative explanations of the same bimodal pattern. I recommend rewording the claim to 'within the adopted two-infall parametrization' and, ideally, adding either an explicit model-comparison (e.g., AIC/BIC) or a synthetic-data recovery test showing that tmax and the other inflow parameters can be uniquely recovered when the input model is known.
- [§4.2; Table 3] The quoted parameter uncertainties, e.g., tmax = 4.13 +/- 0.19 Gyr, are Hessian-based Levenberg-Marquardt errors that assume approximately Gaussian residuals, and the text itself notes in Section 4.2 that correlations and degeneracies between parameters are not investigated. Since fMg is fitted simultaneously with the inflow parameters and the yield scaling factors are large (fMg = 3.42, fAl = 7.61 in Table 4), systematic uncertainties from the yield library, the fixed SFE, the fixed DTD, and the abundance zero-point calibration are likely to dominate. The paper should provide a systematic error budget, for example by repeating the fit with an alternative yield set and with plausible variations of the fixed parameters, before presenting the merger epoch with sub-0.2 Gyr precision.
- [§5.4.3; Table 4] The statement in Section 5.4.3 that 'the parameters describing the inflow function will practically provide an unaltered GCE picture of the MW' is asserted rather than demonstrated. The fX yield factors are free parameters fitted to the same observational data as the inflow parameters, so there is no a priori reason they should not absorb some of the signal that would otherwise shift tmax, tau1, tau2, or sigma2/sigma1. The only yield-related robustness test described in Section 4.1 changes the upper mass limit for black-hole formation (Mth = 30 vs 100 Msun) and reports less than 10% variation in the inflow parameters; this is a useful check but not equivalent to varying the yield library or allowing metallicity-dependent yield corrections. I ask the authors to either provide such a test or to explicitly list this as a limitation of the quoted merger parameters.
- [§3.2, Eq. (9); §5.2; Fig. 8] The regional analysis imposes the radial profile of the total accreted surface density through Eq. (9) with a fixed scale length Rd = 3.5 kpc, and the regional partial densities are then derived from the global exponential profile via Eq. (11). The radial trend of tmax decreasing from 4.55 Gyr at R1 to 2.67 Gyr at R6 (Table 3, Fig. 8) could therefore be partly imprinted by this assumed profile rather than by the chemistry alone. I request a test in which the regional sigma_tot values are fitted independently, or at least a clear discussion of how the imposed profile affects the recovered tmax(R) gradient.
minor comments (6)
- [Abstract; §2.3] The abstract says '15 species altogether,' but the text and Table 4 list 14 individual elements (O, Mg, Si, S, Ca, Ti, Na, Al, K, V, Cr, Mn, Co, Ni) plus the combined alpha abundance. Please clarify whether the combined alpha ratio is counted as the 15th species.
- [Table 2] The column header '9Min [M⊙ yr−1]' contains a typographical error; it should read 'M_in [M⊙ yr−1]'.
- [§4.2] The description of the fit would benefit from a statement of the number of data points used in the chi-square statistic, the typical reduced chi-square values, and how the interpolation of the observed median sequences over the model output affects the effective sample size. Without these, the reader cannot assess whether the visual agreement in Figs. 5 and 12 is statistically adequate.
- [§6] The sentence beginning 'In the future, the implementation of stellar migration...' is a run-on and should be split into one or two sentences for readability.
- [§3.1.1] The IMF power-law indices are given as a1 = 1.3 and a2 = 2.3, but the text does not specify the normalization convention used for the piecewise Kroupa IMF beyond the integral condition; a single equation showing the normalization would remove ambiguity.
- [§3.2] Equation (5) is central to the paper but is introduced without stating the physical meaning of A in the sentence immediately before it; the definition A = (R^2 - r^2)π appears only inside the equation block. Moving the definition before the equation would improve readability.
Circularity Check
The 'confirmed' merger at tmax=4.13 Gyr is a fitted parameter of a two-infall inflow law assumed in Eq. (5), so the central claim reduces to the model's input ansatz.
-
self definitional
[Sect. 3.2, Eq. (5)]
"To fine-tune our two-infall scenario, we introduce rising phases of the surface mass density arriving at the Galactic disk per unit time (σ̇(t)): σ̇(t) := Σ_{k∈{1,2}} σ̇_{k,0} [θ(tmax,k−t) e^{(t−tmax,k)/τ1_k} + θ(t−tmax,k) e^{−(t−tmax,k)/τ_k}]"
This inflow law is written as a sum of two peaked terms with k ∈ {1,2}, so every admissible fit contains two distinct infall episodes by construction. The fit can move the location and width of the pre-imposed second peak, but it cannot test whether a second infall exists. The abstract's 'confirming a merger event' therefore restates the assumed two-infall ansatz rather than reporting an inference from the data.
-
fitted input called prediction
[Sect. 4.2, Table 1]
"The global and regional parameters that are varied are Pglobal={tmax, τ1, τ2, τup, σ2/σ1, σtot, fMg}, and Pregional={tmax, τ1, τ2, τup, σ2/σ1}"
The headline values tmax=4.13±0.19 Gyr, τ1=0.32±0.02 Gyr, τ2=2.86±0.70 Gyr, τup=0.55±0.06 Gyr, and σ2/σ1=7.61±0.23 are the optimized free parameters p in Eq. (14), fitted against the observed [Mg/M]-[M/H] plane with Levenberg-Marquardt. Their quoted uncertainties come from inverting the Hessian of that fit. These are conditional best-fit parameters within the assumed model family, not out-of-sample predictions, so presenting them as independent 'results' of the model conflates fit outputs with physical confirmation.
1 more flagged steps
-
fitted input called prediction
[Abstract; Sect. 5.1]
"The best-fit GCE models show a well-defined peak in the rate of the infalling matter as a function of the Galactic age, confirming a merger event about 10 Gyr ago."
The 'well-defined peak' is exactly tmax, a free parameter in Eq. (5) that was optimized in the fit. Calling this a 'confirmation' of a merger event goes beyond what the fit can establish, since the model family already assumes two infall peaks and no comparison is made against one-infall, smooth-inflow, or migration-based alternatives. The quoted 4.13 Gyr peak is therefore the fitted value of an input parameter, not a derived confirmation.
full rationale
The central claim of the paper—that the Milky Way experienced a merger event about 10 Gyr ago, with a second infall peak at tmax=4.13 Gyr—reduces largely to the two-infall ansatz encoded in Eq. (5) and to tmax being a free parameter of the fit. The paper is explicit that it is performing 'two-infall GCE models', and the inflow law is constructed as the sum of two peaked terms, so the presence of a second infall is an input assumption rather than a data-driven discovery. The fitted values and their uncertainties are conditional on that assumption and on several fixed choices (primordial infall composition, constant SFE and mass-loading, fixed SN Ia delay-time distribution, per-element yield renormalizations fX). At the same time, the paper is not wholly circular: it is anchored to external present-day observables (SFR, gas mass, SN rates) and to an independent earlier study (S21), and it reproduces those observables within uncertainties. However, those checks validate the overall model, not the existence or timing of the second infall, and the alternatives acknowledged in Sect. 1 and Sect. 6 (radial migration, single-infall or smoothly varying inflow models) are not fitted or ruled out. The abstract's 'confirming a merger event' is therefore an overstatement of what a fit inside a two-infall model family can establish, making the headline result partially circular by construction.
Assumptions & free parameters
free parameters (30)
- tmax (time of second infall peak) =
4.13 +/- 0.19 Gyr global; 2.67 to 4.55 Gyr regional
- tau1 (accretion decay timescale after first infall) =
0.32 +/- 0.02 Gyr global
- tau2 (accretion decay timescale after second infall) =
2.86 +/- 0.70 Gyr global; 2.23 to 9.40 Gyr regional
- tau_up (rising timescale before second infall) =
0.55 +/- 0.06 Gyr global; 0.32 to 1.00 Gyr regional
- sigma2/sigma1 (surface density ratio of infall episodes) =
7.61 +/- 0.23 global; 1.99 to 14.29 regional
- sigma_tot (total present-day infall surface density) =
161.5 +/- 30.2 Msun pc^-2 global
- Yield factor f_Mg =
3.42 +/- 0.03
- Yield factor f_O =
2.30 +/- 0.08
- Yield factor f_Si =
1.10 +/- 0.01
- Yield factor f_S =
0.90 +/- 0.04
- Yield factor f_Ca =
1.30 +/- 0.01
- Yield factor f_Ti =
1.50 +/- 0.12
- Yield factor f_Na =
2.42 +/- 0.15
- Yield factor f_Al =
7.61 +/- 0.21
- Yield factor f_K =
1.57 +/- 0.11
- Yield factor f_V =
1.33 +/- 0.07
- Yield factor f_Cr =
0.67 +/- 0.01
- Yield factor f_Mn =
1.00 +/- 0.01
- Yield factor f_Co =
1.03 +/- 0.12
- Yield factor f_Ni =
0.43 +/- 0.02
- Star formation efficiency nu =
0.022
- Mass-loading factor eta =
1
- SN Ia DTD decay time t_beta =
2 Gyr
- SN Ia number per stellar mass N_Ia/M_d =
0.0020 per Msun
- Mass threshold for SNe II M_trans =
9 Msun
- Rising timescale of the first infall tau1_prime =
0.05 Gyr
- Time of the first infall peak tmax,1 =
0.10 Gyr
- Mg sequence boundary parameters =
slope -0.17 dex/dex, high-Mg intercept 0.12 dex
- Schmidt-Kennicutt exponent k =
1.5
- IMF slopes a1 and a2 =
a1 = 1.3, a2 = 2.3
assumptions (6)
- ad hoc to paper The Milky Way's accretion history has the two-infall functional form of Eq. (5): two exponential rise-and-decay peaks separated by a gap.
- domain assumption The high-Mg and low-Mg sequences are two real stellar populations separated by the linear boundary of Eq. (2).
- domain assumption Infalling gas has primordial composition, with no pre-enriched inflow, and outflows have a constant mass-loading factor eta = 1.
- domain assumption The adopted NuGrid, FRUITY, Iwamoto, and Heger-Woosley yield tables, with metallicity-independent multiplicative corrections fX, are adequate for all fitted elements.
- domain assumption Radial stellar migration does not significantly shape the chemical maps used for fitting.
- domain assumption Each 2-kpc annulus evolves as a one-zone system, with regions coupled only through the global sigma_tot normalization.
Cite this review
Pith. "Pith review of Reconstructing the Milky Way chemical map with Galactic Chemical Evolution tool OMEGA+ from SDSS-MWM." pith.science (2026). https://pith.science/paper/ORBO3DGR
@misc{pith2026250600503,
  author       = {Pith},
  title        = {Pith review of: Reconstructing the Milky Way chemical map with Galactic Chemical Evolution tool OMEGA+ from SDSS-MWM},
  year         = {2026},
  howpublished = {\url{https://pith.science/paper/ORBO3DGR}},
  note         = {Machine review of arXiv:2506.00503}
}
abstract
We obtain two-infall galactic chemical evolution (GCE) models simulating the chemical evolution of the Milky Way as constrained by a golden sample of $394,000$ stellar abundances of the Milky Way Mapper survey from the 19th data release of SDSS-V. The separation between the chemical thin and thick disks is defined using [Mg/M]. We use the chemical evolution environment $\texttt{OMEGA+}$, combined with Levenberg-Marquardt and bootstrapping. We simulate the entire Galactic disk and six galactocentric regions for a more detailed analysis of the formation of the inner, middle, and outer Galaxy. We investigate the evolution of $\alpha$, odd-Z, and iron-peak elements: 15 species altogether. The chemical thin and thick disks are separated by Mg observations, which the other $\alpha$-elements show similar trends with, while odd-Z species demonstrate different patterns as functions of metallicity. In the inward Galactic disk regions the locus of the low-Mg sequence is gradually shifted toward higher metallicity, while the high-Mg phase is less populated. The best-fit GCE models show a well-defined peak in the rate of the infalling matter as a function of the Galactic age, confirming a merger event about $10$ Gyr ago. We show that the timescale of gas accretion, the time of the second infall as well as the ratio between the surface mass densities associated to the second infall and the formation event vary with the distance from the Galactic center. The disk is assembled within a timescale of $(0.32\pm0.02)~$Gyr during a primary formation phase, then a $(0.55\pm0.06)~$Gyr-timescale, increasing accretion rate was followed by a relaxation that lasted $(2.86\pm0.70)~$Gyr, with a second peak of the infall rate at $(4.13\pm0.19)~$Gyr. Our best Galaxy evolution models are consistent with an inside-out formation scenario of the Milky Way disk, in agreement with recent chemo-dynamical simulations.
Figures


Figures from the paper (9 more)




Forward citations
Cited by 1 Pith paper
-
Chemical Evolution of Galaxies: Past, Present and Future
A single-author review of galactic chemical-evolution modeling, centered on the time-delay interpretation of [X/Fe] vs [Fe/H] as a tool for galactic archaeology.
Reference graph
Works this paper leans on
-
[1]
2022, ApJS, 259, 35
Abdurro’uf, Accetta, K., Aerts, C., et al. 2022, ApJS, 259, 35
2022
-
[2]
2020, ApJS, 249, 3 Allende Prieto, C., Beers, T
Ahumada, R., Allende Prieto, C., Almeida, A., et al. 2020, ApJS, 249, 3 Allende Prieto, C., Beers, T. C., Wilhelm, R., et al. 2006, ApJ, 636, 804 Astropy Collaboration, Price-Whelan, A. M., Lim, P. L., et al. 2022a, ApJ, 935, 167 Astropy Collaboration, Price-Whelan, A. M., Lim, P. L., et al. 2022b, ApJ, 935, 167 Astropy Collaboration, Price-Whelan, A. M.,...
work page 2020
-
[3]
Bergemann, M., Ruchti, G. R., Serenelli, A., et al. 2014, A&A, 565, A89
work page 2014
- [4]
- [5]
-
[6]
Boothroyd, A. I. & Sackmann, I. J. 2003, ApJ, 583, 1004
work page 2003
-
[7]
Bowen, I. S. & Vaughan, Jr., A. H. 1973, Appl. Opt., 12, 1430
work page 1973
-
[8]
2020, MNRAS, 491, 5435
Buck, T. 2020, MNRAS, 491, 5435
2020
Show all 81 references
-
[9]
2008, A&A, 481, 691
Cescutti, G. 2008, A&A, 481, 691
2008
-
[10]
J., Serenelli, A
Chaplin, W. J., Serenelli, A. M., Miglio, A., et al. 2020, Nature Astronomy, 4, 382
2020
-
[11]
1997, ApJ, 477, 765
Chiappini, C., Matteucci, F., & Gratton, R. 1997, ApJ, 477, 765
1997
-
[12]
G., Baugh, C
Cole, S., Lacey, C. G., Baugh, C. M., & Frenk, C. S. 2000, MNRAS, 319, 168 Cˆot´e, B., Eichler, M., Arcones, A., et al. 2019, ApJ, 875, 106 Cˆot´e, B., O’Shea, B. W., Ritter, C., Herwig, F., & Venn, K. A. 2017a, ApJ, 835, 128 Cˆot´e, B., Ritter, C., Herwig, F., et al. 2017b, i...
2000
-
[13]
2016, in Journal of Physics Conference Series, V ol
Cristallo, S., Piersanti, L., & Straniero, O. 2016, in Journal of Physics Conference Series, V ol. 665, Journal of Physics Conference Series (IOP), 012019
2016
-
[14]
2011, ApJS, 197, 17
Cristallo, S., Piersanti, L., Straniero, O., et al. 2011, ApJS, 197, 17
2011
-
[15]
2015, ApJS, 219, 40 De Silva, G
Cristallo, S., Straniero, O., Piersanti, L., & Gobrecht, D. 2015, ApJS, 219, 40 De Silva, G. M., Freeman, K. C., Bland-Hawthorn, J., et al. 2015, MNRAS, 449, 2604
2015
-
[16]
2020, ApJ, 888, 91
Ebinger, K., Curtis, S., Ghosh, S., et al. 2020, ApJ, 888, 91
2020
-
[17]
2006, MNRAS, 372, 1149
Flynn, C., Holmberg, J., Portinari, L., Fuchs, B., & Jahreiß, H. 2006, MNRAS, 372, 1149
2006
-
[18]
J., Richter, P., Ashley, T., et al
Fox, A. J., Richter, P., Ashley, T., et al. 2019, ApJ, 884, 53
2019
-
[19]
1986, A&A, 160, 264
Francois, P. 1986, A&A, 160, 264
1986
-
[20]
1998, A&A, 338, 161 Gaia Collaboration, Katz, D., Antoja, T., et al
Fuhrmann, K. 1998, A&A, 338, 161 Gaia Collaboration, Katz, D., Antoja, T., et al. 2018, A&A, 616, A11 Garc´ıa P ´erez, A. E., Allende Prieto, C., Holtzman, J. A., et al. 2016, AJ, 151, 144
1998
-
[21]
& Reid, N
Gilmore, G. & Reid, N. 1983, MNRAS, 202, 1025 GRA VITY Collaboration, Abuter, R., Amorim, A., et al. 2019, A&A, 625, L10
1983
-
[22]
2005, A&A, 441, 1055
Greggio, L. 2005, A&A, 441, 1055
2005
-
[23]
Grevesse, N., Asplund, M., & Sauval, A. J. 2007, Space Sci. Rev., 130, 105
2007
-
[24]
A., & Weinberg, D
Griffith, E., Johnson, J. A., & Weinberg, D. H. 2019, ApJ, 886, 84
2019
-
[25]
H., Johnson, J
Griffith, E., Weinberg, D. H., Johnson, J. A., et al. 2021, ApJ, 909, 77
2021
-
[26]
2017, MNRAS, 472, 3637
Grisoni, V ., Spitoni, E., Matteucci, F., et al. 2017, MNRAS, 472, 3637
2017
-
[27]
E., Siegmund, W
Gunn, J. E., Siegmund, W. A., Mannery, E. J., et al. 2006, AJ, 131, 2332
2006
-
[28]
R., Bovy, J., Holtzman, J
Hayden, M. R., Bovy, J., Holtzman, J. A., et al. 2015, ApJ, 808, 132 Heged˝us, V ., M´esz´aros, S., Jofr´e, P., et al. 2023, A&A, 670, A107
2015
-
[29]
& Woosley, S
Heger, A. & Woosley, S. E. 2010, ApJ, 724, 341
2010
-
[30]
H., et al
Helmi, A., Babusiaux, C., Koppelman, H. H., et al. 2018, Nature, 563, 85
2018
-
[31]
1999, ApJS, 125, 439 Jofr´e, P., Heiter, U., & Soubiran, C
Iwamoto, K., Brachwitz, F., Nomoto, K., et al. 1999, ApJS, 125, 439 Jofr´e, P., Heiter, U., & Soubiran, C. 2019, ARA&A, 57, 571
1999
-
[32]
1998, ApJ, 498, 541
Kennicutt, Robert C., J. 1998, ApJ, 498, 541
1998
-
[33]
Khoperskov, S., Di Matteo, P., Haywood, M., G´omez, A., & Snaith, O. N. 2020, A&A, 638, A144
2020
-
[34]
I., & Lugaro, M
Kobayashi, C., Karakas, A. I., & Lugaro, M. 2020, ApJ, 900, 179
2020
-
[35]
2001, MNRAS, 322, 231
Kroupa, P. 2001, MNRAS, 322, 231
2001
-
[36]
2015, A&A, 580, A126
Kubryk, M., Prantzos, N., & Athanassoula, E. 2015, A&A, 580, A126
2015
-
[37]
1992, in Star Formation in Stellar Systems, ed
Larson, R. 1992, in Star Formation in Stellar Systems, ed. G. Tenorio-Tagle, M. Prieto, & F. Sanchez, 125
1992
-
[38]
Larson, R. B. 1976, MNRAS, 176, 31
1976
-
[39]
Larson, R. B. 1988, in NATO Advanced Study Institute (ASI) Series C, V ol. 232, Galactic and Extragalactic Star Formation, ed. R. E. Pudritz & M. Fich, 459
1988
-
[40]
& Howk, J
Lehner, N. & Howk, J. C. 2011, Science, 334, 955
2011
-
[41]
2023, MNRAS, 522, 863
Liang, J., Gjergo, E., & Fan, X. 2023, MNRAS, 522, 863
2023
-
[42]
R., Schiavon, R
Majewski, S. R., Schiavon, R. P., Frinchaboy, P. M., et al. 2017, AJ, 154, 94
2017
-
[43]
& Mannucci, F
Maoz, D. & Mannucci, F. 2012, PASA, 29, 447
2012
-
[44]
Marasco, A., Fraternali, F., & Binney, J. J. 2012, MNRAS, 419, 1107
2012
-
[45]
2021, A&A Rev., 29, 5
Matteucci, F. 2021, A&A Rev., 29, 5
2021
-
[46]
& Greggio, L
Matteucci, F. & Greggio, L. 1986, A&A, 154, 279
1986
-
[47]
& Tornambe, A
Matteucci, F. & Tornambe, A. 1985, A&A, 142, 13
1985
-
[48]
F., Parravano, A., & Hollenbach, D
McKee, C. F., Parravano, A., & Hollenbach, D. J. 2015, ApJ, 814, 13
2015
-
[49]
1997, ARA&A, 35, 503
McWilliam, A. 1997, ARA&A, 35, 503
1997
-
[50]
Pagel, B. E. J. & Tautvaisiene, G. 1995, MNRAS, 276, 505
1995
-
[51]
Pagel, B. E. J. & Tautvaisiene, G. 1997, MNRAS, 288, 108
1997
-
[52]
2020, MNRAS, 498, 1710
Palla, M., Matteucci, F., Spitoni, E., Vincenzo, F., & Grisoni, V . 2020, MNRAS, 498, 1710
2020
-
[53]
C., Ferrini, F., & Matteucci, F
Pardi, M. C., Ferrini, F., & Matteucci, F. 1995, ApJ, 444, 207
1995
-
[54]
& Thompson, T
Pejcha, O. & Thompson, T. A. 2015, ApJ, 801, 90
2015
-
[55]
2016, ApJS, 225, 24
Pignatari, M., Herwig, F., Hirschi, R., et al. 2016, ApJS, 225, 24
2016
-
[56]
Pignatari, M., Trueman, T. C. L., Womack, K. A., et al. 2023, MNRAS, 524, 6295
2023
-
[57]
2008, A&A, 489, 525
Prantzos, N. 2008, A&A, 489, 525
2008
-
[58]
2023, MNRAS, 523, 2126
Prantzos, N., Abia, C., Chen, T., et al. 2023, MNRAS, 523, 2126
2023
-
[59]
M., et al
Prantzos, N., Boehm, C., Bykov, A. M., et al. 2011, Reviews of Modern Physics, 83, 1001
2011
-
[60]
J., Howell, D
Pritchet, C. J., Howell, D. A., & Sullivan, M. 2008, ApJ, 683, L25
2008
-
[61]
Queiroz, A. B. A., Anders, F., Chiappini, C., et al. 2020, A&A, 638, A76
2020
-
[62]
2018, MNRAS, 480, 538
Ritter, C., Herwig, F., Jones, S., et al. 2018, MNRAS, 480, 538
2018
-
[63]
Robitaille, T. P. & Whitney, B. A. 2010, ApJ, 710, L11 Roˇskar, R., Debattista, V . P., Quinn, T. R., Stinson, G. S., & Wadsley, J. 2008, ApJ, 684, L79
2010
-
[64]
P., Phillips, S
Schiavon, R. P., Phillips, S. G., Myers, N., et al. 2024, MNRAS, 528, 1393
2024
-
[65]
1959, ApJ, 129, 243
Schmidt, M. 1959, ApJ, 129, 243
1959
-
[66]
& Zinn, R
Searle, L. & Zinn, R. 1978, ApJ, 225, 357
1978
-
[67]
R., & Bland-Hawthorn, J
Sharma, S., Hayden, M. R., & Bland-Hawthorn, J. 2021, MNRAS, 507, 5882 Silva Aguirre, V ., Bojsen-Hansen, M., Slumstrup, D., et al. 2018, MNRAS, 475, 5487
2021
-
[68]
A., Gunn, J
Smee, S. A., Gunn, J. E., Uomoto, A., et al. 2013, AJ, 146, 32
2013
-
[69]
2016, ApJ, 830, 35
Souto, D., Cunha, K., Smith, V ., et al. 2016, ApJ, 830, 35
2016
-
[70]
V ., et al
Souto, D., Cunha, K., Smith, V . V ., et al. 2018, ApJ, 857, 14
2018
-
[71]
2015, ApJ, 802, 129
Spitoni, E., Romano, D., Matteucci, F., & Ciotti, L. 2015, ApJ, 802, 129
2015
-
[72]
2019, A&A, 623, A60
Spitoni, E., Silva Aguirre, V ., Matteucci, F., Calura, F., & Grisoni, V . 2019, A&A, 623, A60
2019
-
[73]
2021, A&A, 647, A73
Spitoni, E., Verma, K., Silva Aguirre, V ., et al. 2021, A&A, 647, A73
2021
-
[74]
Tinsley, B. M. 1980, Fund. Cosmic Phys., 5, 287
1980
-
[75]
2012, ApJ, 757, 69
Ugliano, M., Janka, H.-T., Marek, A., & Arcones, A. 2012, ApJ, 757, 69
2012
-
[76]
& Kobayashi, C
Vincenzo, F. & Kobayashi, C. 2020, MNRAS, 496, 80
2020
-
[77]
2019, MNRAS, 487, L47
Vincenzo, F., Spitoni, E., Calura, F., et al. 2019, MNRAS, 487, L47
2019
-
[78]
H., Holtzman, J
Weinberg, D. H., Holtzman, J. A., Hasselquist, S., et al. 2019, ApJ, 874, 102
2019
-
[79]
Wiersma, R. P. C., Schaye, J., Theuns, T., Dalla Vecchia, C., & Tornatore, L. 2009, MNRAS, 399, 574
2009
-
[80]
C., Hearty, F
Wilson, J. C., Hearty, F. R., Skrutskie, M. F., et al. 2019, PASP, 131, 055001
2019
-
[81]
Woosley, S. E. & Weaver, T. A. 1995, ApJS, 101, 181 21
1995
Reviewed August 7, 2026 · model on record in the stance chip above.
Discussion (0). Sign in to comment.