REVIEW 3 major objections 5 minor 54 references
Understanding the European energy crisis through structural causal models
T0 review · 3 major / 5 minor · reviewed 2026-08-07 · deepseek-v4-flash
Pith's one-line read The paper argues that France's 2021–2023 electricity price surge was driven primarily by the natural gas price propagating through cross-border trade after nuclear unavailability made France import-dependent, and that structural causal…
desk verdict A transparent and mostly sound causal-decomposition study of the French price spike, with a clean Simpson's-paradox demonstration, but the headline +120 EUR/MWh gas attribution rests on a causal graph the data only weakly support. read the letter →
The pith
A machine-rendered reading of the paper's core claim, the machinery that carries it, and where it could break.
The reading
What carries the argument
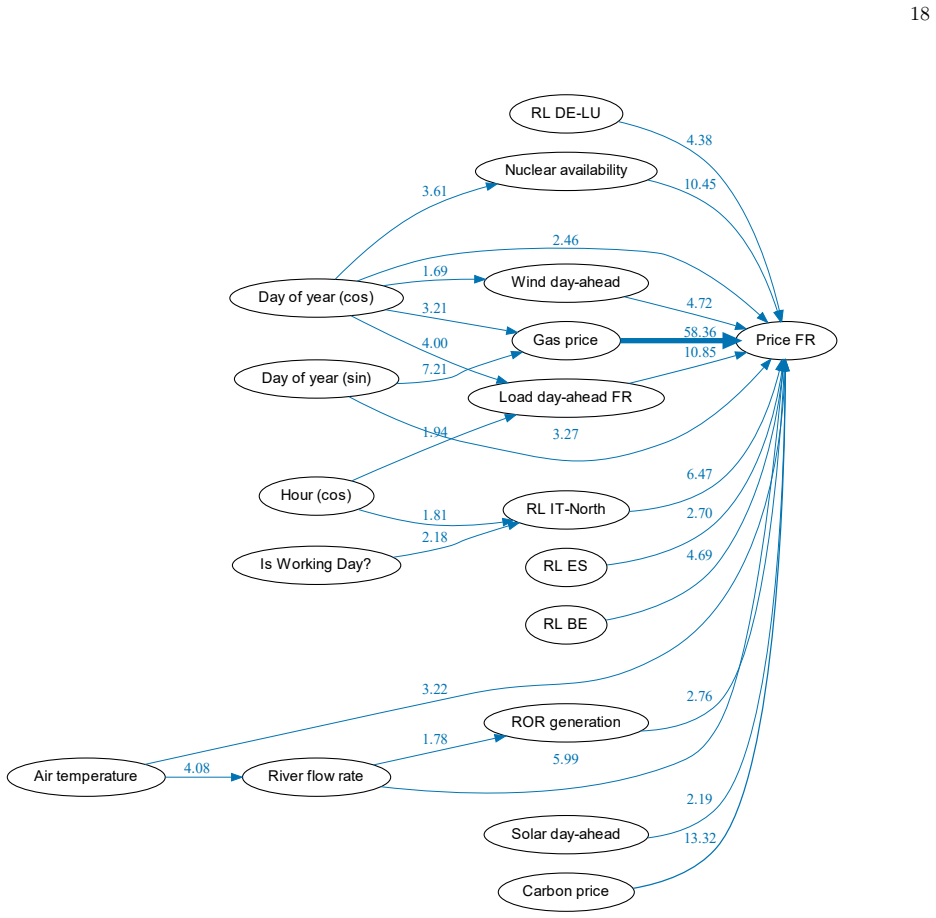
The load-bearing machinery is a causal graph over the relevant variables—gas price, carbon price, load, nuclear availability, residual loads of neighboring bidding zones, run-of-river generation, weather and calendar features—with structural equations $X_i := \sum_{j \in \mathrm{parents}(i)} c_{ij} X_j + U_i$ for each node. The structural coefficients $c_{ij}$ are read as direct causal effects, estimated by regression but interpreted causally, and indirect effects are obtained by multiplying coefficients along causal paths. For the non-linear check, Shapley flows attribute a gradient-boosted tree model's predictions to edges of the same causal graph, preserving the Shapley axioms while adding boundary consistency. The conditioning-by-load split that resolves the Simpson's paradox is the motivating step: the causal graph specifies which paths are confounded and what must be conditioned on to estimate a genuine causal effect.
What would settle it
Run an instrumental-variable analysis that uses the timing of unexpected nuclear outages, such as stress-corrosion inspections, to identify the effect of nuclear availability on French prices and net exports, and compare those estimates with the SCM's attribution of more than +120 EUR/MWh to gas and about −5.5 GW to nuclear availability; if instrumented nuclear effects are near zero while the SCM coefficients are large, the causal graph is falsified.
Extended reading notes
Core claim
Stated the way a sympathetic reader would state it, the paper's discovery is a causal decomposition of the French electricity price crisis. Using a linear structural causal model built on the graph of Fig. 3, the authors find that the natural gas price is the single most important variable for the French day-ahead electricity price, with the pre- to during-crisis gas increase accounting for more than +120 EUR/MWh; nuclear availability is the second factor and acts chiefly on net exports, with the availability drop producing about a −5.5 GW swing. The two channels are linked: with roughly half the nuclear fleet unavailable, France lost its export surplus and became dependent on imports, so prices in France moved with prices in gas-dependent neighboring markets. The paper further shows that a naive correlation between price and nuclear availability is positive—a Simpson's paradox—but reverses sign once load is conditioned on, and that non-linear gradient-boosted tree models with Shapley flows confirm the linear model's direct causal relations while revealing nonlinear indirect effects of temperature and river flow through load, cooling-water limits, and run-of-river hydro.
Load-bearing premise
The causal graph in Fig. 3 is assumed correct and causally sufficient, even though it violates 172 of 236 local Markov conditions and is accepted because it beats random permutations; if unseen common causes—such as stress-corrosion outages or global market sentiment—drive both gas prices and French prices, the estimated structural coefficients are not causal.
Editorial extensions
If this is right
- If the decomposition is right, French electricity prices were coupled to the European gas market through cross-border trade, so insulating France from future gas-price spikes requires either preserving enough domestic availability to stay a net exporter or restructuring market-coupling price formation.
- The nuclear availability channel acts mainly through net exports: a drop of roughly 20 GW in availability flipped France from exporter to importer and removed the price buffer that exports had provided.
- Naive regression overstates the river-flow effect on price by about a factor of three; the causal estimate of about 0.056 EUR/MWh per cubic meter per second implies that cooling-water restrictions and hydro droughts are second-order compared with gas and nuclear availability in determining French prices.
- Direct effects in the causal graph are approximately linear, so the linear structural causal model is a serviceable workhorse for the primary drivers, while indirect weather effects are nonlinear and require the Shapley-flow treatment.
- For southern Norway, the paper hypothesizes that the newly commissioned NordLink and North Sea Link interconnectors transmitted gas-driven price spikes into a hydro-dominated market, a claim it leaves for future work.
Reading between the lines
- If the gas-price channel is as dominant as the SCM says, then a counterfactual in which gas prices stayed at pre-crisis levels but nuclear availability fell as observed should predict only a modest French price rise; the paper does not run this counterfactual, but its coefficients make it directly testable.
- A natural robustness extension is to instrument the nuclear-outage channel with the timing of stress-corrosion inspections; this would independently test whether the SCM's causal attribution of the export swing is correct.
- The implied policy trade-off is sharp: market coupling transmits cheap-gas shocks into France in normal times, but during a gas crisis it transmits high gas prices inward; policies that keep France a net exporter would reduce both effects simultaneously.
- A natural extension is to feed the same causal graph with 2024–2025 data, after the nuclear fleet recovered and gas prices fell; the model predicts the French price gap should close through the same two channels, providing a clean out-of-sample check.
Editorial analysis
A structured set of objections, weighed in public.
Referee Report
Summary. The paper studies the French electricity market during the 2021-2023 European energy crisis. It first illustrates Simpson's paradox: unconditional correlations between nuclear availability and price/net exports have the 'wrong' sign, while load-stratified correlations have the expected sign. It then builds a linear structural causal model (SCM) on an expert-specified causal graph, fits structural equations to hourly data from 2018-2023, and uses the fitted coefficients multiplied by before/during mean shifts (Eq. 2) to attribute the crisis-period changes in French day-ahead prices and net exports to individual drivers. The central claims are that the gas price contributed more than +120 EUR/MWh to the French price increase and that lower nuclear availability contributed roughly -5.5 GW to net exports. The paper also fits a gradient-boosted tree model and applies Shapley flows to analyze direct and indirect effects, and it quantifies the indirect effect of river flow on prices and net exports via nuclear availability and run-of-river generation.
Significance. If the causal identification were secured, this would be a timely, policy-relevant quantification of a major energy crisis and a useful demonstration of causal inference tools in energy systems analysis. The paper has clear strengths: it releases code on GitHub, uses publicly documented data sources, gives a clean and instructive demonstration of Simpson's paradox in a real energy market, and reports model diagnostics transparently, including R2 values and local-Markov-condition violations. The qualitative narrative, that nuclear unavailability made France dependent on imports and thereby coupled French prices to neighboring gas-driven markets, is plausible and consistent with domain knowledge. However, the central quantitative attributions depend on identifying assumptions that the paper's own reported diagnostics substantially undermine: the causal graph violates most local Markov conditions, and the nonlinear model indicates that the direct price relations are not linear. The contribution is valuable as a methodological case study, but the specific quantitative claims are not yet established.
major comments (3)
- [Supplementary Information, Evaluation of SCMs] The acceptance of the causal graph in Fig. 3 rests on a permutation null: p_LMC = 0 because none of 50 node-permuted graphs violate fewer than 172 of 236 local Markov conditions. This only shows that the proposed graph is better than random permutations. It does not establish that the specific conditional-independence constraints encoded by the graph are compatible with the data; in fact, 172/236 violations means that most graph-implied independencies are rejected by the authors' own CI tests. Since Eq. (2) and Fig. 4 interpret the fitted structural coefficients as direct causal effects, the correctness of the graph is load-bearing for the central +120 EUR/MWh and -5.5 GW claims. The authors should report which LMCs are violated, examine whether the violations involve the parent sets of Price FR or Net exports FR, and provide a sensitivity analysis with respect to plausible alternative edges (for example, direct weather or crisis-phase links).
- [Results, Shapley flows; Supplementary Information, Further Shapley flow results] The main text states that 'the relations of the target and its parents in the causal graph are mostly linear, confirming the insights from the linear SCM.' The SI's Shapley flow dependence plots for the electricity-price target (Fig. 15, panels b, d, f) explicitly state: 'Contrary to the model for the net exports, the direct influence of the features is also non-linear.' Since the headline gas-price attribution is computed with the linear structural coefficient c_gas,price via Eq. (2), the linearity of the price equation is a load-bearing assumption and is contradicted by the authors' own nonlinear model. The authors should reconcile this contradiction, restrict the 'mostly linear' claim to the net-export model, or provide a nonparametric or bounded estimate of the gas-price effect.
- [Discussion; Eq. (1)] The Discussion acknowledges that nuclear availability has R2 = 0.44 and that an unforeseen stress-corrosion phenomenon drove many reactor outages in 2021/2022, then states that this is 'not crucial' because the analysis focuses on price and net exports. This does not follow: nuclear availability is a direct parent of both targets in Fig. 3. Omitted causes of nuclear availability leave the coefficients c_N,price and c_N,exports unbiased only if those omitted causes are independent of the other parents and of the target noise. During a crisis phase, unobserved common causes such as global market conditions or plant-specific operational shocks are likely to violate this condition. The authors should provide an identification argument or a latent-confounder sensitivity analysis for the coefficients that enter the -5.5 GW and price contributions.
minor comments (5)
- [Methods, Data sources and pre-processing] The sentence 'we use the total total scheduled exchanges' contains a duplicated word and should be corrected.
- [Fig. 2 caption] The caption says 'A liner fit to the entire dataset' and should read 'linear fit'.
- [Discussion] The phrase 'without the the option to compensate' contains a duplicated article and should be corrected.
- [Fig. 3 and Methods] Because the graph groups variables with the same neighbors, it is difficult for a reader to verify the exact edge set; providing a machine-readable edge list in the code repository would improve reproducibility and make the LMC analysis easier to audit.
- [References] Reference [11] for the TTF gas price data is incomplete, showing only 'Tba'; a full citation with access date and provider details should be supplied.
Circularity Check
The headline +120 EUR/MWh gas attribution is an in-sample rearrangement of the fitted linear SCM (Eq. 2), so the central quantitative claim reduces to the model's own fitted coefficients and observed mean shifts; the causal graph and linearity assumptions that would make it causal are not independently established.
-
fitted input called prediction
[Results / 'A structural causal model for electricity prices', Eq. (2) and Fig. 4c]
"To capture the role of each variable during the energy crisis, we also plot the quantity cij∆ ¯Xj = cij (⟨Xj⟩during − ⟨Xj⟩before), (2), where ⟨Xj⟩before/during denotes the average of the respective variable before and during the crisis. This variable quantifies how a change in the variable Xj during the energy crisis causally affected the variable Xi on average."
The headline attributions (+120 EUR/MWh for gas, -5.5 GW for nuclear availability) are not out-of-sample predictions or independent estimates: the structural coefficients cij are fitted by OLS on the full 2018-2023 sample, and ⟨Xj⟩during - ⟨Xj⟩before are mean shifts of that same sample. In a linear structural model, Σ cij ΔXj over parents is exactly the fitted mean change of the target between the two periods, so Fig. 4c/d is an arithmetic decomposition of the fitted regression, not a test of it. The causal interpretation is imported entirely from the assumed Fig.
full rationale
The paper's core causal attribution is computed via Eq. (2): c_ij times the before/during mean shift, where c_ij are structural coefficients estimated on the full 2018-2023 sample. In a linear model the sum of these terms is exactly the fitted mean change, so Fig. 4c/d is a decomposition of the fitted regression rather than an out-of-sample prediction or a parameter-free derivation. The causal reading depends entirely on the Fig. 3 graph being correct and causally sufficient and on linear structural equations; the SI reports 172/236 local Markov condition violations and accepts the graph only because it beats random node permutations, and the SI's Shapley-flow section states that the direct price-target relations are non-linear, contradicting the main text's 'mostly linear' claim. These are validity threats rather than tautologies, but they mean the quantitative headline reduces by construction to the fitted inputs plus assumptions. There is no load-bearing self-citation chain or imported uniqueness theorem: the graph is proposed in this paper and the Shapley-flow method is external; refs [9] and [24] from the same group are background variable-selection citations, not evidence that forces the result. The Simpson's-paradox demonstration is an empirical sign reversal under conditioning and is not circular. Overall, the central attribution has partial circularity because the 'prediction' is algebraically equivalent to the fit, but the sign and relative ranking of coefficients are data-dependent, so the paper is not a complete tautology.
Assumptions & free parameters
free parameters (4)
- Structural coefficients c_ij of the linear SCM =
e.g., gas price on day-ahead price contributing more than +120 EUR/MWh; nuclear availability on net exports…
- Crisis start date =
2021-10-01
- Load stratification into four chunks =
4 chunks (quantiles of load)
- XGBoost hyperparameters =
not specified (random search)
assumptions (5)
- domain assumption The causal graph in Fig. 3 correctly represents the causal structure: every arrow is a true direct cause, and no relevant causes of the targets are missing.
- domain assumption Causal sufficiency: there are no unobserved confounders affecting both a parent variable and the targets (price and net exports).
- domain assumption The generating mechanisms are linear with additive noise (Xi := sum cij Xj + Ui).
- domain assumption Gas price is exogenous to the French electricity market and has no parents in the graph; daily values are padded to hourly resolution.
- standard math Ordinary least squares assumptions hold, including uncorrelated errors and homoscedasticity.
Cite this review
Pith. "Pith review of Understanding the European energy crisis through structural causal models." pith.science (2026). https://pith.science/paper/3LGU6OEV
@misc{pith2026250600680,
  author       = {Pith},
  title        = {Pith review of: Understanding the European energy crisis through structural causal models},
  year         = {2026},
  howpublished = {\url{https://pith.science/paper/3LGU6OEV}},
  note         = {Machine review of arXiv:2506.00680}
}
read the original abstract
Natural gas supplies in Europe were disrupted and energy prices soared in the context of Russia's invasion of Ukraine. Electricity prices in France experienced the largest relative increase among European countries, even though natural gas plays a negligible role in the French electricity system. In this article, we demonstrate the importance of causal statistical methods and propose causal graphs to investigate the French electricity market and pinpoint key influencing factors on electricity prices and net exports. We demonstrate that a causal approach resolves paradoxical results of simple correlation studies and enables a quantitative analysis of indirect causal effects. We introduce a linear structural causal model as well as non-linear tree-based machine learning combined with Shapley flows. The models elucidate the interplay of gas prices and the unavailability of nuclear power plants during the energy crisis: The high unavailability made France dependent on imports and linked prices to neighbouring countries.
Figures


Figures from the paper (14 more)




Reference graph
Works this paper leans on
-
[1]
Chalvatzis, K. J. & Ioannidis, A. Energy supply security in the EU: Benchmarking diversity and dependence of primary energy.Applied Energy207, 465–476 (2017)
work page 2017
-
[2]
Pedersen, T. T., Gøtske, E. K., Dvorak, A., Andresen, G. B. & Victoria, M. Long-term implications of reduced gas imports on the decarbonization of the european en- ergy system.Joule6, 1566–1580 (2022)
work page 2022
-
[3]
W., Gurdgiev, C., Paltrinieri, A
Goodell, J. W., Gurdgiev, C., Paltrinieri, A. & Piserà, S. Global energy supply risk: Evidence from the reactions of european natural gas futures to nord stream announce- ments.Energy Economics125, 106838 (2023)
work page 2023
-
[4]
Goldthau, A. & Tagliapietra, S. Energy crisis: five ques- tions that must be answered in 2023.Nature612(2022)
work page 2022
-
[5]
Gars, J., Spiro, D. & Wachtmeister, H. The effect of european fuel-tax cuts on the oil income of russia.Nature Energy7, 989–997 (2022)
work page 2022
-
[6]
Ruhnau, O., Stiewe, C., Muessel, J. & Hirth, L. Natural gas savings in germany during the 2022 energy crisis. Nature Energy8, 621–628 (2023)
work page 2023
-
[7]
European Commission. REPowerEU Plan (COM/2022/230 final).https://eur-lex.europa.eu/ legal-content/EN/TXT/?uri=COM:2022:230:FIN (2022)
work page 2022
-
[8]
Council of the EU and the European Coun- cil. Where does the EU’s gas come from? https://www.consilium.europa.eu/en/infographics/ where-does-the-eu-s-gas-come-from/(2025)
work page 2025
Show all 54 references
-
[9]
& Witthaut, D
Trebbien, J., Tausendfreund, A., Rydin Gorjão, L. & Witthaut, D. Patterns and correlations in european elec- tricity prices.Chaos: An Interdisciplinary Journal of Nonlinear Science34(2024)
2024
-
[10]
Electricity Market Transparency — entsoe.eu.https://www.entsoe.eu/data/transparency- platform/
European Network of Transmission System Operators for Electricity. Electricity Market Transparency — entsoe.eu.https://www.entsoe.eu/data/transparency- platform/. [Accessed 06-02-2025]
2025
-
[11]
Thomson Reuters Workspace. Tba
-
[12]
Eurostat data brwoser.https: //ec.europa.eu/eurostat/databrowser/explore/ all/envir?lang=en&subtheme=nrg.nrg_quant.nrg_ quanta&display=list&sort=category
Eurostat. Eurostat data brwoser.https: //ec.europa.eu/eurostat/databrowser/explore/ all/envir?lang=en&subtheme=nrg.nrg_quant.nrg_ quanta&display=list&sort=category. [Accessed 06-02-2025]
2025
-
[13]
D., Luke, M
Jenkins, J. D., Luke, M. & Thernstrom, S. Getting to zero carbon emissions in the electric power sector.Joule 2, 2498–2510 (2018)
2018
-
[14]
& Pietzcker, R
Haywood, L., Leroutier, M. & Pietzcker, R. Why invest- ing in new nuclear plants is bad for the climate.Joule7, 1675–1678 (2023)
2023
-
[15]
Pahle, M.et al.Safeguarding the energy transition against political backlash to carbon markets.Nature En- ergy7, 290–296 (2022)
2022
-
[16]
& Reichenberg, L
Brown, T. & Reichenberg, L. Decreasing market value of variable renewables can be avoided by policy action. Energy Economics100, 105354 (2021)
2021
-
[17]
& Khodayar, M
Khodayar, M., Liu, G., Wang, J. & Khodayar, M. E. Deep learning in power systems research: A review. CSEE Journal of Power and Energy Systems7, 209–220 (2020)
2020
-
[18]
& Shakhnov, V
Strielkowski, W., Vlasov, A., Selivanov, K., Muraviev, K. & Shakhnov, V. Prospects and challenges of the ma- chine learning and data-driven methods for the predictive analysis of power systems: A review.Energies16, 4025 (2023)
2023
-
[19]
Schölkopf, B.et al.Toward causal representation learn- ing.Proceedings of the IEEE109, 612–634 (2021)
2021
-
[20]
& Jewell, N
Pearl, J., Glymour, M. & Jewell, N. P.Causal inference in statistics: A primer(John Wiley & Sons, 2016)
2016
-
[21]
& Lundberg, S
Wang, J., Wiens, J. & Lundberg, S. Shapley flow: A graph-based approach to interpreting model predictions. InInternational Conference on Artificial Intelligence and Statistics, 721–729 (2021)
2021
-
[22]
Energy balance in 2022: the crisis in nuclearpowergenerationcameattheworstpossibletime
Banque de France. Energy balance in 2022: the crisis in nuclearpowergenerationcameattheworstpossibletime. https://www.banque-france.fr/en/publications- and-statistics/publications/energy-balance- 2022-crisis-nuclear-power-generation-came- worst-possible-time(2023). Accessed on...
2023
-
[23]
& Erdmann, G
Praktiknjo, A. & Erdmann, G. Renewable electricity and backup capacities: an (un-) resolvable problem?The Energy Journal37, 89–106 (2016)
2016
-
[24]
R., Praktiknjo, A., Schäfer, B
Trebbien, J., Gorjão, L. R., Praktiknjo, A., Schäfer, B. & Witthaut, D. Understanding electricity prices beyond the merit order principle using explainable AI.Energy and AI13, 100250 (2023)
2023
-
[25]
Single Day-ahead Coupling (SDAC).https://www.entsoe.eu/network_codes/cacm/ implementation/sdac/
European Network of Transmission System Operators for Electricity (ENTSO-E). Single Day-ahead Coupling (SDAC).https://www.entsoe.eu/network_codes/cacm/ implementation/sdac/. Accessed on 2024-01-07
2024
-
[26]
& Delarue, E
Van den Bergh, K. & Delarue, E. Cycling of conventional power plants: Technical limits and actual costs.Energy Conversion and Management97, 70–77 (2015). 11
2015
-
[27]
& Genoese, M
Sensfuß, F., Ragwitz, M. & Genoese, M. The merit-order effect: A detailed analysis of the price effect of renewable electricity generation on spot market prices in germany. Energy policy36, 3086–3094 (2008)
2008
-
[28]
Euphemia Pub- lic Describtion
ALL NEMO COMMITTEE. Euphemia Pub- lic Describtion. Tech. Rep. (2020).https: //www.nemo-committee.eu/assets/files/euphemia- public-description.pdf
2020
-
[29]
Energy307, 132648 (2024)
Guénand, Y.et al.Climate change impact on nuclear power outages-part i: A methodology to estimate hydro- thermic environmental constraints on power generation. Energy307, 132648 (2024)
2024
-
[30]
T.et al.Global river discharge and water temperatureunderclimatechange.Global Environmental Change23, 450–464 (2013)
Van Vliet, M. T.et al.Global river discharge and water temperatureunderclimatechange.Global Environmental Change23, 450–464 (2013)
2013
-
[31]
T., Wiberg, D., Leduc, S
Van Vliet, M. T., Wiberg, D., Leduc, S. & Riahi, K. Power-generation system vulnerability and adaptation to changes in climate and water resources.Nature Climate Change6, 375–380 (2016)
2016
-
[32]
& Eisenack, K
Pechan, A. & Eisenack, K. The impact of heat waves on electricity spot markets.Energy Economics43, 63–71 (2014)
2014
-
[33]
M.et al.From local explanations to global understanding with explainable AI for trees.Nature ma- chine intelligence2, 56–67 (2020)
Lundberg, S. M.et al.From local explanations to global understanding with explainable AI for trees.Nature ma- chine intelligence2, 56–67 (2020)
2020
-
[34]
& O’malley, M
Heinen, S., Mancarella, P., O’dwyer, C. & O’malley, M. Heat electrification: The latest research in europe.IEEE Power and Energy Magazine16, 69–78 (2018)
2018
-
[35]
Energy scientists must show their work- ings.Nature542, 393–393 (2017)
Pfenninger, S. Energy scientists must show their work- ings.Nature542, 393–393 (2017)
2017
-
[36]
French Annual Elec- tricity Review 2022.https://analysesetdonnees.rte- france.com/en/electricity-review-keyfindings
Réseau de Transport d’Électricité. French Annual Elec- tricity Review 2022.https://analysesetdonnees.rte- france.com/en/electricity-review-keyfindings. [Accessed 14-02-2025]
2022
-
[37]
Python client for the ENTSO-E API.https: //github.com/EnergieID/entsoe-py
European Network of Transmission System Operators for Electricity. Python client for the ENTSO-E API.https: //github.com/EnergieID/entsoe-py. [Accessed 06-02- 2025]
2025
-
[38]
Single Day-ahead Cou- pling.https://www.entsoe.eu/network_codes/cacm/ implementation/sdac/
European Network of Transmission System Op- erators for Electricity. Single Day-ahead Cou- pling.https://www.entsoe.eu/network_codes/cacm/ implementation/sdac/. [Accessed 06-02-2025]
2025
-
[39]
Carbon pricing around the world.https: //www.statistiques.developpement-durable.gouv.fr/ edition-numerique/chiffres-cles-du-climat-2023/ en/17-carbon-pricing-around-the-world
Commissariat général au développement durable. Carbon pricing around the world.https: //www.statistiques.developpement-durable.gouv.fr/ edition-numerique/chiffres-cles-du-climat-2023/ en/17-carbon-pricing-around-the-world. [Accessed 06-02-2025]
2023
-
[40]
State and trends of carbon pricing dashboard.https:// carbonpricingdashboard.worldbank.org/compliance/ price
World Bank Group. State and trends of carbon pricing dashboard.https:// carbonpricingdashboard.worldbank.org/compliance/ price. [Accessed 06-02-2025]
2025
-
[41]
Euro foreign exchange reference rates.https://www.ecb.europa.eu/stats/policy_and_ exchange_rates/euro_reference_exchange_rates/ html/index.en.html
European Central Bank. Euro foreign exchange reference rates.https://www.ecb.europa.eu/stats/policy_and_ exchange_rates/euro_reference_exchange_rates/ html/index.en.html. [Accessed 07-05-2024]
2024
-
[42]
Free Open-Source Weather API.https: //open-meteo.com/
Open Meteo. Free Open-Source Weather API.https: //open-meteo.com/. [Accessed 06-02-2025]
2025
-
[43]
Hersbach, H.et al.The era5 global reanalysis.Quarterly Journal of the Royal Meteorological Society146, 1999– 2049 (2020)
2020
-
[44]
Eau france: Hub’eau
Office français de la biodiversité. Eau france: Hub’eau. https://hubeau.eaufrance.fr/. [Accessed 06-02-2025]
2025
-
[45]
Jours fériés en France
République française. Jours fériés en France. https://www.data.gouv.fr/en/datasets/jours- feries-en-france/. [Accessed 06-02-2025]
2025
-
[46]
Dowhy: Anend-to-endlibrary for causal inference.arXiv preprint arXiv:2011.04216 (2020)
Sharma, A.&Kiciman, E. Dowhy: Anend-to-endlibrary for causal inference.arXiv preprint arXiv:2011.04216 (2020)
2020 arXiv
-
[47]
Blöbaum, P., Götz, P., Budhathoki, K., Mastakouri, A. A. & Janzing, D. Dowhy-gcm: An extension of dowhy for causal inference in graphical causal models.Journal of Machine Learning Research25, 1–7 (2024)
2024
-
[48]
& Chult, D
Hagberg, A., Swart, P. & Chult, D. Exploring network structure, dynamics, and function using networkx (2008)
2008
-
[49]
& Guestrin, C
Chen, T. & Guestrin, C. XGBoost: A Scalable Tree Boosting System. InProceedings of the 22nd ACM SIGKDD International Conference on Knowledge Dis- covery and Data Mining, KDD ’16, 785–794 (Association for Computing Machinery, New York, NY, USA, 2016)
2016
-
[50]
& Immig, F
Tausendfreund, A., Schreyer, S. & Immig, F. Un- derstanding the european energy crisis through struc- tural causal models.https://github.com/ulrich- oberhofer/Understanding-the-European-energy- crisis-through-structural-causal-models(2025)
2025
-
[51]
Le nuove zone del mercato elettrico: quello che c’è da sapere.https://lightbox.terna.it/en/insight/new- electricity-market-zones
Trasmissione Elettricità Rete Nazionale. Le nuove zone del mercato elettrico: quello che c’è da sapere.https://lightbox.terna.it/en/insight/new- electricity-market-zones. [Accessed 24-01-2024]
2024
-
[52]
[Accessed 13-05-2025]
Fast and easy gridding of point data with geopan- das — james-brennan.github.io.https://james- brennan.github.io/posts/fast_gridding_geopandas/. [Accessed 13-05-2025]
2025
-
[53]
A., Blöbaum, P., Hardt, M
Eulig, E., Mastakouri, A. A., Blöbaum, P., Hardt, M. & Janzing, D. Toward falsifying causal graphs using a permutation-basedtest. InProceedings of the AAAI Con- ference on Artificial Intelligence, vol. 39, 26778–26786 (2025)
2025
-
[54]
Includes disk
Draper, N.&Smith, H.Applied Regression Analysis(Wi- ley, New York, NY, 1998), 3rd edn. Includes disk. Acknowledgements We thank Max Kleinebrahm and Wolf Fichtner for stimulating discussions. Author Contributions D.W. conceived research. D.W. and B.S. designed and supervised re...
1998
Reviewed August 7, 2026 · model on record in the stance chip above.
Discussion (0). Sign in to comment.