REVIEW 3 major objections 5 minor 44 references
Generalized nearest-neighbor distance and Hawkes point process modeling applied to mining induced seismicity
T0 review · 3 major / 5 minor · reviewed 2026-08-07 · deepseek-v4-flash
Pith's one-line read The paper claims that the nearest-neighbor distance method remains valid when the magnitude weight is an arbitrary fitted density, and that applying it to a Saskatchewan potash-mine catalog reveals clustering while Hawkes and ETAS…
desk verdict Generalizing NND to non-GR magnitude distributions is a real idea, but the paper sells it without a synthetic test and overreads the Hawkes result; worth peer review with heavy revision. read the letter →
The pith
A machine-rendered reading of the paper's core claim, the machinery that carries it, and where it could break.
The reading
What carries the argument
The central object is the rescaled nearest-neighbor proximity $\eta_{ij}=t_{ij}\,r_{ij}^{d_f}\,f(m_i)$ from equation (1), decomposed into temporal and spatial factors with $q=p=1/2$: $T_{ij}=t_{ij}[f(m_i)]^{1/2}$ and $R_{ij}=r_{ij}^{d_f}[f(m_i)]^{1/2}$. Here $f(m)$ is a probability density, converted from the moment-domain density $f_{\mathrm{mix}}(M)$ of a mixture of two tapered Pareto distributions; the tapered Pareto distribution is a power-law moment distribution with an exponential roll-off at a corner moment $M_{\mathrm{cm}}$. The threshold on $\eta$, fixed at the intersection of two Gaussian components fitted to $\log_{10}\eta$, separates background from clustered events. The second piece of machinery is the Hawkes conditional intensity $\lambda_\omega(t|\mathcal{H}_t)=\mu+A\sum_{i:t_i<t}e^{-\alpha(t-t_i)}$, which separates a constant background rate $\mu$ from exponentially decaying triggering.
What would settle it
A synthetic catalog with known injected clusters, a bimodal magnitude distribution, and a randomized background, processed with the same mixture-density weight, would falsify the central claim if the nearest-neighbor threshold fails to separate the injected clusters from background or if a fully randomized catalog produces the same bimodal $\eta$ separation.
Extended reading notes
Core claim
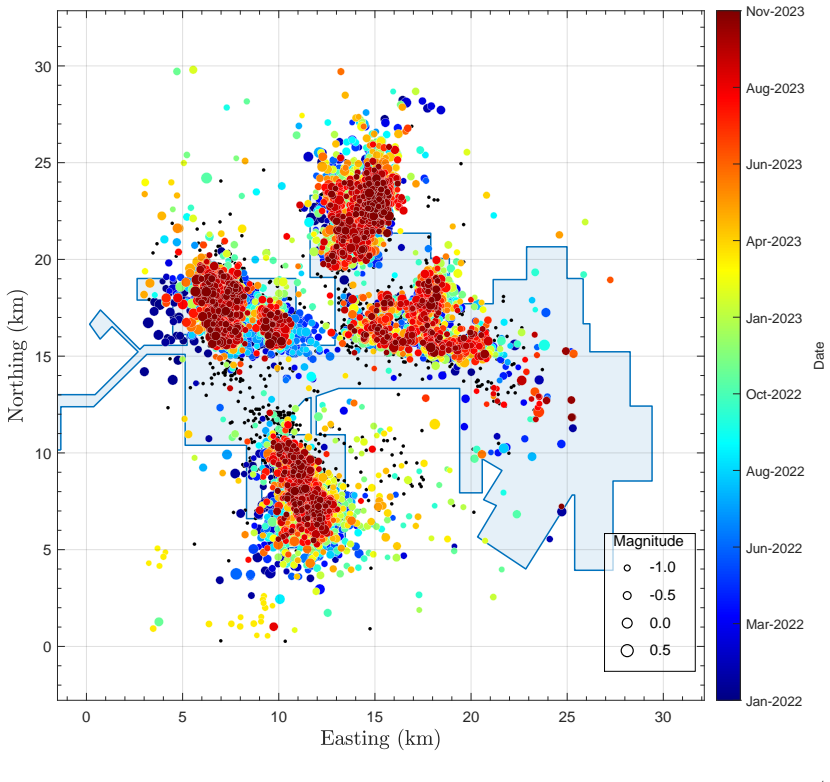
The paper's central claim, on its own terms, is that equations (1)–(3) define a valid generalized NND method: replacing the Gutenberg–Richter weight $10^{-b m}$ with any probability density $f(m)$ for event magnitudes preserves the interpretation of $\eta_{ij}=t_{ij}r_{ij}^{d_f}f(m_i)$ as a rescaled proximity whose smallest value $\eta_j$ identifies the parent event. For the study catalog, $f(m)$ is converted from a mixture of two tapered Pareto distributions in the moment domain, chosen by AIC over Pareto and single tapered Pareto alternatives. The resulting $\log_{10}\eta$ distribution is bimodal, with the Gaussian-mixture intersection at $\log_{10}\eta_{\mathrm{thresh}}=-1.822$, yielding 9070 background events and the remaining events organized into 1196 cluster trees with more than one event. The temporal Hawkes model fits the observed rate well with the estimates above, and the ETAS comparison shows a near-zero magnitude-scaling exponent; the paper reads these together as evidence that mining-induced microseismicity at this site is primarily external in origin.
Load-bearing premise
The load-bearing premise is that putting an arbitrary probability density $f(m)$—here the mixture of two tapered Pareto densities—into the NND rescaled distance in place of the standard $10^{-b m}$ weight preserves the method's clustering interpretation; no derivation, synthetic catalog test, or benchmark is given to support that substitution.
Editorial extensions
If this is right
- If the generalized NND is valid, clustering and declustering can be applied to induced-seismicity catalogs whose magnitude statistics deviate from Gutenberg–Richter, not just to tectonic catalogs.
- For this potash mine, the identified 9070 background events and 1196 multi-event clusters provide a concrete decomposition that can feed into hazard and forecasting analyses.
- The near-zero ETAS magnitude-scaling exponent implies that event magnitudes carry little information about triggering at this site, so forecasting should lean on the Hawkes background rate and external covariates rather than magnitude-dependent productivity.
- The mixture-of-two-tapered-Pareto fit gives a parameterized description of the bimodal magnitude distribution that can be reused as the weight in NND for other mining or injection catalogs with similar bimodality.
Reading between the lines
- The paper argues the generalization on plausibility and a case study, but does not prove it; a natural extension is to re-derive the weight from a survival function $S(m)$ rather than a density $f(m)$, since the standard $10^{-b m}$ factor is proportional to the survival function under Gutenberg–Richter, and to test both on synthetic catalogs with known cluster structure.
- If the ETAS exponent being zero means triggered rates are magnitude-independent, the Hawkes background rate can be treated as a measurable operational forcing; regressing it against daily excavation or blasting records would test the external-driving conclusion directly.
- Because the catalog is proprietary, an independent check would require re-running the same pipeline on another induced-seismicity catalog with a bimodal magnitude distribution; the method's value is only as stable as the fitted mixture across such catalogs.
Editorial analysis
A structured set of objections, weighed in public.
Referee Report
Summary. The paper proposes a generalization of the nearest-neighbor distance (NND) method in which the standard Gutenberg-Richter magnitude weight 10^{-b m} is replaced by an arbitrary probability density f(m), here a mixture of two tapered Pareto distributions fitted to mining-induced microseismicity from a Saskatchewan potash mine. The authors apply the generalized NND with a two-component Gaussian mixture threshold to separate background from clustered events, and they fit a temporal Hawkes process to the event rate. The abstract concludes that the generalized NND accommodates non-GR frequency-magnitude statistics in clustering analysis and that the Hawkes fit indicates the seismicity is primarily driven by external factors with weak interevent triggering.
Significance. If the proposed generalization is valid, it would extend NND-based clustering to induced-seismicity catalogs whose magnitude distributions deviate from Gutenberg-Richter scaling, which is a practically relevant class of problems. The paper has notable strengths: it reports maximum-likelihood fits with confidence intervals, compares magnitude-distribution models using AIC, includes a randomized-catalog null comparison for the NND analysis, and makes the analysis scripts available on GitHub. However, the central methodological step, replacing the NND magnitude weight by a probability density, is neither derived nor tested on synthetic catalogs, and the GMM threshold is applied to a nearly unimodal distribution without uncertainty quantification. The Hawkes interpretation also needs scrutiny in light of the implied branching ratio. These issues affect the two main claims of the paper and require revision before the results can be considered established.
major comments (3)
- [Statistical methods, Eqs. (1)-(3)] The central generalization replaces the standard NND magnitude weight 10^{-b m_i} with an arbitrary probability density f(m_i). For an exponential Gutenberg-Richter distribution, the density and the survival function are proportional, so this substitution is harmless there. For the fitted mixture of two tapered Pareto distributions, however, f(m) and the survival function S(m) differ by a magnitude- and shape-dependent factor, and the paper gives no derivation or physical argument that the density is the correct weight. The NND framework's ability to separate background from triggered events is a property of the specific rescaling, so the authors should provide a synthetic-catalog test with known clusters, or an analytic derivation, demonstrating that the generalized eta still separates the two populations. This matters because every downstream quantity (log10(eta_thresh) = -1.822, 9070 background events, 1196 family trees, and the cluster classification in Figure 4) depends on this unvalidated choice.
- [Results, Figure 3] The distribution of log10(eta) in Figure 3c does not show the clear bimodality usually exploited in NND studies, as the authors themselves acknowledge. Fitting a two-component GMM to a nearly unimodal density and taking the intersection of the components as a threshold is an unstable procedure; no uncertainty is reported for the threshold, and no sensitivity is shown to the number of GMM components, initialization, or alternative selection criteria. Since this threshold determines the classification of all 10,858 events and all subsequent cluster statistics, the authors should report bootstrap confidence intervals, display the considered one- to four-component fits for eta, and document how much the background/cluster split changes under plausible perturbations of the model.
- [Results, Hawkes model and Eq. (7)] The claim that the seismicity 'lacks pronounced interevent triggering' and is 'primarily driven by external factors' is not directly supported by the fitted Hawkes parameters. For the exponential triggering kernel in Eq. (7), the expected number of direct triggered events per event is A/alpha, approximately 0.7/1.3 = 0.54 at the point estimates, and the stationary background fraction is approximately 1 - A/alpha = 0.46. Thus the background rate is not a clear majority, and each event produces on average more than half an offspring. The authors should report the branching ratio with its uncertainty and either revise the interpretation or provide additional evidence (for example, a likelihood comparison with a purely Poisson process) before concluding that external factors dominate over interevent triggering.
minor comments (5)
- [Statistical methods, Eq. (5)] The text states that 'alpha and beta are the shape parameters for the tapered Pareto distribution', but beta does not appear in Eq. (5); please either define beta in the equation or correct the sentence.
- [Figure 3 caption] The word 'straistepplot' should be 'stairstep plot'.
- [Conclusions] The word 'mircoseismic' should be 'microseismic'.
- [Results, Figure 3c] The procedure for generating the randomized catalog shown as the blue stairstep plot is not described; please specify whether time and space were randomized independently or jointly and how many randomizations were used.
- [Results, generalized NND] The fractal dimension d_f = 1.6 is justified only by a literature range of 1.2-1.8; the paper would be strengthened by estimating the correlation dimension of this catalog or by reporting the sensitivity of the cluster classification to d_f.
Circularity Check
No significant circularity: the generalized NND and Hawkes results are in-sample descriptive fits whose parameters are estimated from the analyzed catalog, which is standard practice for NND; the unvalidated density-versus-survival weighting is a validation gap, not a circular reduction.
full rationale
The derivation chain in this paper is descriptive rather than predictive. Equations (1)-(3) define a rescaled nearest-neighbor distance with an arbitrary magnitude weight; the specific weight is the MLE-fitted mixture of two tapered Pareto distributions (6), and the cluster separation is obtained by fitting a two-component GMM to the resulting log10(eta) distribution. The threshold log10(eta_thresh) = -1.822, the 9070 background events, and the 1196 family trees are in-sample outputs of this clustering procedure, not predictions of a fitted parameter. This mirrors the standard NND method, where the b-value is also fitted to the same catalog. The Hawkes and ETAS results are direct MLE outputs (mu = 8.3, A = 0.7, alpha = 1.3); the conclusion that background processes dominate is an interpretation of those fitted values, not a quantity defined in terms of the conclusion. Self-citations, such as Sedghizadeh et al. (2023) for correlation with extraction rates in a different potash mine, are contextual and not load-bearing, and no uniqueness theorem is imported from the authors' prior work. The main caveat is that replacing the GR-based weight 10^(-b m) with an arbitrary probability density f(m) is introduced by assumption without a derivation or synthetic benchmark showing that the density, rather than the survival function, preserves the NND clustering interpretation. However, this is an assumption and validation limitation, not circularity, because the cluster results are not equivalent to the frequency-magnitude fit by construction. The paper is therefore self-contained relative to the circularity criteria, with no circular step to report.
Assumptions & free parameters
free parameters (4)
- Fractal dimension d_f =
1.6
- Mixture of two tapered Pareto parameters =
Reported in Table S1 (not in main text)
- NND cluster threshold log10(eta_thresh) =
-1.822
- Hawkes parameters mu, A, alpha =
8.3/day, 0.7/day, 1.3/day
assumptions (4)
- domain assumption The standard NND rescaled distance (equations 1-3) is a valid measure of seismic proximity and clustering.
- ad hoc to paper Replacing the GR-based magnitude weight 10^{-b m} with an arbitrary probability density f(m) preserves the NND framework's clustering interpretation.
- ad hoc to paper The frequency-magnitude distribution of the catalog is modeled correctly by the mixture of two tapered Pareto distributions.
- domain assumption The catalog is complete above magnitude m_c=-1.0.
Cite this review
Pith. "Pith review of Generalized nearest-neighbor distance and Hawkes point process modeling applied to mining induced seismicity." pith.science (2026). https://pith.science/paper/I5DF6BB3
@misc{pith2026250600768,
  author       = {Pith},
  title        = {Pith review of: Generalized nearest-neighbor distance and Hawkes point process modeling applied to mining induced seismicity},
  year         = {2026},
  howpublished = {\url{https://pith.science/paper/I5DF6BB3}},
  note         = {Machine review of arXiv:2506.00768}
}
read the original abstract
Modeling seismic activity rates and clustering plays an important role in studies of induced seismicity associated with mining and other resource extraction operations. This is critical for understanding the physical and statistical characteristics of seismicity and assessing the associated hazard. In this work, we introduce the generalization of the Nearest-Neighbor Distance (NND) method by incorporating an arbitrary distribution function for the frequency-magnitude statistics of seismic events. Operating within a rescaled hyperspace that includes spatial, temporal, and magnitude domains, the NND method provides an effective framework for examining seismic clustering. By integrating a mixture of the two tapered Pareto distributions, the generalized NND approach accommodates deviations from standard frequency-magnitude scaling when studying the clustering properties of seismicity. In addition, the application of the temporal Hawkes process to model the mining seismicity rate reveals that the seismicity is primarily driven by external factors and lacks pronounced interevent triggering. A case study from a potash mine in Saskatchewan is presented to illustrate the application of the generalized NND method and the Hawkes process to estimate the clustering properties and occurrence rates of induced microseismicity. The implications of observed temporal variations and clustering behavior are discussed, providing insights into the nature of induced seismicity within mining environments.
Figures


Figures from the paper (2 more)


Reference graph
Works this paper leans on
-
[1]
Atkinson, G. M., D. W. Eaton, H. Ghofrani, D. Walker, B. Cheadle, R. Schultz, R. Shcherbakov, K. Tiampo, J. Gu, R. M. Harrington, Y. J. Liu,M.vanderBaan,andH.Kao(2016). HydraulicfracturingandseismicityintheWesternCanadaSedimentaryBasin. Seismol. Res. Lett. 87(3),631–647. doi:10.1785/0220150263. Atkinson,G.M.,D.W.Eaton,andN.Igonin(2020). Developmentsinunde...
-
[2]
Baiesi, M. and M. Paczuski (2004). Scale-free networks of earthquakes and aftershocks. Phys. Rev. E 69(6), 066106. doi: 10.1103/PhysRevE.69.066106
- [3]
-
[4]
Barthwal, H., M. van den Berghe, and R. Shcherbakov (2024). Microseismic event locations and source mechanisms using dominant guidedwavesrecordedinanundergroundpotashmine. Geophysics 89(2),B51–B63. doi:10.1190/geo2023-0359.1
-
[5]
Bernabeu, A., J. C. Zhuang, and J. Mateu (2024). Spatio-temporal Hawkes point processes: A review.J. Agr. Biol. Envir. Stat. 30, 89–119. doi:10.1007/s13253-024-00653-7
- [6]
-
[7]
Cochran, E. S., Z. E. Ross, R. M. Harrington, S. L. Dougherty, and J. L. Rubinstein (2018). Induced earthquake families reveal distinctive evolutionarypatternsneardisposalwells. J. Geophys. Res. 123(9),8045–8055. doi:10.1029/2018jb016270. Cochran,E.S.,A.Wickham-Piotrowski,K.B.Kemna,R.M.Harrington,S.L.Dougherty,andA.F.P.Castro(2020). Minimalclusteringof in...
-
[8]
Estay, R., J. Vallejos, C. Pavez, and M. Bröner (2020). A comparison of characteristic parameters of mining related and tectonic seismic aftershocksequences. Int. J. Rock Mech. Min. Sci. 128,104242. doi:10.1016/j.ijrmms.2020.104242
Show all 44 references
-
[9]
Derkach, L
Funk, C., J. Derkach, L. MacKenzie, and J. N. Lawlor (2022). Rocanville potash deposit. Technical Report KL 305, Nutrien Ltd. National Instrument43-101TechnicalReport
2022
-
[10]
Isbister, T
Funk, C., J. Isbister, T. Leblanc, and R. Brehm (2019). How geophysics is used to understand geohazards in potash mines.CSEG Recorder 44(07)
2019
-
[11]
Gendzwill, D. J. and D. Stead (1992). Rock mass characterization around Saskatchewan potash mine openings using geophysical techniques:areview. Can. Geotech. J. 29(4),666–674. doi:10.1139/t92-073. Gibowicz,S.J.(2009). Seismicityinducedbymining:Recentresearch. Adv. Geophys. 51,...
1992 doi
-
[12]
Gibowicz, S. J. and S. Lasocki (2001). Seismicity induced by mining: Ten years later.Adv. Geophys. 44, 39–181. doi: 10.1016/S0065- 2687(00)80007-2. Gospodinov,D.,S.Dineva,andC.Dahnér-Lindkvist(2022). OntheapplicabilityoftheRETASmodelforforecastingaftershockprobability inunderg...
2001 doi
-
[13]
Cesca, E
Grigoli, F., S. Cesca, E. Priolo, A. P. Rinaldi, J. F. Clinton, T. A. Stabile, B. Dost, M. G. Fernandez, S. Wiemer, and T. Dahm (2017). Current challenges in monitoring, discrimination, andmanagement of induced seismicity related to underground industrial activities: AEuropean...
2017 doi
-
[14]
Gutenberg, B. and C. F. Richter (1944). Frequency of earthquakes in California. Bull. Seismol. Soc. Am. 4, 185–188. doi: 10.1785/BSSA0340040185
1944 doi
-
[15]
Hasegawa, H. S., R. J. Wetmiller, and D. J. Gendzwill (1989). Induced seismicity in mines in Canada – An overview.Pure Appl. Geophys. 129(3-4),423–453. doi:10.1007/Bf00874518. Hawkes,A.G.(1971). Spectraofsomeself-excitingandmutuallyexcitingpointprocesses. Biometrika 58(1),83–9...
1989 doi
-
[16]
Piegari, and W
Herrmann, M., E. Piegari, and W. Marzocchi (2022). Revealing the spatiotemporal complexity of the magnitude distribution and𝑏-value duringanearthquakesequence. Nat. Commun. 13(1),5087. doi:10.1038/s41467-022-32755-6
2022 doi
-
[17]
Zecevic, and D
Igonin, N., M. Zecevic, and D. W. Eaton (2018). Bilinear magnitude-frequency distributions and characteristic earthquakes during hydraulicfracturing. Geophys. Res. Lett. 45(23),12866–12874. doi:10.1029/2018gl079746
2018 doi
-
[18]
Kagan, Y. Y. (2002). Seismic moment distribution revisited: I. Statistical results.Geophys. J. Int. 148(3), 520–541. doi: 10.1046/j.1365- 246x.2002.01594.x
2002 arXiv
-
[19]
Karimi, K. and J. Davidsen (2023). Separating primary and secondary mechanisms for seismicity induced by hydraulic fracturing.Bull. Seismol. Soc. Am. 113(5),1982–1991. doi:10.1785/0120220200
2023 doi
-
[20]
Keranen, K. M. and M. Weingarten (2018). Induced seismicity.Annu. Rev. Earth Planet. Sci. 46, 149–174. doi: 10.1146/annurev-earth- 082517-010054. Kgarume,T.E.,S.M.Spottiswoode,andR.J.Durrheim(2010).Statisticalpropertiesofminetremoraftershocks. Pure Appl. Geophys. 167(1- 2),107...
2018 doi
-
[21]
Kosobokov, V. G. and S. A. Mazhkenov (1994). On similarity in the spatial distribution of seismicity.Comp. Seism. Geodyn. 1, 6–15. doi: 10.1029/CS001p0006
1994 doi
-
[22]
Shcherbakov, and G
Kothari, S., R. Shcherbakov, and G. Atkinson (2020). Statistical modeling and characterization of induced seismicity within the Western CanadaSedimentaryBasin. J. Geophys. Res. 125(12),e2020JB020606. doi:10.1029/2020JB020606
2020 doi
-
[23]
Krushelnitskii, K. V., P. N. Shebalin, I. A. Vorobieva, O. V. Selyutskaya, and A. O. Antipova (2024). The limits of applicability of the Gutenberg-Richter law in the problems of seismic hazard and risk assessment.Izv.-Phys. Solid Earth 60(5), 823–835. doi: 10.1134/S1069351324700757
2024 doi
-
[24]
Kwon, J., Y. C. Zheng, and M. Jun (2023). Flexible spatio-temporal Hawkes process models for earthquake occurrences.Spat. Stat. 54, 100728. doi:10.1016/j.spasta.2023.100728. Langenbruch,C.,M.Weingarten,andM.D.Zoback(2018). Physics-basedforecastingofman-madeearthquakehazardsinO...
2023
-
[25]
Leptokaropoulos, K. (2020). Magnitude distribution complexity and variation at The Geysers geothermal field.Geophys. J. Int. 222(2), 893–906. doi:10.1093/gji/ggaa208
2020 doi
-
[26]
Li, B. Q. (2025). Pore pressure inhibits clustering of induced earthquakes in Western Canada.Proc. Natl. Acad. Sci. U.S.A. 122(2), e2407345121. doi:10.1073/pnas.2407345121. https://www.seismosoc.org/publications/the-seismic-record/ • DOI: 00.0000/000000000 The Seismic Record 1...
2025 doi
-
[27]
Llenos, A. L. and A. J. Michael (2013). Modeling earthquake rate changes in Oklahoma and Arkansas: Possible signatures of induced seismicity. Bull. Seismol. Soc. Am. 103(5),2850–2861. doi:10.1785/0120130017. Llenos,A.L.andA.J.Michael(2020). Regionallyoptimizedbackgroundearthqu...
2013 doi
-
[28]
Llenos, A. L., A. J. Michael, A. M. Shumway, J. L. Rubinstein, K. L. Haynie, M. P. Moschetti, J. M. Altekruse, and K. R. Milner (2024). Forecastingthelong-termspatialdistributionofearthquakesforthe2023USNationalSeismicHazardModelusinggriddedseismicity. Bull. Seismol. Soc. Am. ...
2024 doi
-
[29]
Martinsson, J. and W. Törnman (2020). Modelling the dynamic relationship between mining induced seismic activity and production rates,depthandsize:Amine-widehierarchicalmodel. Pure Appl. Geophys. 177(6),2619–2639. doi:10.1007/s00024-019-02378-y
2020 doi
-
[30]
Nandan, B
Mizrahi, L., S. Nandan, B. M. Cabrera, and S. Wiemer (2024). suiETAS: Developing and testing ETAS-based earthquake models for Switzerland. Bull. Seismol. Soc. Am. 114(5),2591–2612. doi:10.1785/0120240007. Ogata,Y.(1988). Statistical-modelsforearthquakeoccurrencesandresidualana...
2024
-
[31]
Ogata, Y. (1998). Space-time point-process models for earthquake occurrences. Ann. Inst. Stat. Math. 50(2), 379–402. doi: 10.1023/A:1003403601725. Ogata,Y.(2024). HowtheETASmodelswerecreated,used,andevolved–Personalviewsandperspectives. Ann. Geophys. 67(4),S428–S428. doi:10.44...
1998
-
[32]
Schoenball, M., N. C. Davatzes, and J. M. G. Glen (2015). Differentiating induced and natural seismicity using space-time-magnitude statisticsappliedtotheCosoGeothermalfield. Geophys. Res. Lett. 42(15),6221–6228. doi:10.1002/2015gl064772
2015 doi
-
[33]
Schoenball, M. and W. L. Ellsworth (2017). A systematic assessment of the spatiotemporal evolution of fault activation through induced seismicityinOklahomaandSouthernKansas. J. Geophys. Res. 122(12),10189–10206. doi:10.1002/2017jb014850
2017 doi
-
[34]
Schoenberg, F. (2023). Estimating Covid-19 transmission time using Hawkes point processes.Ann. Appl. Stat. 17(4), 3349–3362. doi: 10.1214/23-Aoas1765
2023 doi
-
[35]
Schultz, R., R. J. Skoumal, M. R. Brudzinski, D. Eaton, B. Baptie, and W. Ellsworth (2020). Hydraulic fracturing-induced seismicity.Rev. Geophys. 58(3),e2019RG000695. doi:10.1029/2019rg000695. Sedghizadeh,M.,M.vandenBerghe,andR.Shcherbakov(2023).Statisticalandclusteringanalysi...
2020
-
[36]
van den Berghe, and R
Sedghizadeh, M., M. van den Berghe, and R. Shcherbakov (2024). Leveraging the ETAS model to forecast mining microseismicity. Geophys. J. Int. 238(3),1491–1504. doi:10.1093/gji/ggae236
2024 doi
-
[37]
Sepehr, K. and B. Stimpson (1988). Potash mining and seismicity – A time-dependent finite-element model.Int. J. Rock Mech. Min. Sci. 25(6),383–392. doi:10.1016/0148-9062(88)90978-3. Shcherbakov,R.,D.L.Turcotte,andJ.B.Rundle(2015). Complexityandearthquakes. InH.Kanamori(Ed.), E...
1988 doi
-
[38]
Lasocki, P
Urban, P., S. Lasocki, P. Blascheck, A. F. do Nascimento, N. V. Giang, and G. Kwiatek (2016). Violations of Gutenberg-Richter relation in anthropogenicseismicity. Pure Appl. Geophys. 173(5),1517–1537. doi:10.1007/s00024-015-1188-5
2016 doi
-
[39]
Vallejos, J. A. and S. D. McKinnon (2010). Omori’s law applied to mining-induced seismicity and re-entry protocol development.Pure Appl. Geophys. 167(1-2),91–106. doi:10.1007/s00024-009-0010-7. van der Elst, N. J., M. T. Page, D. A. Weiser, T. H. W. Goebel, and S. M. Hosseini ...
2010 doi
-
[40]
Zaliapin, I. and Y. Ben-Zion (2013). Earthquake clusters in southern California I: Identification and stability.J. Geophys. Res. 118(6), 2847–2864. doi:10.1002/jgrb.50179
2013 doi
-
[41]
Zaliapin, I. and Y. Ben-Zion (2022). Perspectives on clustering and declustering of earthquakes.Seismol. Res. Lett. 93(1), 386–401. doi: 10.1785/0220210127
2022 doi
-
[42]
Gabrielov, V
Zaliapin, I., A. Gabrielov, V. Keilis-Borok, and H. Wong (2008). Clustering analysis of seismicity and aftershock identification.Phys. Rev. Lett. 101(1),018501. doi:10.1103/Physrevlett.101.018501. https://www.seismosoc.org/publications/the-seismic-record/ • DOI: 00.0000/000000...
2008 doi
-
[43]
Lanza, I
Zhou, W., F. Lanza, I. Grigoratos, R. Schultz, J. Cousse, E. Trutnevyte, A. Muntendam-Bos, and S. Wiemer (2024). Managing induced seismicity risks from enhanced geothermal systems: A good practice guideline.Rev. Geophys. 62(4), e2024RG000849. doi: 10.1029/2024RG000849
2024 doi
-
[44]
Zipkin, J. R., F. P. Schoenberg, K. Coronges, and A. L. Bertozzi (2016). Point-process models of social network interactions: Parameter estimationandmissingdatarecovery. Eur. J. Appl. Math. 27(3),502–529. doi:10.1017/S0956792515000492. Manuscript Received 00 Month 0000 https:/...
2016 doi
Reviewed August 7, 2026 · model on record in the stance chip above.
Discussion (0). Sign in to comment.