REVIEW 3 major objections 5 minor 33 references
Binding energies of small interstellar molecules on neutral and charged amorphous solid water surfaces
T0 review · 3 major / 5 minor · reviewed 2026-08-07 · deepseek-v4-flash
Pith's one-line read A negatively charged amorphous solid water surface binds CO up to ~2.7 times more strongly, binds NH3 about 19% more weakly, and barely changes CH4, according to DFT site calculations.
desk verdict A useful first look at charged-ASW binding energies, but the strong CO enhancement is inflated by HCO-formation points that use a different reference state. read the letter →
The pith
A machine-rendered reading of the paper's core claim, the machinery that carries it, and where it could break.
The reading
What carries the argument
The machinery is a set of density functional calculations on one amorphous solid water cluster: 33 water molecules randomly packed in a 10 Å cube, relaxed in a neutral state and in an anionic state with one extra electron. The decisive object is the localized surface state that holds that electron—a molecular orbital composed mainly of dangling-hydrogen atomic orbitals, analogous to the LUMO of a single water molecule. The argument runs through what happens when each adsorbate meets that state: CO accepts the electron or abstracts H, producing high-binding-energy configurations; CH4 cannot interact with it, so its dispersion-dominated binding is unchanged; NH3 feels the extra negative charge as a repulsion that weakens its hydrogen bonds. The electronic-structure treatment is PBE0 with a diffuse triple-zeta basis and a D3(BJ) dispersion correction, benchmarked against CCSD(T) on a small charged water cluster to within about 10%, and the charged-surface method is further checked by reproducing a literature binding energy for HCO+ on negatively charged ASW to within 1.4%.
What would settle it
Recompute the 25-site binding-energy statistics on several independently generated neutral and charged ASW clusters: the charge-specific claim stands only if the average charged-minus-neutral binding energy keeps its sign for each molecule (strongly positive for CO, near zero for CH4, negative for NH3) across all clusters. Experimentally, temperature-programmed desorption from amorphous ice films pre-exposed to low-energy electrons should show an extra high-temperature CO desorption feature and a lower-temperature NH3 desorption peak compared to uncharged ice.
Extended reading notes
Core claim
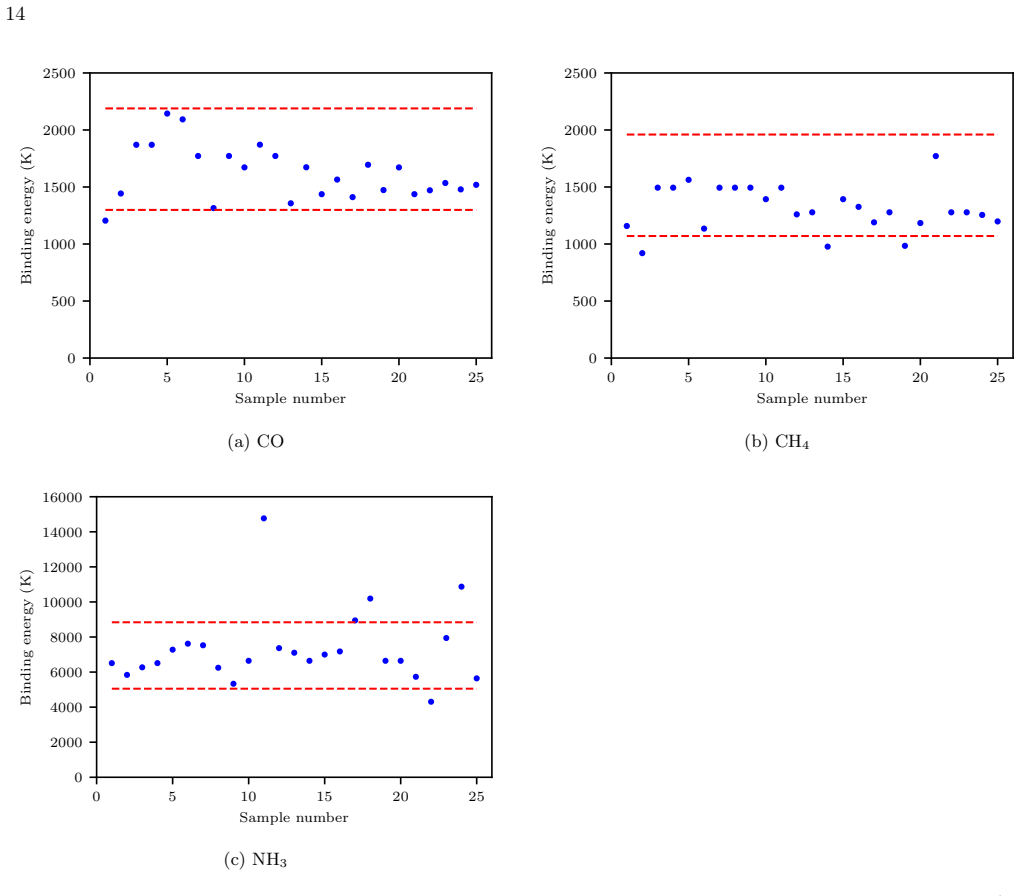
The central claim is that surface charge is a chemically active variable in interstellar ice chemistry, not a small correction to neutral-surface binding energies. On the charged cluster, the extra electron is trapped in a surface orbital built from dangling hydrogen atomic orbitals. CO is the only one of the three molecules that engages this charge: in four of the 25 sampled sites the electron migrates into CO's antibonding orbital, lengthening the C–O bond, or CO abstracts an H atom to form an HCO radical; these configurations bind at 4606–5734 K, against a neutral average of 1621 K. CH4 shows no interaction with the charge and its average binding energy changes by only 5%. NH3 forms hydrogen bonds as both donor and acceptor; on the charged surface the average hydrogen bond lengthens from 1.8084 Å to 1.8268 Å, the charge separation across the bond shrinks, and the average binding energy falls from 7310 K to 5926 K. The paper reads these three behaviors as evidence that gas-grain models should treat charged and neutral binding-energy distributions separately.
Load-bearing premise
The load-bearing assumption is that a single randomly generated 33-molecule amorphous water cluster, relaxed in neutral and anionic forms, represents interstellar amorphous ice well enough that the differences between its charged and neutral sites reflect the physics of charge rather than the fact that the two clusters relaxed to different shapes.
Editorial extensions
If this is right
- Astrochemical gas-grain models that currently assign one binding energy per species would need a second, charged-surface distribution: desorption and diffusion rates are exponential in binding energy, so the high-energy CO tail would keep some CO on grains until roughly 110 K instead of releasing it at 30 K.
- The electron-transfer and H-abstraction channels give charged mantles a direct route from accreting CO to HCO radicals, a chemically distinct starting point for further hydrogenation that neutral-surface models do not include.
- NH3 on negatively charged grains would desorb at lower temperatures—a single peak near 125 K rather than 140–170 K—which would shift where and when nitrogen is available in the gas phase during warm-up, according to the paper's toy desorption model.
- CH4 behaves the same on neutral and charged mantles, so its desorption temperature and grain-surface mobility do not need a charge correction in models.
Reading between the lines
- An implication the authors leave implicit is that the sign of the effect should reverse for a positively charged surface: NH3 would likely bind more strongly while CO would not have an electron to accept, a prediction testable with the same method.
- The single-cluster design suggests a direct robustness test: repeat the 25-site sampling on several independently generated clusters; if the sign of the charged-minus-neutral difference for each molecule does not survive across clusters, part of the reported effect is morphology rather than charge.
- Because the extra electron sits on dangling hydrogens, the magnitude of the CO effect should depend on surface porosity; compact ices with fewer dangling bonds would show fewer electron-transfer sites, which could be tested by comparing porous and compact charged clusters.
- A longer reach: if charged mantles convert CO to HCO on impact, then the local ionization environment of a cloud—not just its temperature history—could modulate the efficiency of CO hydrogenation, linking grain charging to the observed diversity of complex organic molecule abundances.
Editorial analysis
A structured set of objections, weighed in public.
Referee Report
Summary. The manuscript reports DFT calculations (PBE0/6-311++G(d,p) with D3(BJ) dispersion) of the binding energies of CO, CH4, and NH3 on a 33-molecule amorphous solid water cluster, comparing a neutral cluster with a negatively charged cluster. Twenty-five initial adsorption sites per molecule are used. The authors report a wider and higher CO binding-energy range on the charged surface, which they attribute to electron transfer and HCO formation; essentially unchanged CH4 binding energies; and a lower average NH3 binding energy on the charged surface. A zero-point-energy correction is approximated by a linear scaling BE0 = 0.8813 BE fitted to frequency calculations on representative configurations.
Significance. The question addressed is timely: interstellar dust grains can carry negative charge, and if binding energies of key ice constituents change on charged surfaces, gas-grain astrochemical models should incorporate this effect. The manuscript has clear strengths: the electronic-structure method is benchmarked against CCSD(T) for a charged water cluster, and the HCO+ binding energy on charged ASW is reproduced within 1.4% of the value reported by Rimola et al. These external anchors give reasonable confidence in the level of theory. However, the central claim about CO rests on a small number of configurations, three of which are computed with a different reference state than Eq. (1), and the single-cluster design does not allow the charge effect to be separated from morphology changes. As a result, the paper currently provides qualitative hints rather than a robust quantitative result.
major comments (3)
- [Sec. 3.1, Eq. (1)] For the three HCO-formation configurations, the binding energy is defined as the binding energy of HCO on an ASW surface with one hydrogen atom removed. This is not the quantity defined in Eq. (1), which requires E(CO)+E(ASW-) in the separated-reference term. The HCO-formation values (average 4606 K in Fig. 5c) therefore measure the stability of a reaction product on a hydrogen-deficient surface, not the binding energy of CO to the original charged ASW. Since these three points are part of the high-energy tail that drives the conclusion (Table 3, Fig. 5a) and the 110 K desorption feature in Fig. 16, the claim that CO binding energy increases on charged ASW is not supported by the majority of the elevated configurations. These configurations should be reported separately, e.g., as reactive-sticking or product binding energies, and the conclusion should be revised accordingly.
- [Sec. 2, Fig. 2] The neutral and charged clusters are optimized independently and are not the same structure, as the manuscript itself notes for Fig. 2a/b. The differences in binding-energy distributions between charge states are therefore entangled with the difference in local morphology. In addition, all statistics are drawn from one 33-molecule cluster and 25 grid positions, with no standard deviations or confidence intervals reported. The ranges in Table 3 cannot be taken as robust distributions for interstellar ASW. The authors should at least compute the neutral-surface binding energies on the charged-cluster geometry (and vice versa) to isolate the charge effect, or use several independent clusters.
- [Sec. 3.1, Sec. 4.3] The electron-transfer channel, which is the single remaining high-binding-energy configuration for CO with a consistent reference state, is not benchmarked. The CCSD(T) benchmark in Table 1 concerns a negatively charged water cluster, and the Rimola et al. comparison concerns HCO+ on ASW; neither tests the accuracy of PBE0 for the CO-...ASW or HCO...ASW systems that carry the main conclusion. A wavefunction benchmark (e.g., CCSD(T) or at least MP2) for one electron-transfer and one HCO-formation configuration would substantially strengthen the central claim. Without it, the reader cannot distinguish a real charge-induced enhancement from a density-functional artifact.
minor comments (5)
- [Sec. 2] The text refers to 'figure 2d' when placing molecules on the 5x5 grid, but the figure does not show a panel (d); either add the panel or correct the reference.
- [Sec. 3.4] The linear ZPE scaling BE0 = 0.8813 BE is fit through the authors' own data and is not justified for charge-transfer and HCO-formation configurations, whose vibrational densities differ qualitatively; since the uncorrected values are used in the main discussion, this is a caveat rather than an error.
- [Sec. 4.2] The name 'Fererro' is a typo for 'Ferrero'.
- [Sec. 4.4, Fig. 11] There are minor language issues: 'untill' should be 'until', and the caption of Fig. 11(b) refers to 'a charge' surface where 'a charged' is intended.
- [Sec. 2, Table 3] The spin multiplicity of the anionic cluster is not reported; it should be stated explicitly. In addition, Table 3 would benefit from including the standard deviation of the 25 samples for each molecule and charge state.
Circularity Check
The charged-surface CO binding-energy increase is definitionally built from HCO binding energies to a dehydrogenated surface, not from Eq. (1) CO binding energies.
-
self definitional
[Sec. 3.1 (CO results), Table 3, Fig. 5c; propagated to Sec. 4.3 and Sec. 4.4]
"To determine the binding energy after HCO formation, we calculate it as the binding energy of HCO on the ASW surface with one hydrogen atom removed."
Equation (1) fixes the reference state as the free adsorbate plus the intact ASW surface: BE = [E(molecule)+E(ASW)] - E(molecule+ASW). For the three HCO-formation points, however, the reference is changed to E(HCO) plus E(ASW with one H removed). Those points therefore measure HCO binding to a dehydrogenated, damaged surface, not CO binding to the original charged ASW. The paper nevertheless reports them as CO charged-surface binding energies, which is what raises the charged maximum to 5734 K (Table 3) and creates the high tail in Fig. 5a and the 110 K desorption peak in Sec. 4.4.
full rationale
Apart from the HCO-formation reference-state substitution, the paper's derivation chain is not circular. The method is anchored to external benchmarks (CCSD(T)/Aug-CC-pVTZ for the charged water cluster; the HCO+ binding energy of Rimola et al. 2021), and the neutral binding energies are compared with Ferrero et al. 2020. The ZPE correction factor BE(0)=0.8813 BE is a fit to the paper's own frequency calculations, but the main neutral-vs-charged comparisons and all Table 3 values are uncorrected, so the fit does not drive the conclusions. CH4 and NH3 conclusions rest on the same cluster but on ordinary Eq. (1) energies and are not affected by the HCO redefinition. The deeper sampling limitation is that all statistics come from 25 sites on one Packmol-generated 33-molecule cluster whose neutral and anionic forms relax to different morphologies; that is a representativeness/correctness risk, not circularity. The single genuine circular step is the CO/HCO redefinition documented above, which partially constructs the headline CO enhancement, warranting a score of 6 rather than 0.
Assumptions & free parameters
free parameters (1)
- Zero-point-energy correction factor =
0.8813
assumptions (3)
- domain assumption PBE0/6-311++G(d,p)+D3(BJ) accurately describes charged water clusters and adsorption of CO, CH4, and NH3.
- domain assumption One random 33-molecule ASW cluster is representative of interstellar amorphous water ice.
- ad hoc to paper Zero-point-energy corrections scale linearly with uncorrected binding energies.
Cite this review
Pith. "Pith review of Binding energies of small interstellar molecules on neutral and charged amorphous solid water surfaces." pith.science (2026). https://pith.science/paper/7MMYD6VO
@misc{pith2026250601431,
  author       = {Pith},
  title        = {Pith review of: Binding energies of small interstellar molecules on neutral and charged amorphous solid water surfaces},
  year         = {2026},
  howpublished = {\url{https://pith.science/paper/7MMYD6VO}},
  note         = {Machine review of arXiv:2506.01431}
}
read the original abstract
The interstellar medium (ISM) is all but empty. To date, more than 300 molecules have already been discovered. Because of the extremely low temperature, the gas-phase chemistry is dominated by barrierless exothermic reactions of radicals and ions. However, several abundant molecules and organic molecules cannot be produced efficiently by gas-phase reactions. To explain the existence of such molecules in the ISM, gas-surface interactions between small molecules and dust particles covered with amorphous solid water (ASW) mantles must be considered. In general, surface processes such as adsorption, diffusion, desorption, and chemical reactions can be linked to the binding energy of molecules to the surface. Hence, a lot of studies have been performed to identify the binding energies of interstellar molecules on ASW surfaces. Cosmic radiation and free electrons may induce a negative charge on the dust particles, and the binding energies may be affected by this charge. In this study, we calculate the binding energies of CO, CH4, and NH3, on neutral and charged ASW surfaces using DFT calculations. Our results indicate that CO can interact with the surface charge, increasing its binding energy. In contrast, the binding energy of CH4 remains unchanged in the presence of surface charge, and that of NH3 typically decreases.
Figures


Figures from the paper (13 more)




Reference graph
Works this paper leans on
-
[1]
1999, The Journal of chemical physics, 110, 6158
Adamo, C., & Barone, V. 1999, The Journal of chemical physics, 110, 6158
work page 1999
-
[2]
Al-Halabi, A., Fraser, H. J., Kroes, G. J., & Dishoeck, E. F. V. 2004, Astronomy & Astrophysics, 422, 777
work page 2004
-
[3]
2019, Journal of chemical theory and computation, 16, 443
Amati, M., Stoia, S., & Baerends, E. 2019, Journal of chemical theory and computation, 16, 443
work page 2019
-
[4]
2014, Accounts of chemical research, 47, 2592
Autschbach, J., & Srebro, M. 2014, Accounts of chemical research, 47, 2592
work page 2014
-
[5]
M., Vogt-Geisse, S., Bovino, S., & Grassi, T
Bovolenta, G. M., Vogt-Geisse, S., Bovino, S., & Grassi, T. 2022, The Astrophysical Journal Supplement Series, 262, 17
work page 2022
-
[6]
2017, Space Science Reviews, 212, 1
Cuppen, H., Walsh, C., Lamberts, T., et al. 2017, Space Science Reviews, 212, 1
work page 2017
-
[7]
Das, A., Sil, M., Gorai, P., Chakrabarti, S. K., & Loison, J.-C. 2018, The Astrophysical Journal Supplement Series, 237, 9
work page 2018
-
[8]
1987, The Astrophysical Journal, 320, 803
Draine, B., & Sutin, B. 1987, The Astrophysical Journal, 320, 803
work page 1987
Show all 33 references
-
[9]
2021, Frontiers in Astronomy and Space Sciences, 24
Duflot, D., Toubin, C., & Monnerville, M. 2021, Frontiers in Astronomy and Space Sciences, 24
2021
-
[10]
2019, ACS Earth and Space Chemistry, 3, 2158
Enrique-Romero, J., Rimola, A., Ceccarelli, C., et al. 2019, ACS Earth and Space Chemistry, 3, 2158
2019
-
[11]
2020, The Astrophysical Journal, 904, 11
Ferrero, S., Zamirri, L., Ceccarelli, C., et al. 2020, The Astrophysical Journal, 904, 11
2020
-
[12]
J., Trucks, G
Frisch, M. J., Trucks, G. W., Schlegel, H. B., et al. 2016, Gaussian˜16 Revision C.01
2016
-
[13]
2011, Journal of computational chemistry, 32, 1456
Grimme, S., Ehrlich, S., & Goerigk, L. 2011, Journal of computational chemistry, 32, 1456
2011
-
[14]
V., Padovani, M., Galli, D., & Caselli, P
Ivlev, A. V., Padovani, M., Galli, D., & Caselli, P. 2015, The Astrophysical Journal, 812, 135
2015
-
[15]
2010, Journal of chemical theory and computation, 6, 2726 Mart ´ ınez, L., Andrade, R., Birgin, E
Jensen, F. 2010, Journal of chemical theory and computation, 6, 2726 Mart ´ ınez, L., Andrade, R., Birgin, E. G., & Mart ´ ınez, J. M. 2009, Journal of computational chemistry, 30, 2157
2010
-
[16]
1956, Monthly Notices of the Royal Astronomical Society, 116, 503
Mestel, L., & Spitzer Jr, L. 1956, Monthly Notices of the Royal Astronomical Society, 116, 503
1956
-
[17]
2022, ACS Earth and Space Chemistry, 6, 597
Minissale, M., Aikawa, Y., Bergin, E., et al. 2022, ACS Earth and Space Chemistry, 6, 597
2022
-
[18]
2009, The Astrophysical Journal, 698, 1122
Okuzumi, S. 2009, The Astrophysical Journal, 698, 1122
2009
-
[19]
2020, The Astrophysical Journal, 897, 56
Pantaleone, S., Enrique-Romero, J., Ceccarelli, C., et al. 2020, The Astrophysical Journal, 897, 56
2020
-
[20]
2017, The Astrophysical Journal, 844, 71
Penteado, E., Walsh, C., & Cuppen, H. 2017, The Astrophysical Journal, 844, 71
2017
-
[21]
P., Ernzerhof, M., & Burke, K
Perdew, J. P., Ernzerhof, M., & Burke, K. 1996, The Journal of chemical physics, 105, 9982
1996
-
[22]
P., Parr, R
Perdew, J. P., Parr, R. G., Levy, M., & Balduz Jr, J. L. 1982, Physical Review Letters, 49, 1691
1982
-
[23]
P., & Zunger, A
Perdew, J. P., & Zunger, A. 1981, Physical Review B, 23, 5048
1981
-
[24]
2021, Frontiers in Astronomy and Space Sciences, 8, 655405
Rimola, A., Ceccarelli, C., Balucani, N., & Ugliengo, P. 2021, Frontiers in Astronomy and Space Sciences, 8, 655405
2021
-
[25]
2014, Astronomy & Astrophysics, 572, A70 Spitzer Jr, L
Ceccarelli, C. 2014, Astronomy & Astrophysics, 572, A70 Spitzer Jr, L. 1941, Astrophysical Journal, vol. 93, p. 369, 93, 369
2014
-
[26]
Tielens, A. G. G. M. 2005, The physics and chemistry of the interstellar medium (Cambridge University Press)
2005
-
[27]
2022, ACS Earth and Space Chemistry, 6, 1514, doi: 10.1021/acsearthspacechem.2c00040
Tinacci, L., Germain, A., Pantaleone, S., et al. 2022, ACS Earth and Space Chemistry, 6, 1514, doi: 10.1021/acsearthspacechem.2c00040
2022 doi
-
[28]
2021, Accounts of Chemical Research, 54, 471, doi: 10.1021/acs.accounts.0c00634
Tsuge, M., & Watanabe, N. 2021, Accounts of Chemical Research, 54, 471, doi: 10.1021/acs.accounts.0c00634
2021 doi
-
[29]
A., Scuseria, G
Vydrov, O. A., Scuseria, G. E., & Perdew, J. P. 2007, The Journal of chemical physics, 126
2007
-
[30]
2017, Molecular Astrophysics, 6, 22
Wakelam, V., Loison, J.-C., Mereau, R., & Ruaud, M. 2017, Molecular Astrophysics, 6, 22
2017
- [31]
-
[32]
Woon, D. E. 2023, Monthly Notices of the Royal Astronomical Society, 527, 1357, doi: 10.1093/mnras/stad3242
2023 doi
-
[33]
2018, Monthly Notices of the Royal Astronomical Society, 480, 1427
Zamirri, L., Casassa, S., Rimola, A., et al. 2018, Monthly Notices of the Royal Astronomical Society, 480, 1427
2018
Reviewed August 7, 2026 · model on record in the stance chip above.
Discussion (0). Sign in to comment.