REVIEW 3 major objections 4 minor 1 cited by
EIGER VII. The evolving relationship between galaxies and the intergalactic medium in the final stages of reionization
T0 review · 3 major / 4 minor · reviewed 2026-08-07 · deepseek-v4-flash
Pith's one-line read The correlation between galaxy density and intergalactic transparency reverses between z≈5.5 and z≈5.7, pointing to an inside-out finish of cosmic reionization.
desk verdict The sign reversal of the galaxy-IGM correlation is a genuinely new result, but the significance is weaker than the Spearman p-values suggest because of post-hoc binning and non-independent slices. read the letter →
The pith
A machine-rendered reading of the paper's core claim, the machinery that carries it, and where it could break.
The reading
What carries the argument
The central object is the mean transmission curve $\langle T(r)\rangle$, the average Lyα transmission in radial comoving-distance bins around detected galaxies, together with the volume-centric correlation between galaxy number density and transmission measured in 5–20 cMpc slices. The paper judges the significance of features in these curves against a null hypothesis built from mock galaxy catalogs derived from light-cone simulations with star-formation-rate-to-[Oiii] abundance matching, which preserve realistic galaxy clustering while being uncorrelated with the transmission data. The field-to-field weighted normalization, which removes the already-known large-scale correlation before comparing shapes, is the step that lets the small-scale absorption and intermediate-scale excess be interpreted as genuine local signals.
What would settle it
Recompute the same cross-correlations with mock catalogs from an independent hydrodynamical simulation that matches the measured two-point clustering of the 948 [Oiii] emitters; if the key p-values (0.86%, 4.69%, 3.62%) rise above 5%, the claimed redshift reversal would not be supported. Alternatively, an independent set of more than a dozen new quasar sightlines at the same depth that fails to reproduce the positive correlation at $z>5.7$ would settle the question.
Extended reading notes
Core claim
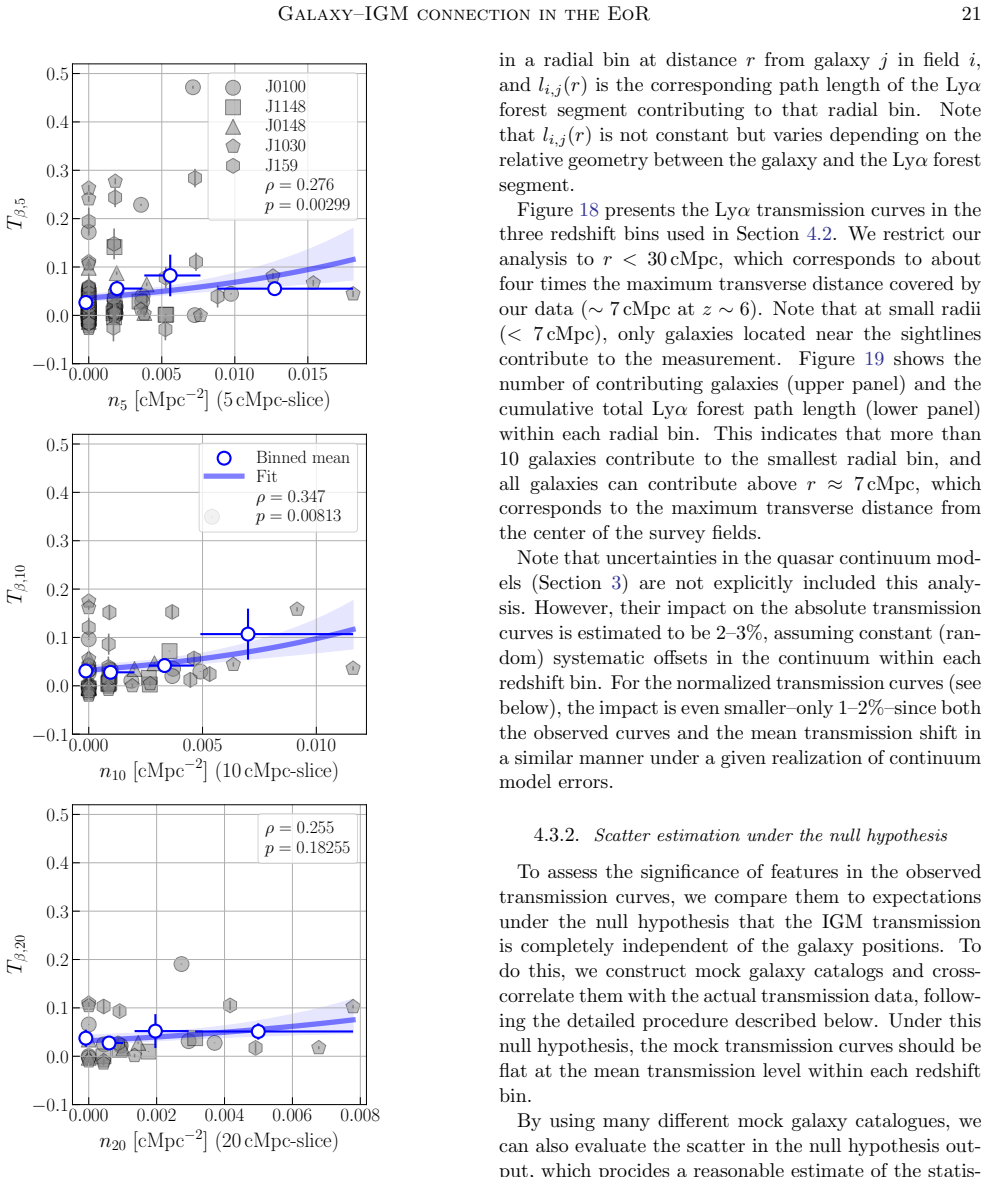
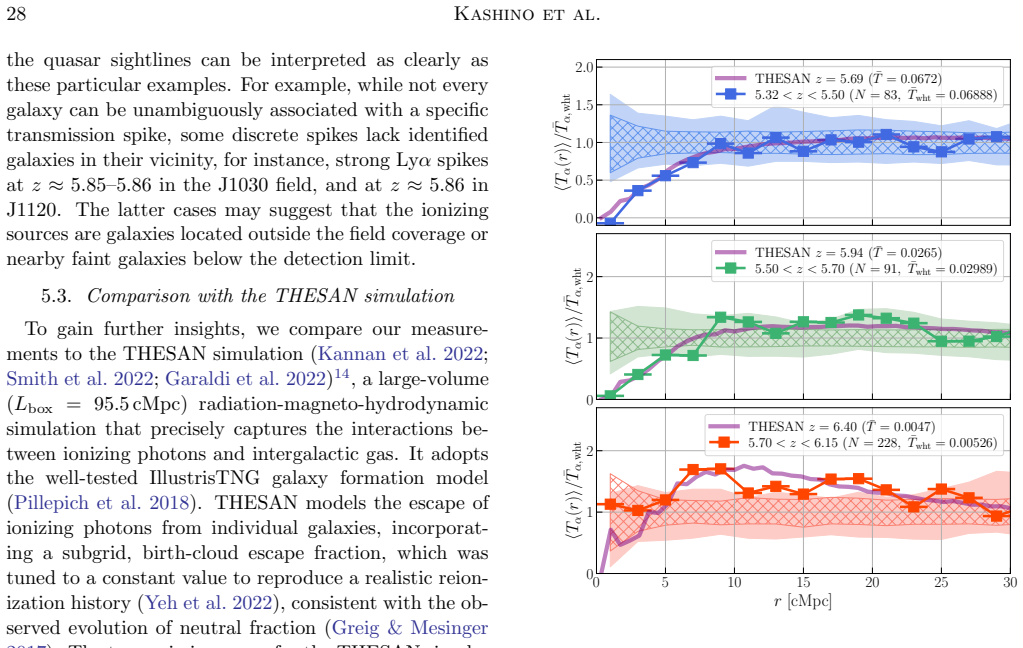
The central discovery is the redshift reversal of the galaxy–transmission correlation. In volume-centric measurements, Lyα transmission anti-correlates with galaxy number density at $5.32<z<5.50$ (Spearman $\rho\approx -0.4$ to $-0.6$), is weak or non-monotonic at $5.50<z<5.70$, and becomes positive at $5.70<z<6.15$ ($\rho\approx0.2$–$0.4$). The galacto-centric transmission curves show excess absorption within about 8 cMpc of galaxies at low redshift and excess transmission at roughly 5–20 cMpc at high redshift. The authors argue that these signals reflect two competing effects: overdense regions absorb more Lyα light, while clustered star-forming galaxies produce local ionizing radiation that raises transmission; the local radiation wins at high redshift and is gradually overtaken by the rising uniform background at low redshift.
Load-bearing premise
The significance of the reversal depends on mock galaxy catalogs whose clustering only approximately matches the real [Oiii] emitters; if those mocks under-cluster, the null-hypothesis scatter is underestimated and the quoted p-values are too optimistic.
Editorial extensions
If this is right
- At $z>5.7$, reionization proceeded inside-out: ionized regions formed around clustered star-forming galaxies and later expanded into lower-density voids.
- The transition between $z\approx5.5$ and $5.7$ marks the end of the patchy phase, operating on a timescale of roughly 50–100 Myr.
- Star-forming galaxies, not AGN, are the dominant ionizing sources during the final stages of reionization, since the positive correlation requires a source population that clusters like the [Oiii] emitters.
- Galaxy–transmission curves can now serve as quantitative constraints on reionization simulations, linking galaxy properties to ionizing photon escape.
Reading between the lines
- If the reversal is real, it should also be visible in other reionization observables, such as the 21-cm signal, where dense regions should be the first to become ionized.
- The apparent cancellation of the positive signal at $r<5$ cMpc at $z>5.7$ could be used to constrain the local mean free path of ionizing photons and the escape fraction of galaxies.
- A direct extension is to push the same analysis to $z>6.15$ with deeper spectroscopy; a strengthening positive correlation there would confirm the inside-out scenario earlier in reionization.
- The Lyβ curve, though statistically weaker, could with more path length become a cleaner probe of local ionization because it is less saturated than Lyα.
Editorial analysis
A structured set of objections, weighed in public.
Referee Report
Summary. This paper uses the complete EIGER dataset of 948 [OIII]-emitting galaxies around six quasar sightlines to measure the correlation between galaxy density and Ly-alpha/Ly-beta transmission during the tail end of reionization. The analysis is divided into three redshift bins (5.32<z<5.50, 5.50<z<5.70, 5.70<z<6.15). The authors report that galaxy density and Ly-alpha transmission are anti-correlated at z<5.50, uncorrelated in the intermediate bin, and positively correlated at 5.70<z<6.15. They also measure galacto-centric transmission curves and find excess absorption within ~8 cMpc at low redshift and excess transmission at ~6-20 cMpc at high redshift, with significance estimated from mock catalogs. The paper interprets these trends as evidence that local radiation from star-forming galaxies dominates at z>5.7, while a nearly uniform background dominates at z<5.5, supporting an inside-out reionization scenario.
Significance. If the claimed redshift reversal is statistically robust, this would be one of the most direct observational constraints on the inside-out reionization scenario and on the role of galaxies as ionizing sources. The paper has notable strengths: it uses the complete six-field EIGER sample with a sixfold increase over earlier work; it builds per-field completeness cubes and uses them in mock construction; it uses clustering-based mocks rather than random catalogs to estimate null scatters; it compares with the THESAN simulation; and it is transparent about acknowledged limitations, including the oversimplified SFR-to-[OIII] conversion and the influence of large-scale correlations on normalization. The significance of the paper, however, rests on the statistical validity of the redshift-reversal claim, and that claim currently depends on several statistical choices that are not fully robust.
major comments (3)
- [Sections 3 and 4.2] The redshift bin boundaries z=5.5 and z=5.7 are chosen after inspecting the same dataset: Section 3 states that the trend in the mean transmission 'motivates us to conduct' the three-regime analysis, and Section 4.2 repeats that the division is motivated by the observed evolution of the average transmission. The Spearman p-values in Figure 16 are therefore conditional on these data-driven boundaries and do not account for the look-elsewhere effect of choosing boundaries that make the reversal most visible. The paper should present a formal interaction test between redshift and the density-transmission slope (e.g., a regression with continuous redshift as an interacting covariate) or show that the reversal survives a pre-specified bin choice. Without such a test, the claimed reversal is not formally established.
- [Section 4.2, Figure 16] The Spearman tests treat individual slices along each sightline as independent, but adjacent slices share the same transmission spectrum and a clustered galaxy field, so the effective number of independent samples is far smaller than the number of slices (roughly the number of sightlines per bin, i.e., 5-6). This explains why p-values such as 0.00005 and 0.0022 are likely overconfident. A valid significance estimate for the slice-based correlation should either use the mock framework of Section 4.3.2 applied to the same statistic, preserving line-of-sight correlations, or use a block bootstrap resampled by sightline. This issue is load-bearing because the reversal claim in the abstract and Section 5.1 relies primarily on these within-bin p-values.
- [Sections 4.3.2 and 4.3.3, Figure 20] The reported mock-based p-values (0.86%, 4.69%, and 3.62% for the key small-scale absorption and intermediate-scale transmission features) depend on the accuracy of the mock clustering. The paper itself describes the SFR-to-[OIII] abundance-matching conversion as 'certainly an oversimplification' and states that the resulting sample reproduces clustering only 'approximately.' If the UniverseMachine mocks under-cluster on the scales that dominate the null scatter, the 16-84 percentile bands in Figure 18 and the p-values in Figure 20 would be underestimated, which could erase already moderate significances. The authors should validate the mock clustering against the observed [OIII]-emitter clustering (e.g., by comparing the two-point correlation or slice-to-slice variance) or demonstrate that the conclusions are robust to plausible variations in the clustering model.
minor comments (4)
- [Section 4.3.2] There is a typo: 'which procides a reasonable estimate' should read 'which provides a reasonable estimate.'
- [Section 4.3.4] The paragraph describing the Ly-beta transmission curve is duplicated verbatim; one copy should be removed.
- [Figure 20] The p-values in Figure 20 are one-sided and are evaluated separately for several radial bins and redshift ranges; the text should state explicitly whether any multiple-comparison correction was considered, or explain why the uncorrected values are sufficient for the conclusions.
- [Section 4.2] The text says the intermediate bin shows 'a peak-like trend' and that the 20-cMpc binning yields a positive correlation (rho=0.251, p=0.227) that is not significant; the wording in Section 5.1 describing the intermediate bin as 'non-monotonic peak-like' should be reconciled with the fact that this feature is not statistically significant by the paper's own measures.
Circularity Check
No significant circularity: the central galaxy-density/transmission correlation is measured from independent data sets and benchmarked against external mocks and simulations.
full rationale
The central signal is measured directly from two independent data sets: the EIGER [OIII]-emitter catalog (Section 2) and the Ly-alpha/Ly-beta transmission spectra (Section 3). The key volume-centric correlation (Figure 16, Section 4.2) uses only observed galaxy densities and observed transmissions in redshift slices; no parameter is fitted to the transmission data, and no model output is used to construct the correlation. The null-hypothesis scatter (Section 4.3.2) is generated from UniverseMachine lightcones with SFR-to-[OIII] abundance matching calibrated to the observed luminosity function; these mocks are by construction uncorrelated with the transmission field, so they provide an external benchmark for chance occurrence rather than an input to the measured signal. The field-to-field weighting in Equation 3 rescales the normalization of mock transmission curves using observed galaxy counts, but it does not impose the small-scale shape (excess absorption at r<8 cMpc or excess transmission at r~5-20 cMpc) that constitutes the central claim; the same weighting is applied to data and null, and the qualitative conclusions persist without it (Section 4.3.3). The THESAN comparison (Section 5.3) is an external simulation, and the qualitative inside-out interpretation is an inference, not a mathematical consequence of the definitions. The redshift bin boundaries (z=5.5, 5.7) are admittedly motivated by the observed mean transmission trend, which raises a multiple-testing caveat for the reported p-values; that is a statistical robustness concern, not a circularity, because the within-bin correlations are not definitionally determined by the choice of boundaries. No load-bearing argument reduces to a self-citation; Kashino et al. (2023) and Matthee et al. (2023) are cited for methodology and earlier single-sightline results, but the present six-sightline analysis is new and self-contained against external benchmarks.
Assumptions & free parameters
free parameters (1)
- Redshift bin boundaries =
z=5.50, 5.70
assumptions (3)
- domain assumption The neural network and power-law extrapolation accurately predict the quasar intrinsic continuum blueward of Ly-alpha, so the transmission measurements are unbiased.
- ad hoc to paper UniverseMachine mocks with SFR-to-[OIII] abundance matching reproduce the true clustering of [OIII]-emitters well enough to estimate the null-hypothesis scatter.
- domain assumption Foreground Ly-alpha absorption at z_fg~4.9 is corrected for using the cosmic mean transmission, ignoring spatial fluctuations.
Cite this review
Pith. "Pith review of EIGER VII. The evolving relationship between galaxies and the intergalactic medium in the final stages of reionization." pith.science (2026). https://pith.science/paper/RD6XDDIO
@misc{pith2026250603121,
  author       = {Pith},
  title        = {Pith review of: EIGER VII. The evolving relationship between galaxies and the intergalactic medium in the final stages of reionization},
  year         = {2026},
  howpublished = {\url{https://pith.science/paper/RD6XDDIO}},
  note         = {Machine review of arXiv:2506.03121}
}
abstract
We present a comprehensive analysis of the relationship between galaxies and the intergalactic medium (IGM) during the late stages of cosmic reionization, based on the complete JWST EIGER dataset. Using deep NIRCam $3.5\,\mathrm{\mu m}$ slitless spectroscopy, we construct a sample of 948 [\OIII]$\lambda5008$-emitting galaxies with $-21.4\lesssim M_\mathrm{UV}\lesssim -17.2$ spanning $5.33<z<6.97$ along six quasar sightlines. We correlate these galaxies with \Lya\ and \Lyb\ transmission measured from high-resolution quasar spectra across multiple redshift intervals. We find clear redshift evolution in the correlation between galaxy density and transmission: it is suppressed in overdense regions at $z<5.50$, while enhanced at $5.70<z<6.15$. The intermediate range exhibits a transitional behavior. Cross-correlation measurements further reveal excess absorption within $\sim 8$\,cMpc of galaxies at low redshifts, and enhanced transmission at intermediate scales ($\sim$5--20\,cMpc) at $z>5.70$. Statistical tests using mock catalogs with realistic galaxy clustering but no correlation with the transmission field confirm that the observed correlations are unlikely to arise by chance. The evolving signals can be explained by stronger absorption in overdense regions, combined with the competing influences of local radiation fields and the rising background radiation. While local radiation dominates ionization of the surrounding IGM at earlier times, the background becomes increasingly important, eventually surpassing the impact of nearby galaxies. These results support an inside-out progression of reionization, with ionized regions originating around clustered, star-forming galaxies and gradually extending into underdense regions.
Figures


Figures from the paper (22 more)







Forward citations
Cited by 1 Pith paper
-
An emulator for the ionizing photon mean free path in ultra-high resolution simulations: the implications of mean free path measurements for the reionization history
Photon mean-free-path observations at z≈5–6, interpreted with a neural-network emulator of high-resolution radiative-transfer simulations, favor a late, extended reionization with substantial neutral hydrogen persisti...
Reference graph
Works this paper leans on
-
[1]
, " * write output.state after.block = add.period write newline
ENTRY address archivePrefix author booktitle chapter doi edition editor eprint howpublished institution journal key month number organization pages publisher school series title misctitle type volume year version url label extra.label sort.label short.list INTEGERS output.state before.all mid.sentence after.sentence after.block FUNCTION init.state.consts ...
-
[2]
write newline
" write newline "" before.all 'output.state := FUNCTION format.url url empty "" new.block "" url * "" * if FUNCTION format.eprint eprint empty "" archivePrefix empty "" archivePrefix "arXiv" = new.block " " eprint * " " * new.block " " eprint * " " * if if if FUNCTION format.doi doi empty "" " " doi * " " * if FUNCTION format.pid doi empty eprint empty ur...
-
[3]
thebibliography [1] 20pt to REFERENCES 6pt =0pt \@twocolumntrue 12pt -12pt 10pt plus 3pt =0pt =0pt =1pt plus 1pt =0pt =0pt -12pt =13pt plus 1pt =20pt =13pt plus 1pt \@M =10000 =-1.0em =0pt =0pt 0pt =0pt =1.0em @enumiv\@empty 10000 10000 `\.\@m \@noitemerr \@latex@warning Empty `thebibliography' environment \@ifnextchar \@reference \@latexerr Missing key o...
arXiv 2017
-
[4]
Adelberger , K. L., Shapley , A. E., Steidel , C. C., et al. 2005, , 629, 636, 10.1086/431753
doi:10.1086/431753 2005
-
[5]
Adelberger , K. L., Steidel , C. C., Shapley , A. E., & Pettini , M. 2003, , 584, 45, 10.1086/345660
doi:10.1086/345660 2003
-
[6]
Asthana , S., Haehnelt , M. G., Kulkarni , G., et al. 2024, arXiv e-prints, arXiv:2409.15453, 10.48550/arXiv.2409.15453
-
[7]
Astropy Collaboration , Robitaille , T. P., Tollerud , E. J., et al. 2013, , 558, A33, 10.1051/0004-6361/201322068
-
[8]
2001, , 349, 125, 10.1016/S0370-1573(01)00019-9
Barkana , R., & Loeb , A. 2001, , 349, 125, 10.1016/S0370-1573(01)00019-9
Show all 104 references
-
[9]
D., Bolton , J
Becker , G. D., Bolton , J. S., & Lidz , A. 2015 a , , 32, e045, 10.1017/pasa.2015.45
2015 doi
-
[10]
D., Bolton , J
Becker , G. D., Bolton , J. S., Madau , P., et al. 2015 b , , 447, 3402, 10.1093/mnras/stu2646
2015 doi
-
[11]
D., Davies , F
Becker , G. D., Davies , F. B., Furlanetto , S. R., et al. 2018, , 863, 92, 10.3847/1538-4357/aacc73
2018 doi
-
[12]
H., Hearin , A
Behroozi , P., Wechsler , R. H., Hearin , A. P., & Conroy , C. 2019, , 488, 3143, 10.1093/mnras/stz1182
2019 doi
-
[13]
2024, , 531, 3406, 10.1093/mnras/stae1125
Bhagwat , A., Costa , T., Ciardi , B., Pakmor , R., & Garaldi , E. 2024, , 531, 3406, 10.1093/mnras/stae1125
2024 doi
-
[14]
A., Matthee , J., et al
Bordoloi , R., Simcoe , R. A., Matthee , J., et al. 2024, , 963, 28, 10.3847/1538-4357/ad1b63
2024 doi
-
[15]
2023, , 525, 5932, 10.1093/mnras/stad2523
Borrow , J., Kannan , R., Garaldi , E., et al. 2023, , 525, 5932, 10.1093/mnras/stad2523
2023 doi
-
[16]
Bosman , S. E. I., Fan , X., Jiang , L., et al. 2018, , 479, 1055, 10.1093/mnras/sty1344
2018 doi
-
[17]
Bosman , S. E. I., Davies , F. B., Becker , G. D., et al. 2022, , 514, 55, 10.1093/mnras/stac104610.48550/arXiv.2108.03699
2022
-
[18]
J., Illingworth , G
Bouwens , R. J., Illingworth , G. D., Oesch , P. A., et al. 2015, , 811, 140, 10.1088/0004-637X/811/2/140
2015 doi
-
[19]
2018, , 479, 332, 10.1093/mnras/sty1490
Boylan-Kolchin , M. 2018, , 479, 332, 10.1093/mnras/sty1490
2018 doi
-
[20]
G., Aubert , D., & Puchwein , E
Chardin , J., Haehnelt , M. G., Aubert , D., & Puchwein , E. 2015, , 453, 2943, 10.1093/mnras/stv1786
2015 doi
-
[21]
Chardin , J., Puchwein , E., & Haehnelt , M. G. 2017, , 465, 3429, 10.1093/mnras/stw2943
2017 doi
-
[22]
R., Haehnelt , M
Choudhury , T. R., Haehnelt , M. G., & Regan , J. 2009, , 394, 960, 10.1111/j.1365-2966.2008.14383.x
2009
-
[23]
M., Becker , G
Christenson , H. M., Becker , G. D., Furlanetto , S. R., et al. 2021, , 923, 87, 10.3847/1538-4357/ac2a34
2021 doi
-
[24]
M., Becker , G
Christenson , H. M., Becker , G. D., D'Aloisio , A., et al. 2023, , 955, 138, 10.3847/1538-4357/acf450
2023 doi
-
[25]
S., Keating , L
Conaboy , L., Bolton , J. S., Keating , L. C., et al. 2025, , 539, 2790, 10.1093/mnras/staf648
2025 doi
-
[26]
M., Fontanot , F., Vanzella , E., & Monaco , P
Cristiani , S., Serrano , L. M., Fontanot , F., Vanzella , E., & Monaco , P. 2016, , 462, 2478, 10.1093/mnras/stw1810
2016 doi
-
[27]
R., McQuinn , M., Trac , H., & Shapiro , P
D'Aloisio , A., Upton Sanderbeck , P. R., McQuinn , M., Trac , H., & Shapiro , P. R. 2017, , 468, 4691, 10.1093/mnras/stx711
2017 doi
-
[28]
2018, , 780, 1, 10.1016/j.physrep.2018.10.002
Dayal , P., & Ferrara , A. 2018, , 780, 1, 10.1016/j.physrep.2018.10.002
2018 doi
- [29]
-
[30]
Duncan , K., & Conselice , C. J. 2015, , 451, 2030, 10.1093/mnras/stv1049
2015 doi
-
[31]
B., & Hennawi , J
Eilers , A.-C., Davies , F. B., & Hennawi , J. F. 2018, , 864, 53, 10.3847/1538-4357/aad4fd
2018 doi
-
[32]
A., Yue , M., et al
Eilers , A.-C., Simcoe , R. A., Yue , M., et al. 2023, , 950, 68, 10.3847/1538-4357/acd776
2023 doi
-
[33]
2024, , 974, 275, 10.3847/1538-4357/ad778b
Eilers , A.-C., Mackenzie , R., Pizzati , E., et al. 2024, , 974, 275, 10.3847/1538-4357/ad778b
2024 doi
-
[34]
L., & Keating , B
Fan , X., Carilli , C. L., & Keating , B. 2006 a , , 44, 415, 10.1146/annurev.astro.44.051905.092514
2006 arXiv
-
[35]
A., Becker , R
Fan , X., Strauss , M. A., Becker , R. H., et al. 2006 b , , 132, 117, 10.1086/504836
2006 doi
-
[36]
2009, , 703, 1416, 10.1088/0004-637X/703/2/1416
Faucher-Gigu \`e re , C.-A., Lidz , A., Zaldarriaga , M., & Hernquist , L. 2009, , 703, 1416, 10.1088/0004-637X/703/2/1416
2009 doi
-
[37]
L., D'Aloisio , A., Paardekooper , J.-P., et al
Finkelstein , S. L., D'Aloisio , A., Paardekooper , J.-P., et al. 2019, , 879, 36, 10.3847/1538-4357/ab1ea8
2019 doi
-
[38]
R., Zaldarriaga , M., & Hernquist , L
Furlanetto , S. R., Zaldarriaga , M., & Hernquist , L. 2004, , 613, 1, 10.1086/423025
2004 doi
-
[39]
G., Davies , F
Gaikwad , P., Haehnelt , M. G., Davies , F. B., et al. 2023, , 525, 4093, 10.1093/mnras/stad2566
2023 doi
-
[40]
D., & Christenson , H
Gangolli , N., D'Aloisio , A., Cain , C., Becker , G. D., & Christenson , H. 2025, , 2025, 069, 10.1088/1475-7516/2025/03/069
2025 doi
-
[41]
2024 a , arXiv e-prints, arXiv:2410.02850, 10.48550/arXiv.2410.02850
Garaldi , E., & Bellscheidt , V. 2024 a , arXiv e-prints, arXiv:2410.02850, 10.48550/arXiv.2410.02850
2024 doi
-
[42]
2024 b , arXiv e-prints, arXiv:2410.02853, 10.48550/arXiv.2410.02853
---. 2024 b , arXiv e-prints, arXiv:2410.02853, 10.48550/arXiv.2410.02853
2024 doi
-
[43]
2022, , 512, 4909, 10.1093/mnras/stac257
Garaldi , E., Kannan , R., Smith , A., et al. 2022, , 512, 4909, 10.1093/mnras/stac257
2022 doi
-
[44]
Gnedin , N. Y. 2000, , 535, 530, 10.1086/308876
2000 doi
-
[45]
Y., & Madau , P
Gnedin , N. Y., & Madau , P. 2022, Living Reviews in Computational Astrophysics, 8, 3, 10.1007/s41115-022-00015-5
2022 doi
-
[46]
2018, , 613, A44, 10.1051/0004-6361/201732385
Grazian , A., Giallongo , E., Boutsia , K., et al. 2018, , 613, A44, 10.1051/0004-6361/201732385
2018 doi
-
[47]
2017, , 465, 4838, 10.1093/mnras/stw3026
Greig , B., & Mesinger , A. 2017, , 465, 4838, 10.1093/mnras/stw3026
2017 doi
-
[48]
2012, , 746, 125, 10.1088/0004-637X/746/2/125
Haardt , F., & Madau , P. 2012, , 746, 125, 10.1088/0004-637X/746/2/125
2012 doi
-
[49]
R., Millman, K
Harris, C. R., Millman, K. J., van der Walt, S. J., et al. 2020, Nature, 585, 357, 10.1038/s41586-020-2649-2
2020 doi
-
[50]
Hunter, J. D. 2007, Computing in Science & Engineering, 9, 90, 10.1109/MCSE.2007.55
2007 doi
-
[51]
2021, , 503, 3698, 10.1093/mnras/stab602
Hutter , A., Dayal , P., Yepes , G., et al. 2021, , 503, 3698, 10.1093/mnras/stab602
2021 doi
-
[52]
A., Seiler , J., et al
Hutter , A., Watkinson , C. A., Seiler , J., et al. 2020, , 492, 653, 10.1093/mnras/stz3139
2020 doi
-
[54]
2022, , 515, 5914, 10.1093/mnras/stac1972
Ishimoto , R., Kashikawa , N., Kashino , D., et al. 2022, , 515, 5914, 10.1093/mnras/stac1972
2022 doi
-
[55]
2025, arXiv e-prints, arXiv:2502.03683, 10.48550/arXiv.2502.03683
Jiang , D., Jiang , L., Sun , S., Liu , W., & Fu , S. 2025, arXiv e-prints, arXiv:2502.03683, 10.48550/arXiv.2502.03683
2025 doi
-
[56]
2024, , 976, 93, 10.3847/1538-4357/ad82de
Jin , X., Yang , J., Fan , X., et al. 2024, , 976, 93, 10.3847/1538-4357/ad82de
2024 doi
-
[57]
F., Ono , Y., et al
Kakiichi , K., Hennawi , J. F., Ono , Y., et al. 2023, , 523, 1772, 10.1093/mnras/stad1376
2023 doi
-
[58]
S., Laporte , N., et al
Kakiichi , K., Ellis , R. S., Laporte , N., et al. 2018, , 479, 43, 10.1093/mnras/sty1318
2018 doi
- [59]
-
[60]
2022, , 511, 4005, 10.1093/mnras/stab3710
Kannan , R., Garaldi , E., Smith , A., et al. 2022, , 511, 4005, 10.1093/mnras/stab3710
2022 doi
-
[61]
J., Matthee , J., et al
Kashino , D., Lilly , S. J., Matthee , J., et al. 2023, , 950, 66, 10.3847/1538-4357/acc588
2023 doi
-
[62]
J., Shibuya , T., Ouchi , M., & Kashikawa , N
Kashino , D., Lilly , S. J., Shibuya , T., Ouchi , M., & Kashikawa , N. 2020, , 888, 6, 10.3847/1538-4357/ab5a7d
2020 doi
-
[63]
2020, , 494, 2200, 10.1093/mnras/staa639
Katz , H., Ramsoy , M., Rosdahl , J., et al. 2020, , 494, 2200, 10.1093/mnras/staa639
2020 doi
-
[64]
C., Weinberger , L
Keating , L. C., Weinberger , L. H., Kulkarni , G., et al. 2020, , 491, 1736, 10.1093/mnras/stz3083
2020 doi
-
[65]
2021, , 502, 3510, 10.1093/mnras/stab177
Liu , B., & Bordoloi , R. 2021, , 502, 3510, 10.1093/mnras/stab177
2021 doi
-
[66]
2021, , 504, 4062, 10.1093/mnras/stab1132
Ma , X., Quataert , E., Wetzel , A., Faucher-Gigu \`e re , C.-A., & Boylan-Kolchin , M. 2021, , 504, 4062, 10.1093/mnras/stab1132
2021 doi
-
[67]
Madau , P., Haardt , F., & Rees , M. J. 1999, , 514, 648, 10.1086/306975
1999 doi
-
[68]
J., Volonteri , M., Haardt , F., & Oh , S
Madau , P., Rees , M. J., Volonteri , M., Haardt , F., & Oh , S. P. 2004, , 604, 484, 10.1086/381935
2004 doi
-
[69]
2006, , 369, 1719, 10.1111/j.1365-2966.2006.10408.x
Mapelli , M., Ferrara , A., & Pierpaoli , E. 2006, , 369, 1719, 10.1111/j.1365-2966.2006.10408.x
2006
-
[70]
A., et al
Matthee , J., Mackenzie , R., Simcoe , R. A., et al. 2023, , 950, 67, 10.3847/1538-4357/acc846
2023 doi
-
[71]
2024 a , , 529, 2794, 10.1093/mnras/stae673
Matthee , J., Golling , C., Mackenzie , R., et al. 2024 a , , 529, 2794, 10.1093/mnras/stae673
2024 doi
-
[72]
P., Brammer , G., et al
Matthee , J., Naidu , R. P., Brammer , G., et al. 2024 b , , 963, 129, 10.3847/1538-4357/ad2345
2024 doi
-
[73]
S., Steidel , C
McLean , I. S., Steidel , C. C., Epps , H. W., et al. 2012, in Society of Photo-Optical Instrumentation Engineers (SPIE) Conference Series, Vol. 8446, Ground-based and Airborne Instrumentation for Astronomy IV, ed. I. S. McLean , S. K. Ramsay , & H. Takami , 84460J, 10.1117/12.924794
2012 doi
-
[74]
2007, , 377, 1043, 10.1111/j.1365-2966.2007.11489.x
McQuinn , M., Lidz , A., Zahn , O., et al. 2007, , 377, 1043, 10.1111/j.1365-2966.2007.11489.x
2007
-
[75]
A., Kakiichi , K., Bosman , S
Meyer , R. A., Kakiichi , K., Bosman , S. E. I., et al. 2020, , 494, 1560, 10.1093/mnras/staa746
2020 doi
-
[76]
F., Dijkstra , M., Laurent , P., Loeb , A., & Pritchard , J
Mirabel , I. F., Dijkstra , M., Laurent , P., Loeb , A., & Pritchard , J. R. 2011, , 528, A149, 10.1051/0004-6361/201016357
2011 doi
-
[77]
2021, , 909, 117, 10.3847/1538-4357/abd2af
Momose , R., Shimasaku , K., Kashikawa , N., et al. 2021, , 909, 117, 10.3847/1538-4357/abd2af
2021 doi
-
[78]
2017, , 835, 281, 10.3847/1538-4357/835/2/281
Mukae , S., Ouchi , M., Kakiichi , K., et al. 2017, , 835, 281, 10.3847/1538-4357/835/2/281
2017 doi
-
[79]
P., Tacchella , S., Mason , C
Naidu , R. P., Tacchella , S., Mason , C. A., et al. 2020, , 892, 109, 10.3847/1538-4357/ab7cc9
2020 doi
-
[80]
G., et al
Ocvirk , P., Aubert , D., Sorce , J. G., et al. 2020, , 496, 4087, 10.1093/mnras/staa1266
2020 doi
- [81]
-
[82]
2015, , 451, 2544, 10.1093/mnras/stv1114
Paardekooper , J.-P., Khochfar , S., & Dalla Vecchia , C. 2015, , 451, 2544, 10.1093/mnras/stv1114
2015 doi
-
[83]
S., & McLure , R
Parsa , S., Dunlop , J. S., & McLure , R. J. 2018, , 474, 2904, 10.1093/mnras/stx2887
2018 doi
-
[84]
2018, , 473, 4077, 10.1093/mnras/stx2656
Pillepich , A., Springel , V., Nelson , D., et al. 2018, , 473, 4077, 10.1093/mnras/stx2656
2018 doi
-
[85]
2020, , 641, A6, 10.1051/0004-6361/201833910
Planck Collaboration , Aghanim , N., Akrami , Y., et al. 2020, , 641, A6, 10.1051/0004-6361/201833910
2020 doi
-
[86]
A., Combet , C., & Wilkinson , M
Power , C., Wynn , G. A., Combet , C., & Wilkinson , M. I. 2009, , 395, 1146, 10.1111/j.1365-2966.2009.14628.x
2009
-
[87]
X., Hennawi , J., Cooke , R., et al
Prochaska , J. X., Hennawi , J., Cooke , R., et al. 2019, PypeIt: Python spectroscopic data reduction pipeline , Astrophysics Source Code Library, record ascl:1911.004. 1911.004
2019
-
[88]
2025, , 42, e049, 10.1017/pasa.2025.35
Qin , Y., Mesinger , A., Prelogovi \'c , D., et al. 2025, , 42, e049, 10.1017/pasa.2025.35
2025 doi
-
[89]
2002, , 336, L33, 10.1046/j.1365-8711.2002.05990.x
Ricotti , M. 2002, , 336, L33, 10.1046/j.1365-8711.2002.05990.x
2002
-
[90]
E., Ellis , R
Robertson , B. E., Ellis , R. S., Furlanetto , S. R., & Dunlop , J. S. 2015, , 802, L19, 10.1088/2041-8205/802/2/L19
2015 doi
-
[91]
2018, , 479, 994, 10.1093/mnras/sty1655
Rosdahl , J., Katz , H., Blaizot , J., et al. 2018, , 479, 994, 10.1093/mnras/sty1655
2018 doi
- [92]
-
[93]
I., Bolte , M., Epps , H
Sheinis , A. I., Bolte , M., Epps , H. W., et al. 2002, , 114, 851, 10.1086/341706
2002 doi
-
[94]
A., Burgasser , A
Simcoe , R. A., Burgasser , A. J., Schechter , P. L., et al. 2013, , 125, 270, 10.1086/670241
2013 doi
-
[95]
2024, , 527, 6139, 10.1093/mnras/stad3605
Simmonds , C., Tacchella , S., Hainline , K., et al. 2024, , 527, 6139, 10.1093/mnras/stad3605
2024 doi
-
[96]
2022, , 512, 3243, 10.1093/mnras/stac713
Smith , A., Kannan , R., Garaldi , E., et al. 2022, , 512, 3243, 10.1093/mnras/stac713
2022 doi
- [97]
-
[98]
2024, , 969, 162, 10.3847/1538-4357/ad4888
D urov c \' kov \'a , D., Eilers , A.-C., Chen , H., et al. 2024, , 969, 162, 10.3847/1538-4357/ad4888
2024 doi
-
[99]
2011, , 536, A105, 10.1051/0004-6361/201117752
Vernet , J., Dekker , H., D'Odorico , S., et al. 2011, , 536, A105, 10.1051/0004-6361/201117752
2011 doi
-
[100]
E., et al
Virtanen, P., Gommers, R., Oliphant, T. E., et al. 2020, Nature Methods, 17, 261, 10.1038/s41592-019-0686-2
2020 doi
-
[101]
F., et al
Wang , F., Yang , J., Hennawi , J. F., et al. 2023, , 951, L4, 10.3847/2041-8213/accd6f
2023 doi
-
[102]
H., Abel , T., Turk , M
Wise , J. H., Abel , T., Turk , M. J., Norman , M. L., & Smith , B. D. 2012, , 427, 311, 10.1111/j.1365-2966.2012.21809.x
2012
-
[103]
2014, , 440, 776, 10.1093/mnras/stu299
Yajima , H., Li , Y., Zhu , Q., et al. 2014, , 440, 776, 10.1093/mnras/stu299
2014 doi
-
[104]
2022, in American Astronomical Society Meeting Abstracts, Vol
Yeh , Y.-C., Smith , A., Garaldi , E., et al. 2022, in American Astronomical Society Meeting Abstracts, Vol. 240, American Astronomical Society Meeting \#240, 126.04
2022
-
[105]
A., et al
Yue , M., Eilers , A.-C., Simcoe , R. A., et al. 2024, , 966, 176, 10.3847/1538-4357/ad3914
2024 doi
Reviewed August 7, 2026 · model on record in the stance chip above.
Discussion (0). Sign in to comment.