REVIEW 3 major objections 5 minor 80 references
Conventional and Fuzzy Data Envelopment Analysis with deaR
T0 review · 3 major / 5 minor · reviewed 2026-08-07 · deepseek-v4-flash
Pith's one-line read This paper describes deaR, an R package for data envelopment analysis that implements a broad menu of conventional and fuzzy models and is claimed to be the only package offering the Kao-Liu, Guo-Tanaka, and possibilistic fuzzy DEA models.
desk verdict A thorough, honest software description that mostly delivers on its replication claims; one unresolved FDH discrepancy and an overstrong exclusivity claim need fixing, but the package is a real contribution. read the letter →
The pith
A machine-rendered reading of the paper's core claim, the machinery that carries it, and where it could break.
The reading
What carries the argument
The machinery is the S3 class pair deadata and deadata_fuzzy, which hold crisp or trapezoidal-fuzzy input and output matrices, together with the model functions that convert each DEA formulation into a linear program solved by an external LP solver. The result object of class dea stores all extracted quantities. Kao-Liu models work as metamodels: at each $\alpha$-cut they run a chosen crisp model under worst-case and best-case scenarios for each DMU, producing fuzzy efficiency scores. Guo-Tanaka and possibilistic models work at $h$-levels, respectively yielding triangular fuzzy scores and crisp scores per level, and each fuzzy family has its own visualization.
What would settle it
Run the input-oriented free disposal hull model on the bundled Supply_Chain dataset: deaR reports 0.98156 for DMU sc16 while the cited source reports 1, and a direct re-solve of that linear program would show which side is wrong; extending the same independent re-solve to all bundled datasets would test the paper's reproduction claim.
Extended reading notes
Core claim
The paper's central claim is that deaR provides a unified implementation of the DEA model landscape, covering both conventional and fuzzy models with a consistent interface and with special support for non-controllable, non-discretionary, and undesirable variables. It further claims that the fuzzy models Kao-Liu, Guo-Tanaka, and possibilistic are unique to deaR among current packages. The package is designed so that each model is a function that takes a data object, builds the corresponding linear program, solves it, and returns a result object from which efficiencies, lambdas, slacks, targets, and multipliers can be extracted. The paper presents numerical examples from classical datasets and treats agreement with published results as evidence that the implementations are correct, while also introducing graphical representations of efficiency frontiers, cross-efficiency matrices, and fuzzy efficiency scores.
Load-bearing premise
The package's correctness is judged by agreement with published results, so the central claim stands only if the source datasets are faithful and the published numbers they are benchmarked against are themselves correct.
Editorial extensions
If this is right
- A non-expert R user can apply CCR, BCC, directional, SBM, additive, FDH, multiplier, cost/revenue/profit, super-efficiency, cross-efficiency, Malmquist, bootstrap, and metafrontier analyses from one package without switching software.
- The Kao-Liu, Guo-Tanaka, and possibilistic fuzzy DEA models become available in a single reference implementation, filling a gap that the paper says no other package covers.
- Bundled datasets allow users to reproduce published numerical results, making the package a practical check on the correctness of its implementations.
- Special features such as non-controllable, non-discretionary, and undesirable inputs and outputs are handled within the same workflow, so studies with irregular data do not require separate software.
- The package's graphical outputs, including reference graphs and cross-efficiency heat maps, give users a direct visual route to interpreting efficiency scores and frontier relationships.
Reading between the lines
- If the reproduction claims hold, the bundled datasets effectively become a public test suite: any future DEA implementation, in any language, could use the same inputs and published outputs to check numerical correctness.
- The paper itself shows a discrepancy for DMU sc16 in the Supply_Chain dataset, where deaR returns 0.98156 and the cited source reports 1, so users should not assume every bundled dataset is error-free; a maintainer-added list of known discrepancies would make the package more transparent.
- Because Kao-Liu is a metamodel that wraps any chosen conventional model, the package implicitly offers a general way to fuzzify all its crisp models, even though the paper demonstrates only a subset of possible combinations.
- The uniform three-step workflow across crisp and fuzzy models suggests that deaR could serve as a teaching platform for fuzzy DEA, letting students compare fuzzy results against the corresponding crisp baseline with minimal code changes.
Editorial analysis
A structured set of objections, weighed in public.
Referee Report
Summary. The paper describes deaR, an R package on CRAN for conventional and fuzzy data envelopment analysis. It documents the data-reading workflow, radial and non-radial models, special variable types, super-efficiency, cross-efficiency, fuzzy models (Kao-Liu, Guo-Tanaka, and possibilistic), Malmquist indices, bootstrap procedures, and metafrontier analysis. The authors validate the implementation by reproducing published numerical results on roughly twenty bundled datasets and provide worked R examples with concrete output and plots.
Significance. If the implementation is correct, deaR is a practically valuable one-stop package for DEA in R, and its coverage of fuzzy models is a genuine differentiator. The paper's strengths are the breadth of models, the bundled datasets, and the many worked examples with concrete numerical output that match published sources. However, the central validation-by-replication strategy is weakened by an unresolved, explicitly reported discrepancy in the FDH example, and two further points in the SBM and Malmquist sections need attention before the paper's claims are fully supported.
major comments (3)
- [3.2] The FDH example on the Supply_Chain dataset reports an efficiency score of 0.98156 for DMU sc16, while Mamizadeh-Chatghayeh and Sanei (2013) report 1, and the text says only that this is 'contrary to the results shown' without saying which side is wrong. This is a concrete counterexample to the replication-based validation promised in Section 2.2, and the comparison is not fully specified because the paper does not state whether Supply_Chain is exactly the dataset used in the source or how the source computed its score. The authors should resolve the discrepancy by checking the source data and definition or by correcting the implementation, and they should either revise the reproduction claim or document the mismatch explicitly as a known limitation.
- [3.6] For SBM models with zero output data, the paper states that Tone's Case 2 is applied 'but taking 1/100 instead of 1/10.' This is an unexplained deviation from the cited Tone (2001) algorithm, and it changes the numerical scores whenever a zero output is present. The authors should justify the constant or re-run the benchmark against Tone's exact formulation and report the impact of the change.
- [8] The text around Eq. (41) attributes the index M^t_o = D^t(x^{t+1}, y^{t+1}) / D^t(x^t, y^t) to Ray and Desli (1997); that paper's VRS Malmquist index is usually written as a geometric mean of distance-function ratios, not as a single-period ratio. The subsequent 'rd' decomposition should be checked against the source. Either the formula needs correction or the description should clarify that the package implements the generalized Grifell-Tatjé and Lovell (1999) index under the label 'rd'.
minor comments (5)
- [2.2] The function name appears as 'make deadata' in the prose in several places; it should be 'make_deadata' for consistency with the code and with the rest of the paper.
- [2.3] The text refers to 'Table 2.3' for the list of model functions, while the printed caption is 'Table 1'; similarly, Section 8 refers to 'Table 8' when the caption says 'Table 4'. These cross-references should be corrected.
- [3.7] The profit-efficiency score is written as 'pyo - cxo / py* - cx*' without parentheses; the intended ratio should be typeset as (py_o - c x_o)/(p y^* - c x^*) so that the reader is not left to guess the order of operations.
- [3.1] The statement that epsilon = 1e-6 is 'too high' could be misleading; the issue is that a finite epsilon imposes additional constraints that may be infeasible for a particular dataset. The sentence should state that the threshold depends on the data scale.
- [Abstract] The claim that deaR is 'the only package to date' incorporating Kao-Liu, Guo-Tanaka, and possibilistic fuzzy models is an absolute statement that is not substantiated by a systematic comparison; a date-stamped survey or a softer formulation would make it verifiable.
Circularity Check
No circular derivation; the paper documents an R package and validates it against external benchmarks.
full rationale
The paper contains no claimed derivation from first principles. It presents standard DEA models with equations taken from the literature (Charnes-Cooper-Rhodes, Banker-Charnes-Cooper, Tone, Kao-Liu, Guo-Tanaka, León et al., etc.) and describes how deaR wraps lpSolve. Every reported numerical example is computed from a fixed linear program and checked against results published by other authors, such as Tone (2001), Tone (2002), Wu et al. (2011), Guo and Tanaka (2001), León et al. (2003), and Wang and Lan (2011). No parameter is fitted to the benchmark datasets and then used to predict the same benchmark; the models are deterministic and are not defined in terms of their outputs. The only self-citation, Coll-Serrano et al. (2022), is the CRAN package reference and is descriptive rather than load-bearing for any numerical claim. The FDH discrepancy in Section 3.2 (sc16 = 0.98156 versus 1 in Mamizadeh-Chatghayeh and Sanei (2013)) is an unresolved correctness or validation issue, but not a circularity: the paper explicitly reports the mismatch without redefining the model or fitting the contested result. Because no specific reduction of a claimed result to its own inputs can be exhibited, the circularity score is minimal.
Assumptions & free parameters
free parameters (4)
- non-Archimedean epsilon in multiplier models =
default 0; example uses 1e-6 and yields NA for 2 of 15 DMUs
- bootstrap bandwidth h =
0.014 default; alternatives h1-h4 computed from data
- SBM zero-output scaling constant =
1/100 (Tone's Case 2 uses 1/10)
- translation vectors for undesirable variables =
max + 1 per variable by default; user can override (e.g., 1500 in the Hua-Bian example)
assumptions (4)
- domain assumption The production possibility sets and LP formulations from the cited literature correctly characterize efficiency in all models implemented.
- domain assumption lpSolve returns optimal solutions for every generated linear or mixed-integer problem.
- domain assumption The bundled datasets faithfully reproduce the data used in the cited studies.
- domain assumption Fuzzy efficiency is what the three cited models define it to be.
Cite this review
Pith. "Pith review of Conventional and Fuzzy Data Envelopment Analysis with deaR." pith.science (2026). https://pith.science/paper/NTMVDQI2
@misc{pith2026250603766,
  author       = {Pith},
  title        = {Pith review of: Conventional and Fuzzy Data Envelopment Analysis with deaR},
  year         = {2026},
  howpublished = {\url{https://pith.science/paper/NTMVDQI2}},
  note         = {Machine review of arXiv:2506.03766}
}
read the original abstract
deaR is a recently developed R package for data envelopment analysis (DEA) that implements a large number of conventional and fuzzy models, along with super-efficiency models, cross-efficiency analysis, Malmquist index, bootstrapping, and metafrontier analysis. It should be noted that deaR is the only package to date that incorporates Kao-Liu, Guo-Tanaka and possibilistic fuzzy models. The versatility of the package allows the user to work with different returns to scale and orientations, as well as to consider special features, namely non-controllable, non-discretionary or undesirable variables. Moreover, it includes novel graphical representations that can help the user to display the results. This paper is a comprehensive description of deaR, reviewing all implemented models and giving examples of use.
Figures

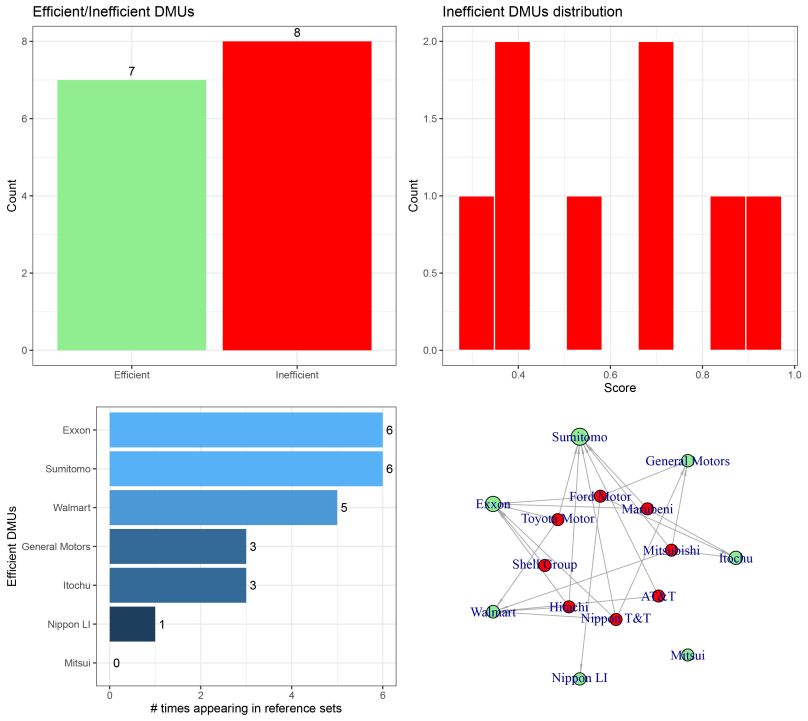

Figures from the paper (6 more)


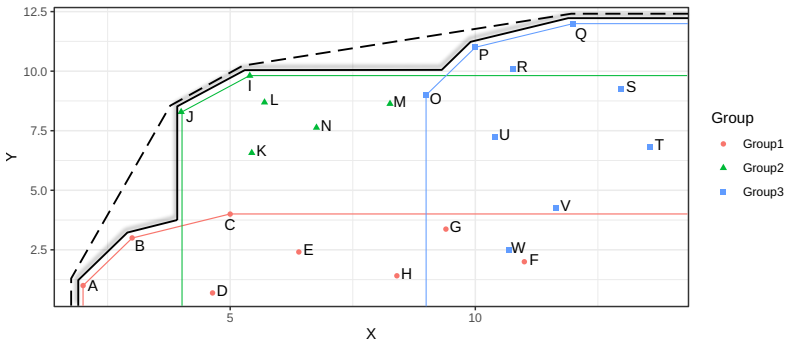
Reference graph
Works this paper leans on
-
[1]
I. C. Alvarez, J. Barbero, and J. L. Zofío. A data envelopment analysis toolbox for MATLAB . Journal of Statistical Software, 95 0 (3): 0 1–49, 2020. doi:10.18637/jss.v095.i03
-
[2]
P. Andersen and N. C. Petersen. A procedure for ranking efficient units in data envelopment analysis. Management Science, 39 0 (10): 0 1261--1264, 1993. doi:10.1287/mnsc.39.10.1261
-
[3]
J. Aparicio, J. L. Ruiz, and I. Sirvent. Closest targets and minimum distance to the pareto-efficient frontier in DEA . Journal of Productivity Analysis, 28 0 (3): 0 209--218, 2007. doi:10.1007/s11123-007-0039-5
-
[4]
R. D. Banker, A. Charnes, and W. W. Cooper. Some models for estimating technical and scale inefficiencies in data envelopment analysis. Management Science, 30 0 (9): 0 1078--1092, 1984. doi:10.1287/mnsc.30.9.1078
-
[5]
G. E. Battese and D. S. P. Rao. Technology gap, efficiency, and a stochastic metafrontier function. International Journal of Business and Economics, 1 0 (2): 0 87--93, 2002. ISSN 1607-0704
work page 2002
-
[6]
G. E. Battese, D. S. P. Rao, and C. J. O'Donnell. A metafrontier production function for estimation of technical efficiencies and technology gaps for firms operating under different technologies. Journal of Productivity Analysis, 21 0 (1): 0 91--103, 2004. doi:10.1023/B:PROD.0000012454.06094.29
-
[7]
M. Berkelaar and others . lpSolve: Interface to 'Lp\_solve' v. 5.5 to Solve Linear/Integer Programs , 2020. URL https://CRAN.R-project.org/package=lpSolve. R package version 5.6.15
work page 2020
-
[8]
P. Bogetoft and L. Otto. Benchmarking with DEA , SFA , and R , volume 157 of International Series in Operations Research & Management Science . Springer New York, NY, 2011. ISBN 978-1-4419-7960-5. doi:10.1007/978-1-4419-7961-2
Show all 80 references
-
[9]
Bogetoft and L
P. Bogetoft and L. Otto. Benchmarking with DEA and SFA , 2022. URL https://CRAN.R-project.org/package=Benchmarking. R package version 0.30
2022
-
[10]
W. Briec. A graph-type extension of Farrell technical efficiency measure. Journal of Productivity Analysis, 8 0 (1): 0 95--110, 1997. doi:10.1023/A:1007728515733
1997 doi
-
[11]
R. G. Chambers, Y. Chung, and R. Färe. Benefit and distance functions. Journal of Economic Theory, 70 0 (2): 0 407--419, 1996. doi:10.1006/jeth.1996.0096
1996
-
[12]
R. G. Chambers, Y. Chung, and R. F \" a re. Profit, directional distance functions, and nerlovian efficiency. Journal of Optimization Theory and Applications, 98 0 (2): 0 351--364, 1998. doi:10.1023/A:1022637501082
1998 doi
-
[13]
Charnes and W
A. Charnes and W. W. Cooper. Programming with linear fractional functionals. Naval Research Logistics Quarterly, 9 0 (3-4): 0 181--186, 1962. doi:10.1002/nav.3800090303
1962 doi
-
[14]
Charnes, W
A. Charnes, W. Cooper, and E. Rhodes. Measuring the efficiency of decision making units. European Journal of Operational Research, 2 0 (6): 0 429--444, 1978. doi:10.1016/0377-2217(78)90138-8
1978 doi
-
[15]
Charnes, W
A. Charnes, W. Cooper, and E. Rhodes. Short communication: Measuring the efficiency of decision making units. European Journal of Operational Research, 3 0 (4): 0 339, 1979. doi:10.1016/0377-2217(79)90229-7
1979 doi
-
[16]
Charnes, W
A. Charnes, W. W. Cooper, and E. Rhodes. Evaluating program and managerial efficiency: an application of data envelopment analysis to program follow through. Management Science, 27 0 (6): 0 668--697, 1981. doi:10.1287/mnsc.27.6.668
1981 doi
-
[17]
Charnes, W
A. Charnes, W. Cooper, B. Golany, L. Seiford, and J. Stutz. Foundations of data envelopment analysis for Pareto-Koopmans efficient empirical production functions. Journal of Econometrics, 30 0 (1-2): 0 91--107, 1985. doi:10.1016/0304-4076(85)90133-2
1985 doi
-
[18]
Charnes, W
A. Charnes, W. Cooper, and T. R.M. A structure for classifying and characterizing efficiency and inefficiency in data envelopment analysis. Journal of Productivity Analisys, 2: 0 197--237, 1991. doi:10.1007/BF00159732
1991 doi
-
[19]
Cherchye, T
L. Cherchye, T. Kousmanen, and T. Post. What is the economic meaning of FDH ? A reply to Thrall . Journal of Productivity Analysis, 13 0 (3): 0 263--267, 2000. doi:10.1023/A:1007827126369
-
[20]
T. J. Coelli. A Guide to DEAP Version 2.1: A Data Envelopment Analysis (Computer) Program . CEPA Working Paper 96/08, University of New England, Armidale, 1996
1996
-
[21]
T. J. Coelli, D. S. P. Rao, C. J. O'Donell, and G. E. Battese. An Introduction to Efficiency and Productivity Analysis. Springer, Boston, MA, 2005. ISBN 978-0-387-24265-1. doi:10.1007/b136381
2005 doi
-
[22]
Coll-Serrano, V
V. Coll-Serrano, V. J. Bol\'os, and R. Ben\' tez Su\'arez . deaR: Conventional and Fuzzy Data Envelopment Analysis , 2022. URL https://CRAN.R-project.org/package=deaR. R package version 1.3.2
2022
-
[23]
W. D. Cook and J. Zhu. DEA Cross Efficiency, pages 23--43. Springer US, Boston, MA, 2015. ISBN 978-1-4899-7553-9. doi:10.1007/978-1-4899-7553-9_2
2015 doi
-
[24]
W. D. Cook, L. Liang, and J. Zhu. Measuring performance of two-stage network structures by DEA : A review and future perspective. Omega, 38 0 (6): 0 423--430, 2010. doi:10.1016/j.omega.2009.12.001
2010 doi
-
[25]
W. W. Cooper, K. S. Park, and J. T. Pastor. RAM : A range adjusted measure of inefficiency for use with additive models, and relations to other models and measures in DEA . Journal of Productivity Analysis, 11 0 (1): 0 5--42, 1999. doi:10.1023/A:1007701304281
1999 doi
-
[26]
W. W. Cooper, K. S. Park, and J. T. Pastor. The range adjusted measure ( RAM ) in DEA : A response to the comment by Steinmann and Zweifel . Journal of Productivity Analysis, 15 0 (2): 0 145--152, 2001. doi:10.1023/A:1007882606735
2001 doi
-
[27]
W. W. Cooper, L. M. Seiford, and K. Tone. Data Envelopment Analysis. A Comprehensive Text with Models, Applications, References and DEA -Solver Software . Springer, 2nd edition, 2007. ISBN 9780387452814. doi:10.1007/978-0-387-45283-8
2007 doi
-
[28]
W. W. Cooper, J. T. Pastor, F. Borras, J. Aparicio, and D. Pastor. BAM : A bounded adjusted measure of efficiency for use with bounded additive models. Journal of Productivity Analysis, 35 0 (2): 0 85--94, 2011. doi:10.1007/s11123-010-0190-2
2011 doi
-
[29]
Daraio and L
C. Daraio and L. Simar. Advanced Robust and Nonparametric Methods in Efficiency Analysis. Springer US, 2007. ISBN 978-0-387-35155-1. doi:10.1007/978-0-387-35231-2
2007 doi
-
[30]
Daraio, K
C. Daraio, K. H. Kerstens, T. C. C. Nepomuceno, and R. Sickles. Productivity and efficiency analysis software: An exploratory bibliographical survey of the options. Journal of Economic Surveys, 33 0 (1): 0 85--100, 2019. doi:10.1111/joes.12270
2019 doi
-
[31]
Deprins, L
D. Deprins, L. Simar, and H. Tulkens. Measuring Labor-Efficiency in Post Offices, pages 285--309. Springer US, Boston, MA, 2006. ISBN 978-0-387-25534-7. doi:10.1007/978-0-387-25534-7_16
2006 doi
-
[32]
Doyle and R
J. Doyle and R. Green. Efficiency and cross-efficiency in DEA : Derivations, meanings and uses. Journal of the Operational Research Society, 45 0 (5): 0 567--578, 1994. doi:10.1057/jors.1994.84
1994 doi
-
[33]
J. Du, L. Liang, and J. Zhu. A slacks-based measure of super-efficiency in data envelopment analysis: A comment. European Journal of Operational Research, 204 0 (3): 0 694--697, 2010. doi:10.1016/J.EJOR.2009.12.007
2010 doi
-
[34]
Emrouznejad and E
A. Emrouznejad and E. Thanassoulis. A mathematical model for dynamic efficiency using data envelopment analysis. Applied Mathematics and Computation, 160 0 (2): 0 363--378, 2005. doi:10.1016/j.amc.2003.09.026
2005 doi
-
[35]
Emrouznejad and G.-L
A. Emrouznejad and G.-L. Yang. A survey and analysis of the first 40 years of scholarly literature in DEA : 1978–2016. Socio-Economic Planning Sciences, 61: 0 4--8, 2018. doi:10.1016/j.seps.2017.01.008
1978 doi
-
[36]
Emrouznejad, M
A. Emrouznejad, M. Tavana, and A. Hatami-Marbini. The State of the Art in Fuzzy Data Envelopment Analysis, pages 1--45. Springer Berlin Heidelberg, Berlin, Heidelberg, 2014. ISBN 978-3-642-41372-8. doi:10.1007/978-3-642-41372-8_1
2014 doi
-
[37]
F \"a re and S
R. F \"a re and S. Grosskopf. Modeling undesirable factors in efficiency evaluation: Comment. European Journal of Operational Research, 157 0 (1): 0 242--245, 2004. doi:10.1016/S0377-2217(03)00191-7
2004 doi
-
[38]
F \"a re and C
R. F \"a re and C. A. Knox Lovell . Measuring the technical efficiency of production. Journal of Economic Theory, 19 0 (1): 0 150--162, 1978. doi:10.1016/0022-0531(78)90060-1
1978 doi
-
[39]
F \"a re, S
R. F \"a re, S. Grosskopf, M. Norris, and Z. Zhang. Productivity growth, technical progress, and efficiency change in industrialized countries. The American Economic Review, 84 0 (1): 0 66--83, 1994. URL http://www.jstor.org/stable/2117971
1994
-
[40]
F \"a re, E
R. F \"a re, E. Grifell-Tatj\'e, S. Grosskopf, and C. A. Knox Lovell. Biased technical change and the Malmquist productivity index. The Scandinavian Journal of Economics, 99 0 (1): 0 119--127, 1997. doi:10.1111/1467-9442.00051
1997
-
[41]
F \"a re, S
R. F \"a re, S. Grosskopf, and P. Roos. Malmquist Productivity Indexes: A Survey of Theory and Practice, pages 127--190. Springer Netherlands, Dordrecht, 1998. ISBN 978-94-011-4858-0. doi:10.1007/978-94-011-4858-0_4
1998 doi
-
[42]
Golany and Y
B. Golany and Y. Roll. An application procedure for DEA . Omega, 17 0 (3): 0 237--250, 1989. doi:10.1016/0305-0483(89)90029-7
1989 doi
-
[43]
Grifell-Tatj \' e and C
E. Grifell-Tatj \' e and C. A. K. Lovell. A generalized Malmquist productivity index. Top, 7 0 (1): 0 81--101, 1999. doi:10.1007/BF02564713
1999 doi
-
[44]
Guo and H
P. Guo and H. Tanaka. Fuzzy DEA : A perceptual evaluation method. Fuzzy Sets and Systems, 119 0 (1): 0 149--160, 2001. doi:10.1016/S0165-0114(99)00106-2
2001 doi
-
[45]
Hatami-Marbini, A
A. Hatami-Marbini, A. Emrouznejad, and M. Tavana. A taxonomy and review of the fuzzy data envelopment analysis literature: Two decades in the making. European Journal of Operational Research, 214 0 (3): 0 457--472, 2011. doi:10.1016/j.ejor.2011.02.001
2011 doi
-
[47]
C. Kao. Dynamic data envelopment analysis: A relational analysis. European Journal of Operational Research, 227 0 (2): 0 325--330, 2013. doi:10.1016/j.ejor.2012.12.012
2013 doi
-
[48]
Kao and S.-T
C. Kao and S.-T. Liu. Fuzzy efficiency measures in data envelopment analysis. Fuzzy Sets and Systems, 113 0 (3): 0 427--437, 2000 a . doi:10.1016/S0165-0114(98)00137-7
-
[49]
Kao and S.-T
C. Kao and S.-T. Liu. Data envelopment analysis with missing data: An application to university libraries in Taiwan . Journal of the Operational Research Society, 51 0 (8): 0 897--905, 2000 b . doi:10.1057/palgrave.jors.2600056
-
[50]
Kao and S
C. Kao and S. T. Liu. A mathematical programming approach to fuzzy efficiency ranking. International Journal of Production Economics, 86 0 (2): 0 145--154, 2003. doi:10.1016/S0925-5273(03)00026-4
2003 doi
-
[51]
Knox Lovell and J
C. Knox Lovell and J. T. Pastor. Units invariant and translation invariant DEA models. Operations Research Letters, 18 0 (3): 0 147--151, 1995. doi:10.1016/0167-6377(95)00044-5
1995 doi
-
[52]
Le \' o n, V
T. Le \' o n, V. Liern, J. L. Ruiz, and I. Sirvent. A fuzzy mathematical programming approach to the assessment of efficiency with DEA models. Fuzzy Sets and Systems, 139 0 (2): 0 407--419, 2003. doi:10.1016/S0165-0114(02)00608-5
2003 doi
-
[53]
D.-J. Lim. DJL: Distance Measure Based Judgment and Learning , 2022. URL https://CRAN.R-project.org/package=DJL. R package version 3.8
2022
-
[54]
Lim and J
S. Lim and J. Zhu. DEA Cross Efficiency Under Variable Returns to Scale, pages 45--66. Springer US, Boston, MA, 2015 a . ISBN 978-1-4899-7553-9. doi:10.1007/978-1-4899-7553-9_3
2015 doi
-
[55]
Lim and J
S. Lim and J. Zhu. DEA cross-efficiency evaluation under variable returns to scale. Journal of the Operational Research Society, 66 0 (3): 0 476--487, 2015 b . doi:10.1057/jors.2014.13
2015 doi
-
[56]
Mamizadeh-Chatghayeh and M
S. Mamizadeh-Chatghayeh and M. Sanei. Using free disposal hull models in supply chain management. International Journal of Mathematical Modelling & Computations , 3 0 (2): 0 125--129, 2013. URL http://ijm2c.iauctb.ac.ir/article_521826.html
2013
-
[57]
Oh and with Dukrok Suh
D.-H. Oh and with Dukrok Suh. nonparaeff: Nonparametric Methods for Measuring Efficiency and Productivity , 2013. URL https://CRAN.R-project.org/package=nonparaeff. R package version 0.5-8
2013
-
[58]
O. B. Olesen and N. C. Petersen. Stochastic data envelopment analysis—a review. European Journal of Operational Research, 251 0 (1): 0 2--21, 2016. doi:10.1016/j.ejor.2015.07.058
2016 doi
-
[59]
J. T. Pastor and C. K. Lovell. A global Malmquist productivity index. Economics Letters, 88 0 (2): 0 266--271, 2005. doi:10.1016/j.econlet.2005.02.013
2005 doi
-
[60]
M. C. A. S. Portela, E. Thanassoulis, and G. Simpson. Negative data in DEA : A directional distance approach applied to bank branches. Journal of the Operational Research Society, 55 0 (10): 0 1111--1121, 2004. doi:10.1057/palgrave.jors.2601768
2004 doi
-
[61]
S. C. Ray and E. Desli. Productivity growth, technical progress, and efficiency change in industrialized countries: Comment. The American Economic Review, 87 0 (5): 0 1033--1039, 1997. URL http://www.jstor.org/stable/2951340
1997
-
[62]
Ruggiero
J. Ruggiero. Non-discretionary inputs. In Modeling Data Irregularities and Structural Complexities in Data Envelopment Analysis, pages 85--101. Springer US, Boston, MA, 2007. ISBN 9780387716060. doi:10.1007/978-0-387-71607-7\_5
2007 doi
-
[63]
L. M. Seiford and J. Zhu. Modeling undesirable factors in efficiency evaluation. European Journal of Operational Research, 142 0 (1): 0 16--20, 2002. doi:10.1016/S0377-2217(01)00293-4
2002 doi
-
[64]
Shestalova
V. Shestalova. Sequential Malmquist indices of productivity growth: An application to OECD industrial activities. Journal of Productivity Analysis, 19 0 (2): 0 211--226, 2003. doi:10.1023/A:1022857501478
2003 doi
-
[65]
B. W. Silverman. Density Estimation for Statistics and Data Analysis. Routledge, 1998. ISBN 9781315140919. doi:10.1201/9781315140919
1998 doi
-
[66]
Simar and P
L. Simar and P. W. Wilson. Sensitivity analysis of efficiency scores: How to bootstrap in nonparametric frontier models. Management Science, 44 0 (1): 0 49--61, 1998. doi:10.1287/mnsc.44.1.49
1998 doi
-
[67]
Simar and P
L. Simar and P. W. Wilson. Estimation and inference in two-stage, semi-parametric models of production processes. Journal of Econometrics, 136 0 (1): 0 31--64, 2007. doi:10.1016/j.jeconom.2005.07.009
2007 doi
-
[68]
Simm and G
J. Simm and G. Besstremyannaya. rDEA: Robust Data Envelopment Analysis ( DEA ) for R , 2020. URL https://CRAN.R-project.org/package=rDEA. R package version 1.2-6
2020
-
[69]
A. D. Soteriades. additiveDEA: Additive Data Envelopment Analysis Models , 2017. URL https://CRAN.R-project.org/package=additiveDEA. R package version 1.1
2017
-
[70]
R. M. Thrall. What is the economic meaning of FDH ? Journal of Productivity Analysis, 11 0 (3): 0 243--250, 1999. doi:10.1023/A:1007742104524
1999 doi
-
[71]
Tiedemann, T
T. Tiedemann, T. Francksen, and U. Latacz-Lohmann. Assessing the performance of German Bundesliga football players: A non-parametric metafrontier approach. Central European Journal of Operations Research, 19 0 (4): 0 571--587, 2011. doi:10.1007/s10100-010-0146-7
2011 doi
-
[72]
K. Tone. A slacks-based measure of efficiency in data envelopment analysis. European Journal of Operational Research, 130 0 (3): 0 498--509, 2001. doi:10.1016/S0377-2217(99)00407-5
2001 doi
-
[73]
K. Tone. A slacks-based measure of super-efficiency in data envelopment analysis. European Journal of Operational Research, 143 0 (1): 0 32--41, 2002. doi:10.1016/S0377-2217(01)00324-1
2002 doi
-
[74]
K. Tone. Dealing with undesirable outputs in DEA : A slacks-based measure ( SBM ) approach. GRIPS Research Report Series , 2003
2003
-
[75]
K. Tone. Variations on the theme of slacks-based measure of efficiency in DEA . European Journal of Operational Research, 200 0 (3): 0 901--907, 2010. doi:10.1016/j.ejor.2009.01.027
2010 doi
-
[76]
K. Tone. Dealing with desirable inputs in data envelopment analysis: A slacks-based measure approach. American Journal of Operations Management and Information Systems, 6 0 (4): 0 67--74, 2021. doi:10.11648/j.ajomis.20210604.11
2021 doi
-
[77]
Y. M. Wang and Y. X. Lan. Measuring Malmquist productivity index: A new approach based on double frontiers data envelopment analysis. Mathematical and Computer Modelling, 54 0 (11-12): 0 2760--2771, 2011. doi:10.1016/j.mcm.2011.06.064
2011 doi
-
[78]
P. W. Wilson. FEAR: A software package for frontier efficiency analysis with R . Socio-Economic Planning Sciences, 42 0 (4): 0 247--254, 2008. doi:10.1016/j.seps.2007.02.001
2008 doi
-
[79]
J. Wu, H. Tsai, and Z. Zhou. Improving efficiency in international tourist hotels in Taipei using a non-radial DEA model. International Journal of Contemporary Hospitality Management, 23 0 (1): 0 66--83, 2011. doi:10.1108/09596111111101670
2011 doi
-
[81]
J. Zhu. Quantitative Models for Performance Evaluation and Benchmarking, volume 213 of International Series in Operations Research & Management Science . Springer Cham, 2014. ISBN 978-3-319-06646-2. doi:10.1007/978-3-319-06647-9
2014 doi
-
[82]
Q. Zhu, J. Wu, X. Ji, and F. Li. A simple milp to determine closest targets in non-oriented dea model satisfying strong monotonicity. Omega, 79: 0 1--8, 2018. doi:10.1057/jors.1996.12
2018 doi
Reviewed August 7, 2026 · model on record in the stance chip above.
Discussion (0). Sign in to comment.