REVIEW 3 major objections 6 minor 26 references
Geo-Disasters: geocoding climate-related events in the international disaster database EM-DAT
T0 review · 3 major / 6 minor · reviewed 2026-08-07 · deepseek-v4-flash
Pith's one-line read This paper provides an open, reproducible geocoding of 9,217 climate-related disasters in EM-DAT from 1990 to 2023, assigning each event one or more administrative polygons and a four-tier quality flag.
desk verdict A genuinely useful, openly reproducible geocoding of EM-DAT with real improvements over GDIS, but the Q=1 flag overstates certainty because static 2015 boundaries are applied to events across 1990–2023. read the letter →
The pith
A machine-rendered reading of the paper's core claim, the machinery that carries it, and where it could break.
The reading
What carries the argument
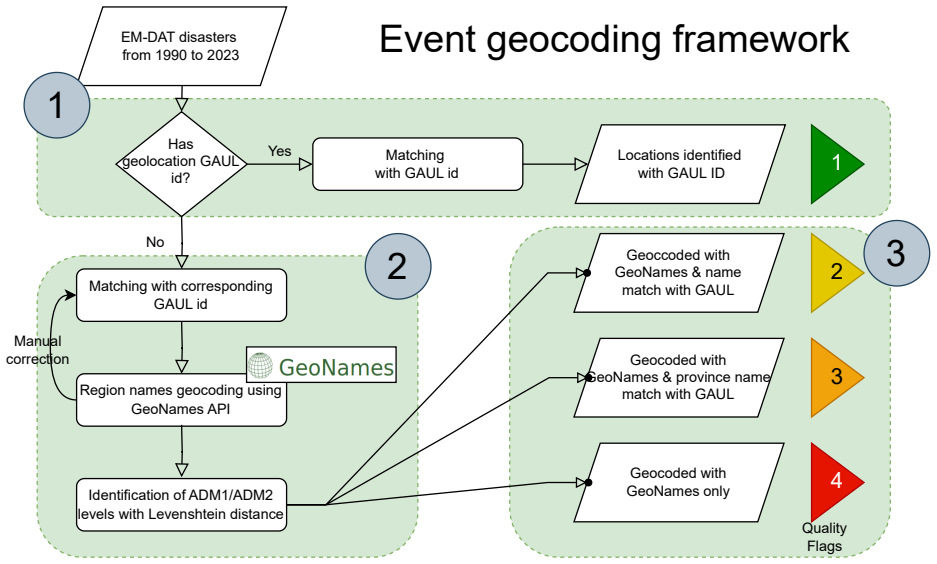
The machinery is a three-stage geocoding pipeline anchored on GAUL 2015, the Global Administrative Unit Layers that provide a harmonized set of national and sub-national boundaries. Stage one directly matches EM-DAT's GAUL identifiers to GAUL polygons, which yields quality flag 1 with no name ambiguity. Stage two handles records lacking identifiers by standardizing and cleaning place names, querying the GeoNames database, applying Levenshtein-based fuzzy matching and containment checks, and adding manual corrections, producing flags 2 through 4 depending on match certainty. Stage three assigns each event a single quality flag equal to the worst flag among its locations, so uncertainty in any one polygon propagates to the whole event footprint.
What would settle it
Take all events in the former Soviet Union and former Yugoslavia before 1992 that carry quality flag 1, and map their polygons against historical administrative boundaries from the early 1990s; if a nontrivial fraction of those polygons fall in territories that were not part of the affected republic or country at the time of the event, the highest quality flag would not mean what the paper claims for that period.
Extended reading notes
Core claim
The paper's central claim is that a reliable geocoding of EM-DAT's climate-related disasters can be built by exploiting the database's own GAUL administrative identifiers rather than starting from place names. Of the 45,121 assigned locations, 39,225 (86%, covering 7,375 of 9,217 events) come directly from those identifiers and receive the highest quality flag; the rest are recovered by cleaning and matching place names against GeoNames, with manual corrections for hard cases, and receive lower flags according to how the match was made. The authors also show that the earlier GDIS extension disagrees spatially with this ID-based result in about half of the events they share, including many events where EM-DAT had supplied structured codes, which they attribute to loss of information in name-only matching. The product is therefore a spatially explicit version of EM-DAT with an explicit confidence ladder, plus an open codebase for updating it.
Load-bearing premise
The load-bearing assumption is that GAUL 2015 boundaries and EM-DAT's GAUL codes describe the administrative geography that actually governed each event, even though borders changed substantially between 1990 and 2023 (for example, the dissolution of the Soviet Union and Yugoslavia).
Editorial extensions
If this is right
- EM-DAT records can now be joined to gridded climate, population, GDP, infrastructure, and governance layers at subnational scale, allowing hazard intensity, exposure, and vulnerability to be quantified together for 9,217 events.
- Users who need strict spatial accuracy can filter to event-level quality flag 1 or 2 and still retain a large majority of events, while users comfortable with uncertainty can keep everything with knowledge of the risk.
- The open code and version-controlled pipeline mean the geocoding can be regenerated as EM-DAT publishes new events, without repeating manual work.
- The mismatch analysis implies that published studies built on the earlier GDIS extension may have spatially biased footprints, and should be re-examined where their conclusions depend on location.
Reading between the lines
- A natural extension is to build a historical-boundary variant of the reference polygons, so that quality-1 events before major border changes are checked against contemporaneous administrative maps; this would tighten the weakest assumption.
- The quality-flag distribution points to a concrete target for community effort: the roughly 7.6% of events whose locations were built from mixed or fallback assignments, where ambiguity is concentrated.
- The same pipeline could be applied to the non-climate hazards in EM-DAT or to output point centroids in addition to polygons, making the data easier to use in raster-based impact studies that need a single coordinate per event.
Editorial analysis
A structured set of objections, weighed in public.
Referee Report
Summary. The manuscript introduces Geo-Disasters, a geocoded extension of EM-DAT for climate-related disasters from 1990 to 2023, covering 9,217 events and 45,121 subnational locations. The workflow uses EM-DAT GAUL identifiers when available, a GeoNames-based fallback with manual corrections otherwise, and assigns a four-tier quality flag to each location, with a conservative worst-case flag for each event. The authors validate against the GDIS database, reporting that about half of common events show negligible overlap, and attribute the discrepancies to GDIS's name-based geocoding. The dataset and code are made publicly available.
Significance. If the quality flags are reliable, this dataset would be a valuable resource for spatially explicit disaster-impact research. The paper's strengths are its open code and data, the detailed description of the geocoding workflow, the inclusion of manual curation, and the transparent quality-flag scheme. The comparison with GDIS also highlights real deficiencies in that earlier product. However, the central accuracy claim rests on two unvalidated assumptions: that static GAUL 2015 polygons represent administrative boundaries throughout 1990–2023, and that consistency with GDIS can stand in for independent accuracy. Both need to be addressed before the dataset can be used with confidence.
major comments (3)
- [Methods, Step 1; Data Records] The assignment of EM-DAT GAUL codes to static GAUL 2015 polygons is not validated for the full 1990–2023 period. The paper acknowledges that 'Substantial geopolitical changes reshaped many states worldwide' (Technical Validation, second paragraph) but uses this only to justify the 1990 cutoff, not to check whether pre-2000 GeoNames-based matches or post-2000 GAUL-ID matches are consistent with contemporaneous administrative boundaries. For events in countries such as the former USSR, Yugoslavia, Czechoslovakia, Ethiopia, and Sudan, the Q=1 flag ('virtually no risk of discrepancy', Methods, Step 3) is therefore not established. A concrete test would be to identify events in countries with major ADM changes, compare geometries against historical boundary sources (e.g., earlier GAUL versions or NHGIS), and quantify how many Q=1 events would change polygons. Without this, the highest-quality tier overstates certainty.
- [Technical Validation] The validation compares Geo-Disasters to GDIS, but GDIS is not ground truth; it uses a modern GADM boundary snapshot, so both datasets may share the same temporal boundary problem. The 90% overlap threshold is arbitrary and no sensitivity analysis is reported. The finding that 2,166 Q=1 events have an average mismatch of 56.2% with GDIS is interpreted as 'the inherent limitations of name-based geocoding' (Technical Validation, second paragraph), but without independent reference data (e.g., USGS water extents, hurricane tracks, or expert-verified locations for a sample), the authors cannot establish that the mismatch is predominantly GDIS error. The abstract's claim that the method 'remains accurate even when only region names are available' requires a direct accuracy benchmark rather than agreement with another derived product.
- [Technical Validation, first paragraph] The mismatch metric is not defined precisely. 'Spatial overlap of an event exceeds 90%' could mean a Jaccard index, intersection over the Geo-Disasters footprint, or another formulation, and the reported 'average mismatch of 56.2%' is ambiguous without the exact formula. The authors should define the metric (including whether it is computed on dissolved event geometries or at the level of individual location polygons), justify the 90% threshold, and provide a sensitivity analysis across thresholds. This is essential for reproducing the central quantitative validation result.
minor comments (6)
- [Abstract] The abstract states that the dataset covers '9,217 climate-related disasters reported by EM-DAT from 1990 to 2023', but the Methods clarify that only events with at least one non-missing impact variable are included; the abstract or Data Records section should state this filtering criterion explicitly.
- [Figure 3] The flowchart contains typographical errors ('Geoccoded' should be 'Geocoded'), and the label 'Geocoded withGeoNames & namematch' is missing spaces; these should be corrected.
- [Technical Validation] The validation comparison covers the overlapping period 1990–2018, but the dataset extends to 2023; the paper should explicitly state that events from 2019–2023 are not validated.
- [Methods, Step 2] The Levenshtein similarity criterion for fuzzy matching is not specified; the paper should state the threshold or decision rule used to accept a 'closest match' as valid.
- [Data Records] The polygon simplification tolerance of 0.005 degrees may affect overlap computations; the paper should clarify whether the validation used simplified or unsimplified geometries, and whether the published dataset contains only simplified polygons.
- [Methods, manual review] The 829 manual matches and the manual corrections are described with examples but not provided as a machine-readable list; if this information is available in the code repository, the paper should point to its exact location, since it is needed to reproduce or update the dataset.
Circularity Check
No circularity found: the geocoding pipeline relies on external administrative boundaries and gazetteers, and the quality flags are assigned from source-derived matching rules rather than from the output being predicted.
full rationale
The derivation chain in Geo-Disasters is self-contained against external references, not circular. The core procedure assigns polygons using EM-DAT's native GAUL identifiers where available and falls back to GeoNames name matching mapped onto GAUL units; both GAUL and GeoNames are independent external data sources, not outputs of the paper. The four-tier quality flag is defined by the mechanism of location assignment (direct GAUL ID, exact GeoNames name match, fuzzy match, fallback), so the flags summarize the provenance of each geometry rather than being fitted to the geocoded results. The comparison with GDIS is an external consistency check and provides no input to the geocoding, so it cannot make the validation circular. The only self-citations are background references or ancillary data citations (e.g., Mahecha et al. 2020, Sauer et al. 2024), and none is load-bearing for the geocoding claim. The main correctness risk identified in the text, namely that static GAUL 2015 boundaries are used for events spanning 1990-2023 without historical-boundary validation, is a legitimate data-quality limitation, but it is not a circularity: the assigned polygons are not defined in terms of the quality flags, nor does the quality flag reduce to the spatial footprint it is supposed to certify. No fitted parameter is renamed as a prediction, and no claimed result is equivalent to its input by construction.
Assumptions & free parameters
free parameters (3)
- Validation overlap threshold =
0.90
- Polygon simplification tolerance =
0.005 degrees (~550 m)
- Temporal cut-off =
1990
assumptions (3)
- domain assumption GAUL 2015 administrative boundaries and identifiers correctly represent the affected regions for all events from 1990 to 2023.
- domain assumption GeoNames contains the place names listed in EM-DAT and its country filter returns the intended location.
- domain assumption Levenshtein fuzzy matching between GeoNames names and GAUL names is a reliable indicator of the same administrative unit.
Cite this review
Pith. "Pith review of Geo-Disasters: geocoding climate-related events in the international disaster database EM-DAT." pith.science (2026). https://pith.science/paper/7PO63I4O
@misc{pith2026250603797,
  author       = {Pith},
  title        = {Pith review of: Geo-Disasters: geocoding climate-related events in the international disaster database EM-DAT},
  year         = {2026},
  howpublished = {\url{https://pith.science/paper/7PO63I4O}},
  note         = {Machine review of arXiv:2506.03797}
}
read the original abstract
Climate hazards can escalate into humanitarian disasters. Understanding their trajectories -- considering hazard intensity, human exposure, and societal vulnerability -- is essential for effective anticipatory action. The International Disaster Database (EM-DAT) is the only freely available global resource of humanitarian disaster records. However, it lacks exact geospatial information, limiting its use for climate hazard impact research. Here, we provide geocoding of 9,217 climate-related disasters reported by EM-DAT from 1990 to 2023, along with an open, reproducible framework for updating. Our method remains accurate even when only region names are available and includes quality flags to assess reliability. The augmented EM-DAT enables integration with other geocoded data, supporting more accurate assessment of climate disaster impacts and adaptation deficits.
Figures


Figures from the paper (4 more)


Reference graph
Works this paper leans on
-
[1]
Carleton, T. A. & Hsiang, S. M. Social and economic impacts of climate. Science 353, aad9837, 10.1126/science.aad9837 (2016)
-
[2]
Field, C. B., Barros, V ., Stocker, T. F. & Dahe, Q. (eds.)Managing the Risks of Extreme Events and Disasters to Advance Climate Change Adaptation: Special Report of the Intergovernmental Panel on Climate Change (Cambridge University Press, 2012), 1 edn
work page 2012
-
[3]
D., Guha-Sapir, D., Smits, J., Gans, F
Mahecha, M. D., Guha-Sapir, D., Smits, J., Gans, F. & Kraemer, G. Data challenges limit our global understanding of humanitarian disasters triggered by climate extremes. In Climate Extremes and Their Implications for Impact and Risk Assessment, 243–256, 10.1016/B978- 0- 12- 81489 5-2.00013-6 (Elsevier, 2020). 7/16
-
[4]
Hersbach, H. et al. The ERA5 global reanalysis. Q. J. Royal Meteorol. Soc. 146, 1999–2049, 10.1002/qj.3803 (2020)
doi:10.1002/qj.3803 2020
-
[5]
Schiavina, M., Freire, S. & MacManus, K. GHS-POP R2023A - GHS population grid multitemporal (1975-2030), 10.2905/2FF68A52-5B5B-4A22-8F40-C41DA8332CFE (2023)
-
[6]
Kummu, M., Kosonen, M. & Masoumzadeh Sayyar, S. Downscaled gridded global dataset for gross domestic product (GDP) per capita PPP over 1990–2022. Sci. Data 12, 178, 10.1038/s41597-025-04487-x (2025)
-
[7]
Nirandjan, S., Koks, E. E., Ward, P. J. & Aerts, J. C. J. H. A spatially-explicit harmonized global dataset of critical infrastructure. Sci. Data 9, 150, 10.1038/s41597-022-01218-4 (2022)
- [8]
Show all 26 references
-
[9]
V-Dem Dataset v14, 10.23696/MCWT-FR58 (2024)
Michael Coppedge et al. V-Dem Dataset v14, 10.23696/MCWT-FR58 (2024)
2024 doi
-
[10]
Land Cover CCI Product User Guide Version 2
ESA. Land Cover CCI Product User Guide Version 2. Tech. Rep. (2017)
2017
-
[11]
Nardi, F., Annis, A., Di Baldassarre, G., Vivoni, E. R. & Grimaldi, S. GFPLAIN250m, a global high-resolution dataset of Earth’s floodplains. Sci. Data 6, 180309, 10.1038/sdata.2018.309 (2019)
2019 doi
-
[12]
EM-DAT, the Emergency Events Database (2025)
CRED / UCLouvain. EM-DAT, the Emergency Events Database (2025)
2025
-
[13]
Delforge, D. et al. Em-dat: the emergency events database. Int. J. Disaster Risk Reduct. 124, 105509, 10.1016/j.ijdrr.2025 .105509 (2025)
2025 doi
-
[14]
Donatti, C. I. et al. Global hotspots of climate-related disasters. Int. J. Disaster Risk Reduct. 108, 104488, 10.1016/j.ijdrr. 2024.104488 (2024)
2024
-
[15]
& International Research Institute of Disaster Science (IRIDeS), Tohoku University 468-1-S302 Aoba, Aramaki, Aoba-ku, Sendai, Miyagi 980-0845, Japan
Moriyama, K., Sasaki, D., Ono, Y . & International Research Institute of Disaster Science (IRIDeS), Tohoku University 468-1-S302 Aoba, Aramaki, Aoba-ku, Sendai, Miyagi 980-0845, Japan. Comparison of Global Databases for Disaster Loss and Damage Data. J. Disaster Res. 13, 1007–...
2018 doi
-
[16]
& Steuer, M
Wirtz, A., Kron, W., Löw, P. & Steuer, M. The need for data: Natural disasters and the challenges of database management. Nat. Hazards 70, 135–157, 10.1007/s11069-012-0312-4 (2014)
2014 doi
-
[17]
L., Guha-Sapir, D
Jones, R. L., Guha-Sapir, D. & Tubeuf, S. Human and economic impacts of natural disasters: Can we trust the global data? Sci. Data 9, 572, 10.1038/s41597-022-01667-x (2022)
2022 doi
-
[18]
Lindersson, S. et al. The wider the gap between rich and poor the higher the flood mortality. Nat. Sustain. 10.1038/s41893 -023-01107-7 (2023)
2023 doi
-
[19]
& Schewe, J
Mester, B., Frieler, K. & Schewe, J. Human displacements, fatalities, and economic damages linked to remotely observed floods. Sci. Data 10, 482, 10.1038/s41597-023-02376-9 (2023)
2023 doi
-
[20]
Sauer, I. J. et al. Limited progress in global reduction of vulnerability to flood impacts over the past two decades. Commun. Earth & Environ. 5, 239, 10.1038/s43247-024-01401-y (2024)
2024 doi
-
[21]
Rosvold, E. L. & Buhaug, H. GDIS, a global dataset of geocoded disaster locations. Sci. Data 8, 61, 10.1038/s41597-021 -00846-6 (2021)
2021 doi
-
[22]
Database of Global Administrative Areas, https://gadm.org/ (2022)
GADM. Database of Global Administrative Areas, https://gadm.org/ (2022). 8/16
2022
-
[23]
Global administrative unit layers (gaul), 2015 version, https://www.fao.org/geonetwork/srv/en/metadata.show?id=12691
Food and Agriculture Organization of the United Nations. Global administrative unit layers (gaul), 2015 version, https://www.fao.org/geonetwork/srv/en/metadata.show?id=12691
2015
-
[24]
The GeoNames geographical database, http://geonames.org/ (2025)
GeoNames. The GeoNames geographical database, http://geonames.org/ (2025)
2025
-
[25]
Geological Survey
U.S. Geological Survey. Hurricane Irma’s water footprint. https://labs.waterdata.usgs.gov/visualizations/hurricane-irma/in dex.html. Interactive visualization, accessed 2025-05-09. Acknowledgements We thank the European Space Agency for funding ARCEME, Grant Number: 4000137109...
2025
-
[2000]
15/16 Figure 7
Nevertheless, the event reporting in 1990’s provides between 100 and 200 events per year of good quality, useful for studying disasters in the past three decades. 15/16 Figure 7. Distribution of geocoding quality flags. The quality flags are attributed at the location scale, a...
1990
Reviewed August 7, 2026 · model on record in the stance chip above.
Discussion (0). Sign in to comment.