REVIEW 4 major objections 5 minor 13 references
Market power abuse in wholesale electricity markets
T0 review · 4 major / 5 minor · reviewed 2026-08-07 · deepseek-v4-flash
Pith's one-line read This paper claims that hourly net profit from withholding or pushing in generation capacity, measured from supply-slope, net exposure, and contribution margin, predicts strategic deviations from competitive dispatch in Germany's day-ahead…
desk verdict A genuinely useful screening method with a load-bearing identification weakness: the incentive slope is estimated from the same realized prices the paper later treats as potentially manipulated, so the causal language outruns the evidence. read the letter →
The pith
A machine-rendered reading of the paper's core claim, the machinery that carries it, and where it could break.
The reading
What carries the argument
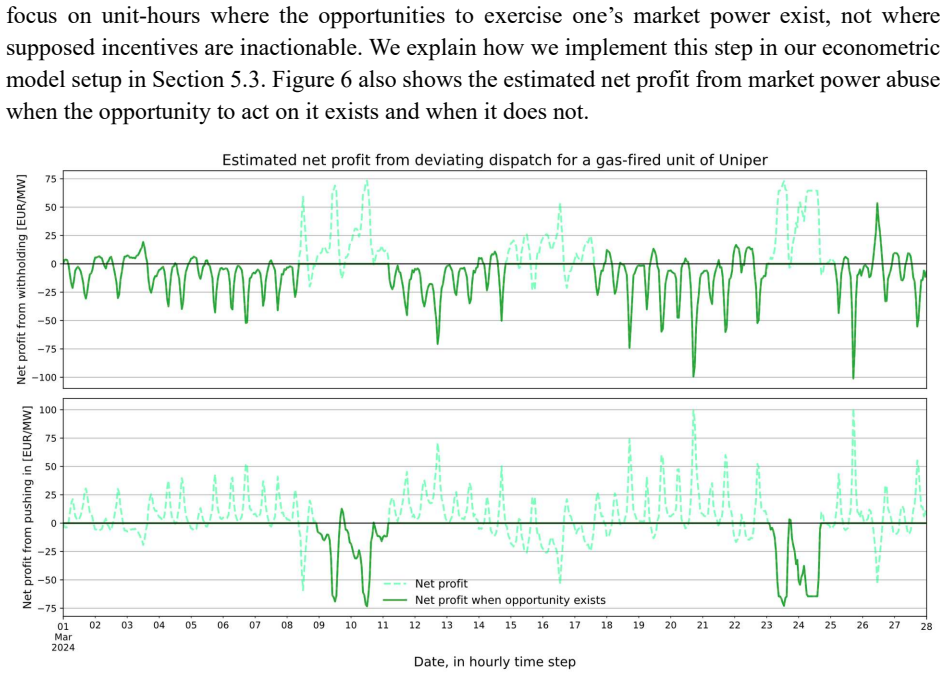
The central object is the hourly net profit of a one-megawatt deviation. For withholding, $\pi^{\mathrm{W}}_{i,j,h} = \delta_h (G_{j,h} - Q^{\mathrm{hedged}}_{j,m}) - (p_h - c_{i,h})$; for push-in, $\pi^{\mathrm{P}}_{i,j,h} = -\delta_h (G_{j,h} - Q^{\mathrm{hedged}}_{j,m}) + (p_h - c_{i,h})$. The first term multiplies the company's net exposure (generation minus hedged quantity) by $\delta_h$, the estimated slope of the realized day-ahead price with respect to residual load within fuel-price regimes, which is the price impact of a one-MW supply change. The second term is the unit's contribution margin, spot price minus variable cost, the opportunity cost of deviating. The net-exposure term is built from monthly on-peak and off-peak average generation at a hedge rate of one. These incentives enter an exogenous regime-switching logit: the competitive dispatch estimate decides whether a unit can be withheld (predicted on) or pushed in (predicted off), and the model asks whether deviation probability rises with net profit. The slope, exposure, and margin each vary hourly, which is what gives the incentive measure its high temporal specificity.
What would settle it
Re-estimate the whole chain using a price-impact slope built from a purely competitive marginal-cost stack—unit-level costs and available capacities with no realized price data—and rerun the logit on the same deviation outcomes. If the positive association between the incentive and observed withholding or push-in weakens substantially or disappears, the main result is an artifact of estimating the slope from the same hours whose behavior it is meant to explain.
Extended reading notes
Core claim
On its own terms, the paper's discovery is that suspected capacity withholding and push-in in the German wholesale electricity market vary systematically with the hourly net profit of committing them. Where the competitive benchmark says a unit should generate but it does not, the logit coefficient of 0.0102 means each euro of net profit per megawatt withheld raises the odds of withholding by about 1%; where the benchmark says a unit should be off but it generates, the coefficient of 0.0034 means each euro of push-in profit raises those odds by about 0.3%. These associations appear across all six years, across technologies, and in 10 of 15 companies in both directions. Aggregated, the model implies an expected 2.4% of annual load withheld and 1.8% pushed in, with average spot-price effects of about +3.5 EUR/MWh and -2.9 EUR/MWh, respectively, and extremes of +160 and -38 EUR/MWh. The paper interprets the result as empirical evidence of systematic market power abuse and stresses that its conservative choices make the estimates a lower bound.
Load-bearing premise
Everything rests on treating the slope of the realized price-residual-load curve, estimated from the same sample whose behavior is then tested, as the price impact a single firm can cause by changing supply by one megawatt; if realized prices are themselves distorted by market power or other omitted factors, the incentive variable is mismeasured and the main regression may reflect shared errors rather than deliberate withholding.
Editorial extensions
If this is right
- The estimated incentive can serve as a screening signal: hours with high net profit from withholding are where missing generation should be investigated, and hours with high push-in profit are where uneconomic generation should be.
- The effect sizes are economically large: moving net profit from 0 to 200 EUR/MW raises the predicted probability of observing withholding from 24% to 71% and of observing push-in from 28% to 44%.
- Because reported outages are taken as genuine and dispatch is discretized, the measured abuse is a lower bound; including strategic outage declarations or partial withholding would move the estimates upward.
- Company hedge positions become relevant evidence for market-power monitoring, since they determine whether the incentive points upward or downward.
- Offering finer-grained forward products than the standard on-peak and off-peak baseload futures should let hedging align with market-power-neutral positions and reduce abuse in both directions.
Reading between the lines
- The same unit-hour incentive construction could be transferred to other day-ahead markets or to the German intraday market; the market slope, hedge conventions, and unit mix differ, so the magnitude of the coefficients would be a new empirical question.
- Because the price-impact slope is estimated from realized prices, the incentive measure risks being self-confirming: if withholding already raises prices, the realized slope overstates the competitive price impact. A fairer test would derive the slope from a counterfactual marginal-cost stack before estimating the logit.
- The push-in channel implies that high hedge ratios, usually praised for neutralizing market power, can create a motive to depress prices; policy that encourages hedging without finer products may substitute downward manipulation for upward manipulation.
- The framework points to a testable extension for renewables: once turbine- or company-level generation data are public, wind and solar curtailment could be screened with the same incentive measure, since VRE owners may manipulate prices to benefit their unhedged or thermal positions.
Editorial analysis
A structured set of objections, weighed in public.
Referee Report
Summary. The paper develops a three-step method to detect suspected market power abuse in the German day-ahead wholesale electricity market over 2019-2024. First, a unit-level competitive dispatch counterfactual is estimated with a Monte Carlo mixed-integer optimization model, and deviations of observed dispatch from this counterfactual are coded as negative (withholding) or positive (push-in). Second, an hourly, unit-specific net profit incentive for withholding or pushing in one MW is constructed from the slope of the realized price-residual load curve, the company's estimated net exposure from hedging, and the unit's contribution margin. Third, regime-switching logit models link these incentives to the observed deviations. The main finding is that the probability of withholding rises about 1% per euro of net profit per MW and the probability of push-in rises about 0.3%, which the authors interpret as empirical evidence of systematic market power abuse.
Significance. If the identification is accepted, the paper makes a valuable contribution by operationalizing the previously neglected role of hedging in creating incentives for both upward and downward price manipulation, and by providing an hourly, unit-level, interpretable measure of those incentives. The German setting, the six-year sample, and the inclusion of extensive robustness checks (year-, technology-, and company-specific models, hedge-rate sensitivities) add empirical substance. The authors also make replication code and data openly available, which is a clear strength. However, the central 'systematic market power abuse' claim rests on an incentive measure that is built from realized prices within the same sample whose behavior is later tested, and the paper's defense of causal interpretation is an assertion rather than a demonstrated identification strategy.
major comments (4)
- [Section 5.2, Eq. (6) and Section 5.1] The load-bearing assumption is that delta_h in Eq. (6), estimated by piecewise linear fits of realized day-ahead prices on residual load within fuel-price regimes, measures the price impact of a unilateral one-MW supply change. But realized prices are equilibrium outcomes that already include any withholding and push-in the paper aims to detect, plus redispatch and other hourly shocks. The same realized prices enter the competitive dispatch benchmark in Section 5.1. Consequently, the positive logit coefficients in Table 2 can arise from the shared dependence of y and pi on realized prices and the same estimation sample, rather than from deliberate unit-level decisions. I recommend re-estimating delta_h from a cost-stack merit-order curve (or from firm-level residual demand) as a core robustness check, and reporting whether the main coefficients survive this re-estimation.
- [Section 5.3, Eqs. (10)-(11)] The claim that no additional control variables are needed for a causal interpretation after conditioning on z_i,h is not supported. z_i,h encodes only predicted competitive dispatch status; it does not absorb hourly scarcity, residual load, redispatch, or strategic price elevation that are common to both y and delta_h. The statement that 'there is no other association ... than what is already captured by the model' is asserted, not derived. A sensitivity analysis including controls such as residual load, day-ahead price level, hour-of-day fixed effects, or month fixed effects would be a concrete and feasible way to test this claim.
- [Section 5.2, Eqs. (7)-(8)] The hedged quantity Q_hedged is constructed as the hedge rate r times the monthly average of realized generation G_j,h, with r assumed to be 1 in the main specification. Because average realized generation is itself affected by the withholding and push-in behavior under study, the net exposure measure is partly endogenous: a firm that withholds more in a month also lowers its average generation, which changes Q_hedged and hence the incentive variable. The sensitivity analysis in Table 5 only varies r and does not address this mechanical feedback. An instrument or a construction of Q_hedged from forward-market data (even from a subsample) would strengthen the inference.
- [Section 6.1, Table 2 and Section 7] The interpretation of the results as 'empirical evidence of systematic market power abuse' goes beyond what the reported associations support. The McFadden R2 values are 3.1% and 0.6%, and the paper itself notes that low goodness of fit is expected; the coefficients, while statistically significant, are economically small at the median incentive values, and the probability projections in Table 3 rely on extreme combinations of slope and exposure. The discussion in Section 7 should be reframed as evidence of incentive-correlated deviations that are 'suspected' or 'potential' abuse, consistent with the conservative language used earlier in the paper, unless the identification concerns in the first three comments are resolved.
minor comments (5)
- [Section 5.3, Eq. (11)] The notation in Eq. (11) conditions on z_i,h = -1, but z_i,h is defined in Section 5.1 as taking values 0 or 1; this inconsistency should be corrected.
- [Section 5.3] The model is described as an 'exogenous regime-switching logit,' but the implementation is two separate logit regressions run on subsamples defined by z. This distinction should be clarified, since a true regime-switching model would estimate parameters jointly with switching probabilities.
- [Section 6.1, Table 3 and Appendix B, Table B1] Table B1 has a column heading reading 'Net profit (EUR per MW withheld)' in a table about push-in; this appears to be a copy-paste error and should read 'pushed in.'
- [Section 5.2, Eq. (6)] The functional form of the supply-curve slope in Eq. (6) is not fully specified in the text; the description jumps from the general partial derivative to 'piecewise linear fits' without stating the estimation criterion (e.g., breakpoint selection, segment count, smoothing). Appendix B shows the fits but not the criterion.
- [Section 7] The discussion of REMIT cases is interesting but only loosely connected to the empirical results; a sentence clarifying how the proposed screening tool would relate to the legal standard of 'abuse' would help readers.
Circularity Check
No circularity: the incentive measure is constructed from a profit derivative, not fitted to the outcome; the main endogeneity concern is an identification threat, not a definitional reduction.
full rationale
The claimed derivation chain is: (i) construct a competitive dispatch benchmark from a unit-commitment model using realized prices and costs (Section 5.1, Appendix A); (ii) compute the hourly net profit from withholding or push-in as the partial derivative of the company profit equation (Eq. 1), yielding Eqs. 4-5 as functions of the estimated supply-slope delta_h, net exposure, and contribution margin (Section 5.2); (iii) regress the discrete outcome y on this profit measure with a regime-switching logit (Section 5.3, Eqs. 10-11). The predictor pi is not fitted to the outcome y; it is a constructed regressor, and the logit coefficient could have been zero or negative. The paper does not define pi in terms of y, nor does it invoke a self-citation chain to force the result. The self-citations present (Fusar Bassini 2025 for the unit-level dataset; Hirth et al. 2024 for demand inelasticity) are not load-bearing arguments for the central estimate. A genuine identification threat exists: delta_h is estimated from realized prices and residual load (Eq. 6), and the competitive benchmark treats realized prices as exogenous (Appendix A: "The electricity prices are treated as being exogenous to the dispatch of the units and are as realized"). If realized prices already reflect withholding or push-in behavior, then y and pi share a common price channel, and the Section 5.3 assertion that conditioning on predicted status z removes omitted-variable bias is overconfident. However, the mechanical margin term (p - c) in Eqs. 4-5 enters with a sign that opposes the hypothesized withholding association, so the positive coefficient is not forced by construction. This is an omitted-variable/simultaneity concern for causal interpretation, not a circular derivation. Accordingly, no circular step meets the evidence bar, and the appropriate score is 0.
Assumptions & free parameters
free parameters (7)
- Supply curve slope delta_h (piecewise linear fits per regime) =
Not reported as single values; estimated within 12 regimes (Figure B1)
- Number of fuel price regimes / breakpoints =
11 breakpoints (12 regimes), chosen at 95% variance explained; robustness checked up to 20
- Hedge rate r =
1 (main), 0.7, 0 (sensitivity)
- Hedged quantity Q_hedged =
Average monthly generation split by on-peak and off-peak hours (Eq. 8)
- Competitive benchmark confidence thresholds =
0.05 and 0.95 for d_bar (z variable)
- Monte Carlo perturbation standard deviation =
0.05 for fuel cost, efficiency, and cold start factor multipliers
- Capacity unit for push-in sensitivity =
One-third of installed capacity in sensitivity run
assumptions (10)
- standard math MILP and logit maximum likelihood estimation are correctly specified as used.
- domain assumption Realized day-ahead prices can be treated as exogenous in the competitive dispatch benchmark.
- domain assumption Perfect foresight of prices over the five-week rolling horizon.
- domain assumption Hedged quantity equals r times average generation per month and peak group, with r = 1.
- domain assumption The price-residual load slope delta identifies the unilateral price impact of a one-MW supply change.
- domain assumption Reported outages are genuine, not strategic.
- domain assumption Nuclear, hydro, variable renewables, and imports are assumed competitive and non-abusive.
- domain assumption No market clearing, ramping constraints, or planned maintenance are modeled in the competitive benchmark; unit decisions are independent.
- ad hoc to paper No additional control variables are needed for a causal interpretation after conditioning on predicted dispatch.
- domain assumption Balancing and ancillary market revenues do not affect day-ahead generation decisions.
Cite this review
Pith. "Pith review of Market power abuse in wholesale electricity markets." pith.science (2026). https://pith.science/paper/7LYXROST
@misc{pith2026250603808,
  author       = {Pith},
  title        = {Pith review of: Market power abuse in wholesale electricity markets},
  year         = {2026},
  howpublished = {\url{https://pith.science/paper/7LYXROST}},
  note         = {Machine review of arXiv:2506.03808}
}
read the original abstract
In wholesale electricity markets, prices fluctuate widely from hour to hour and electricity generators price-hedge their output using longer-term contracts, such as monthly base futures. Consequently, the incentives they face to drive up the power prices by reducing supply has a high hourly specificity, and because of hedging, they regularly also face an incentive to depress prices by inflating supply. In this study, we explain the dynamics between hedging and market power abuse in wholesale electricity markets and use this framework to identify market power abuse in real markets. We estimate the hourly economic incentives to deviate from competitive behavior and examine the empirical association between such incentives and observed generation patterns. Exploiting hourly variation also controls for potential estimation bias that do not correlate with economic incentives at the hourly level, such as unobserved cost factors. Using data of individual generation units in Germany in a six-year period 2019-2024, we find that in hours where it is more profitable to inflate prices, companies indeed tend to withhold capacity. We find that the probability of a generation unit being withheld increases by about 1 % per euro increase in the net profit from withholding one megawatt of capacity. The opposite is also true for hours in which companies benefit financially from lower prices, where we find units being more likely to be pushed into the market by 0.3 % per euro increase in the net profit from capacity push-in. We interpret the result as empirical evidence of systematic market power abuse.
Figures


Figures from the paper (5 more)




Reference graph
Works this paper leans on
-
[1]
with the economic incentives for doing so 𝜋,ᇱ (as determined in step 2). We hypothesize that generators tend to withhold capacity more often if it is more profitable for them to do so and, vice versa, push capacity into the market more frequently if that is more profitable. If part of the observed deviation in dispatch 𝑦, is the result of intentional,...
-
[4]
Data We obtain wholesale electricity market data from ENTSO-E Transparency Platform (ENTSO-E
-
[5]
Method To identify market power abuse, we employ a three-step methodology. We first use an optimization model to estimate the profit-maximizing dispatch of generation units, assuming competitive (price- taking) behavior. This gives us a time series of competitive dispatch estimates for each generation unit, which we then compare against observed generatio...
work page 2017
-
[6]
Results In this section, we present our findings on the overall market, followed by results from year-, technology- and company-specific model runs. We also include model sensitivity results by varying levels of hedge rate and changing the unit of account from per-megawatt to per-unit. 6.1 Main results Our main specification consists of two mutually exclu...
work page 1974
-
[7]
Discussion The 2011-introduced REMIT Article 5 prohibits market manipulation of various kinds on wholesale energy markets. The cases of REMIT breaches published by the EU Agency for the Cooperation of Energy Regulators (ACER 2023) so far have found market manipulation via issuing non-genuine trade orders to mislead the market (ANRE 2022) and artificially ...
work page 2011
-
[8]
Conclusion Market power abuse is typically difficult to pin down in electricity markets, due to its volatile nature at the hourly level. We provide a measure of the hourly net profit from exercising one’s market power and explain unit deviation in dispatch with variations in price-altering incentives between hours. For thermal, dispatchable generation uni...
-
[9]
Bibliography 50Hertz Transmission GmbH, Amprion GmbH, TenneT TSO GmbH, and TransnetBW GmbH
-
[10]
“Systemanalysen ÜNB 2024.” https://data.bundesnetzagentur.de/Bundesnetzagentur/SharedDocs/Downloads/DE/Sachge biete/Energie/Unternehmen_Institutionen/Versorgungssicherheit/Netzreserve/Systemanal ysen_UeNB_2024.pdf. Abrell, Jan, Friedrich Kunz, and Hannes Weigt. 2008. “Start Me Up Modeling of Power Plant Start-Up Conditions and Their Impact on Prices.” SSR...
arXiv 2024
Show all 13 references
-
[11]
The model operates over a planning horizon of H hourly time steps and focuses on a single generation unit
Appendix A: Optimization model for competitive power plant dispatch This appendix describes the optimization model we use to predict the competitive dispatch behavior of thermal power plants. The model operates over a planning horizon of H hourly time steps and focuses on a si...
-
[13]
Piece-wise linear fits within all 12 clusters, representing distinct regimes of electricity market supply for the sample period 2019-2024
Appendix B: Additional figures and tables Piecewise linear estimates for the slope of the supply curve, within each regime Figure B1. Piece-wise linear fits within all 12 clusters, representing distinct regimes of electricity market supply for the sample period 2019-2024. 38 T...
2019
-
[2021]
The optimization model is solved iteratively for each unit 𝑖 over planning horizons 𝑚 of length 𝐻, with a one-day overlap to mitigate boundary effects
and used the GNU Linear Programming Kit (Makhorin 2012) as the solver. The optimization model is solved iteratively for each unit 𝑖 over planning horizons 𝑚 of length 𝐻, with a one-day overlap to mitigate boundary effects. To account for parameter uncertainty, a Monte Carlo s...
2017
-
[2024]
and unit generation and outage reports from EEX Transparency Platform (EEX 2024; Fusar Bassini 2025).5 We then conduct manual checks to fill in the gaps for specific generation units that lack information on the two platforms. We estimate marginal cost of production for indivi...
2024
-
[2025]
Sequential Markets, Market Power, and Arbitrage
https://www.investing.com/commodities/dutch-ttf-gas-c1-futures-historical-data. Ito, Koichiro, and Mar Reguant. 2016. “Sequential Markets, Market Power, and Arbitrage.” American Economic Review 106 (7): 1921–57. https://doi.org/10.1257/aer.20141529. Joskow, Paul L., and Edward...
2016
Reviewed August 7, 2026 · model on record in the stance chip above.
Discussion (0). Sign in to comment.