REVIEW 3 major objections 5 minor 51 references
A note on metapopulation models
T0 review · 3 major / 5 minor · reviewed 2026-08-07 · deepseek-v4-flash
Pith's one-line read Metapopulation models that treat each patch as internally homogeneous underestimate the basic reproduction number and overstate the effect of uniform interventions.
desk verdict A clearly written note with a correct qualitative message but a load-bearing error in the metapopulation R0 definition: Eq. (7) says sum, the calculations use a weighted mean, and neither is the invasion threshold. read the letter →
The pith
A machine-rendered reading of the paper's core claim, the machinery that carries it, and where it could break.
The reading
What carries the argument
The load-bearing object is the patch-specific reproduction number, whose form depends on which trait varies: $\mathcal{R}_{0i}=\langle x\rangle_i\,\beta/(\gamma+\mu)$ for susceptibility and $\mathcal{R}_{0i}=\langle x^2\rangle_i/\langle x\rangle_i\,\beta/(\gamma+\mu)$ for connectivity, with the paper's metapopulation $\mathcal{R}_0$ taken as their sum. The argument is carried by selective depletion—within a patch, high-risk individuals are infected first, lowering the mean risk of remaining susceptibles—and by the inverse problem that reads $\beta$ and the risk factors $x_1,x_2$ back out of observed patch-level outcomes. For the SIR case the inversion uses the implicit final-size relations (13) and (14)–(15); for the SI case it solves the endemic equilibrium equations (11) or (12). The two-patch analysis is organised by an interpolation parameter $q_A(x_2)$, the fraction of high-risk individuals in the larger patch, which moves from completely segregated risk classes to identical patches. The COVID-19 application uses the Scottish Index of Multiple Deprivation to set $q_A(x_2)$ and $q_B(x_2)$ from the share of data zones in the most deprived quintile.
What would settle it
Simulate the paper's two-patch SI or SIR system at $q_A(x_2)=0$ with a single infectious seed placed only in the low-risk patch and no between-patch transmission: with $\mathcal{R}_{0A}=1.5$ and $\mathcal{R}_{0B}=9$, the low-risk patch cannot sustain an outbreak, whereas the paper's summed $\mathcal{R}_0=3$ predicts one; the absence of a metapopulation-wide outbreak in that simulation would show that the summed definition, not the heterogeneity mechanism, is what drives the headline $\mathcal{R}_0$ values.
Extended reading notes
Core claim
The central claim is that within-patch heterogeneity is not a detail that averages out: for both endemic (SI) and epidemic (SIR) models with no transmission between patches, replacing a patch's risk distribution by its mean understates the patch-specific $\mathcal{R}_{0i}$ and hence the transmission coefficient needed to match observed infection levels. The paper defines patch-specific reproduction numbers as $\mathcal{R}_{0i} = \langle x \rangle_i \beta/(\gamma+\mu)$ when heterogeneity is in susceptibility and $\mathcal{R}_{0i} = \langle x^2 \rangle_i / \langle x \rangle_i \cdot \beta/(\gamma+\mu)$ when it is in connectivity, and uses the sum of these as the metapopulation $\mathcal{R}_0$. It then shows, through a two-patch/two-risk-class interpolation, that as risk classes are mixed more evenly across patches the inferred $\mathcal{R}_0$ and coefficient of variation rise, and a uniform 50% reduction in susceptibility appears less effective than the homogeneous-patch model suggested. The paper proposes this inverse scheme as a reductionist complement to holistic fits: observable stratifications such as deprivation can be inserted as patch compositions, and the remaining difference in the coefficient of variation indicates unmeasured individual variation.
Load-bearing premise
The load-bearing premise is that a single metapopulation $\mathcal{R}_0$, formed by combining patch-specific reproduction numbers, is what governs whether infection persists or spreads, even though there is no transmission between patches and the standard invasion threshold for independent patches is the largest patch-specific value rather than a sum or weighted average.
Editorial extensions
If this is right
- If the central claim is right, estimates of $\mathcal{R}_0$ obtained from homogeneous-patch metapopulation models are lower bounds, and control thresholds derived from them will understate the transmission strength that uniform measures must overcome.
- Uniform interventions that reduce susceptibility by a fixed factor will appear less powerful when in-patch heterogeneity is represented, because selective depletion has already removed the most exposed individuals before the intervention acts.
- Patch-stratified surveillance data—final sizes or endemic prevalences per patch plus an external stratification such as deprivation—can be used to infer a risk distribution and a corrected $\mathcal{R}_0$ without fitting full time series.
- The gap between the coefficient of variation estimated from a single observable stratification and that obtained from holistic fits provides a quantitative measure of how much individual variation remains unmeasured.
- The scheme suggests where to look for targeted interventions: patches or risk classes that contribute most to the inferred risk distribution.
Reading between the lines
- Beyond the paper: the paper's definition of metapopulation $\mathcal{R}_0$ as a sum of patch-specific values is not the standard invasion threshold for disconnected patches; under the usual next-generation (largest eigenvalue) definition, which for independent patches reduces to the maximum patch-specific $\mathcal{R}_{0i}$, the reported numbers would need to be recomputed and the qualitative bias
- Beyond the paper: the inverse problem has a one-dimensional family of solutions indexed by $q_A(x_2)$, so the inferred risk distribution is not uniquely identified by patch-level final sizes; adding more patches, more risk classes, or early-growth data would be needed to pin it down.
- Beyond the paper: a direct test of the mechanism would fit the same two-patch model to data before and during a uniform intervention; the heterogeneous model should require a larger transmission coefficient to match the pre-intervention data and should predict a smaller drop in prevalence under the intervention than the homogeneous model.
- Beyond the paper: if the standard maximum-patch threshold is adopted, the forward simulations with identical introductions in both patches remain valid per patch, but the 'metapopulation $\mathcal{R}_0$' label should be replaced by a pair of patch-level thresholds, which would sharpen the policy conclusion about which patch drives elimination.
Editorial analysis
A structured set of objections, weighed in public.
Referee Report
Summary. The paper studies SI and SIR epidemic models in a metapopulation of n patches, each containing discrete risk classes but with no transmission between patches. It argues that models that ignore within-patch heterogeneity underestimate the basic reproduction number R0 and the effort required to control or eliminate infection by uniform interventions. The authors propose an inverse scheme to infer risk distributions from patch-stratified prevalence or final-size data and illustrate it with COVID-19 data from Aberdeen and Dundee using the Scottish Index of Multiple Deprivation.
Significance. If the main claim were established, the paper would provide a tractable extension of earlier work on selective depletion and heterogeneous susceptibility/connectivity (Gomes et al.) to stratified populations, with a practical route for linking deprivation data to transmission models. The manuscript has clear strengths: the forward models are standard, the final-size equations in (13)--(15) are drawn from established theory and appear correct, the two-patch interpolation design is transparent, and the COVID-19 case study is presented with explicit acknowledgment of under-reporting and other limitations. The central quantitative claim is, however, currently undermined by the definition and use of the metapopulation R0, which is not the invasion threshold of the model.
major comments (3)
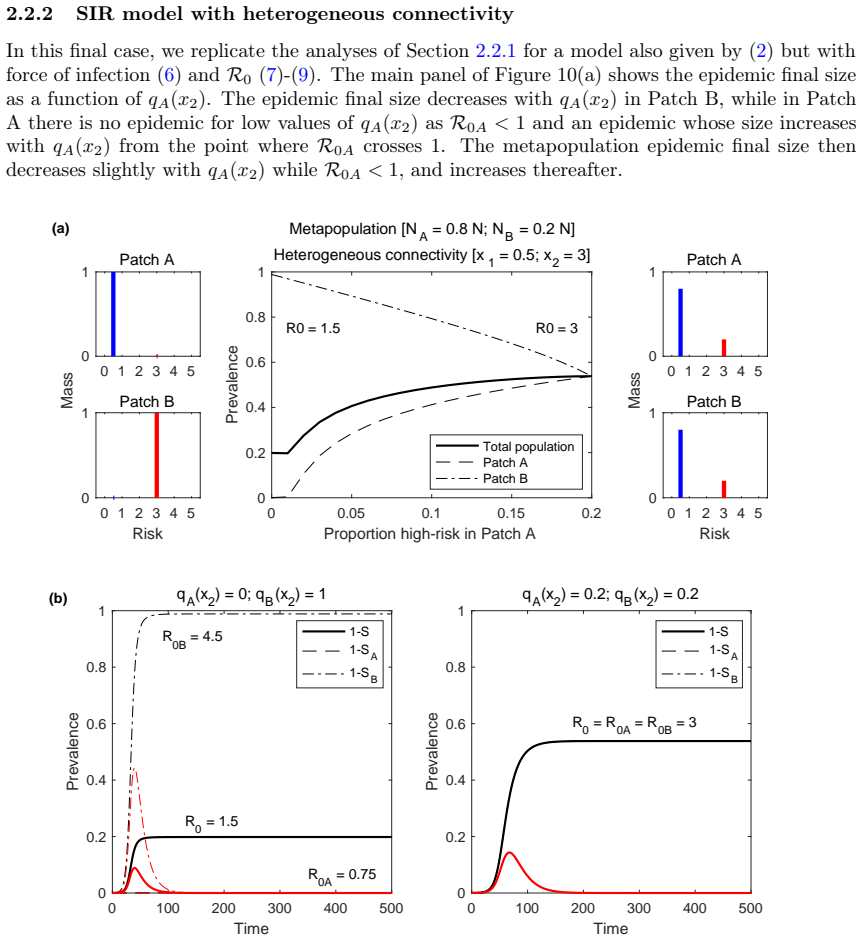
- [Section 2, Eq. (7) and Figs. 2, 5, 8, 10] Equation (7) defines the metapopulation R0 as the sum of patch-specific R0_i, but the figures use a population-weighted mean. In Fig. 2(b), for example, R0A=1.5 and R0B=9 with patch sizes N_A=0.8N and N_B=0.2N; the displayed value R0=3 equals 0.8*1.5+0.2*9, not the sum 10.5. More importantly, since there is no transmission between patches in system (2), the next-generation matrix is block diagonal and the invasion threshold is max_i R0_i, not the sum or a weighted average. A two-patch example with R0A=R0B=0.6 would give R0=1.2 under Eq. (7) although neither patch can sustain transmission. Thus the quantity reported as 'metapopulation R0' throughout the paper does not govern invasion or elimination.
- [Consequences for the central claim; Sections 2.1, 2.2, and 3] Because the paper's calibrations and inverse problems are built on Eqs. (7)--(9), the reported R0 values inherit the definitional problem. This includes the beta values chosen from R0=3 in Sections 2.1.1 and 2.2.1, the inferred R0 curves in Figs. 3, 6, 9, and 11, the 50%-intervention comparisons in Figs. 4, 7, S3, and S4, and the case-study R0=1.25 in Section 3. The abstract's claim that neglecting in-patch heterogeneity underestimates R0 and the effort required for uniform control is therefore not established by the numerical results as presented. The authors should either recompute all results with the standard threshold R0 = max_i R0_i, or explicitly state that their R0 is a non-threshold summary statistic and remove the control-elimination conclusions.
- [End of Section 2, after Eq. (9)] The statement that in the heterogeneous-susceptibility case 'R0 = <x> beta/(gamma+mu)' is not a consequence of Eq. (7) unless R0 is defined as the population-weighted average sum_i (N_i/N) R0_i. The manuscript should state the intended definition unambiguously and reconcile it with the threshold use of R0.
minor comments (5)
- [Throughout] There are several typographical errors, including 'Basedonhowtheyhandle' at the start of Section 1, 'respectivelly' in the Figure 1 caption, 'Compututational Biology' and 'Procedings' in the reference list, and 'quantity' for 'quantify' in the first paragraph of Section 3.
- [Sections 2.1.1 and 2.2.1] The assumed values IA=0.3, IB=0.5 and RA(infinity)=0.6, RB(infinity)=0.8 are arbitrary and the text says 'for concreteness'; this is acceptable for an illustration, but the wording 'infer R0' should make clearer that the systematic inverse-problem curves are conditional illustrations, not estimates from data.
- [Section 3 and Discussion] The case-study limitations are honestly acknowledged, but the phrase 'we obtain a metapopulation R0=1.25' should be accompanied by a reminder that this is derived under the authors' nonstandard R0 definition; under the standard threshold definition the same data would lead to a different value or require a different interpretation.
- [Throughout] The paper uses the term 'metapopulation' even though patches have no transmission between them and the model is a collection of independent epidemics sharing a parameter distribution; a brief justification or use of 'stratified population' would help avoid confusion with the usual coupled-patch metapopulation literature.
- [Reproducibility] The inverse-problem solutions rely on Matlab fsolve routines and several supplementary figures are referenced, but no code or data-availability statement is included; providing the routines or a repository would substantially strengthen the paper's reproducibility.
Circularity Check
No significant circularity; the inverse problems are explicitly conditional illustrations, and the R0-definition inconsistency is a correctness issue rather than a circular reduction.
full rationale
The forward analysis in Section 2 is self-contained: starting from system (2), the paper obtains endemic equilibria, growth curves, and final sizes (Eqs 13–15) from stated parameters and standard external results (Katriel 2012; Miller 2012; Miller et al. 2012), with no step assuming the target under-estimation claim. The backward analyses in Sections 2.1.1–2.2.2 take user-supplied prevalence or final sizes (e.g., IA=0.3, IB=0.5, RA(∞)=0.6, RB(∞)=0.8, explicitly chosen 'for concreteness') and solve for β and x2; the paper labels these as part of an inverse problem and presents the resulting R0 curves as a 1-dimensional array of conditional solutions, not as predictions validated against external data. The case study uses SIMD-derived patch risk proportions and reported cumulative case final sizes, then infers R0≈1.25; this is an illustrative estimate whose gap to Gomes et al. (2022) is explicitly attributed to omitted NPIs and under-reporting. Self-citations to Gomes et al. (2019, 2022, 2024) provide background and the selective-depletion mechanism, but the metapopulation equations and computations in this paper are derived in the manuscript itself, so the citations are not load-bearing. The main concern in the skeptic notes—that Eq. (7) defines metapopulation R0 as a sum while Fig. 2(b) labels a weighted mean (R0=3 with R0A=1.5, R0B=9), and that with no between-patch transmission the invasion threshold is max_i R0_i—is a consistency/correctness issue about what the reported quantity measures, not a circular derivation; the direction of the under-estimation claim is not built into Eq. (7) by construction. No circular step is identified.
Assumptions & free parameters
free parameters (4)
- beta (transmission coefficient) =
Derived from R0=3 in forward analyses; solved via fsolve in inverse problems and case study
- x2 (high-risk susceptibility/connectivity multiplier) =
Ranges from 1.2965 to 4.5618 in SI susceptibility inverse problem; 1.2389 in one SIR case-study scenario
- qA(x2) (proportion high-risk in Patch A) =
Varied 0 to 0.2 in toy analyses; 0.10 for Aberdeen in the case study
- Assumed IA=0.3, IB=0.5 (SI inverse) and RA(inf)=0.6, RB(inf)=0.8 (SIR inverse) =
Fixed by assumption in toy inverse problems
assumptions (5)
- ad hoc to paper The metapopulation basic reproduction number is the sum of patch-specific reproduction numbers (Eq 7) despite zero between-patch transmission.
- domain assumption Risk heterogeneity is captured by a discrete set of m risk classes with values x_j and a single global transmission coefficient beta.
- domain assumption Mean risk is normalized to 1 (Eq 3).
- standard math Final-size relations (13) and (14)-(15) from Katriel and Miller are valid for the SIR models.
- domain assumption In the case study, cumulative reported COVID-19 cases by 01 October 2023 equal epidemic final sizes, and SIMD deprivation deciles map onto the discrete risk classes.
Cite this review
Pith. "Pith review of A note on metapopulation models." pith.science (2026). https://pith.science/paper/GWNPFTVQ
@misc{pith2026250604284,
  author       = {Pith},
  title        = {Pith review of: A note on metapopulation models},
  year         = {2026},
  howpublished = {\url{https://pith.science/paper/GWNPFTVQ}},
  note         = {Machine review of arXiv:2506.04284}
}
abstract
Metapopulation models are commonly used in ecology, evolution, and epidemiology. These models usually entail homogeneity assumptions within patches and study networks of migration between patches to generate insights into conservation of species, differentiation of populations, and persistence of infectious diseases. Here, focusing on infectious disease epidemiology, we take a complementary approach and study the effects of individual variation within patches while neglecting any form of disease transmission between patches. Consistently with previous work on single populations, we show how metapopulation models that neglect in-patch heterogeneity also underestimate basic reproduction numbers ($\mathcal{R}_{0}$) and the effort required to control or eliminate infectious diseases by uniform interventions. We then go beyond this confirmatory result and introduce a scheme to infer distributions of individual susceptibility or exposure to infection based on suitable stratifications of a population into patches. We apply the resulting metapopulation models to a simple case study of the COVID-19 pandemic.
Figures


Figures from the paper (8 more)



Reference graph
Works this paper leans on
-
[1]
O. O. Aalen, M. Valberg, T. Grotmol, and S. Tretli. Understanding variation in disease risk: the elusive concept of frailty . International Journal of Epidemiology, 44 0 (4): 0 1408--1421, 2015. ISSN 0300-5771. doi:10.1093/ije/dyu192. URL https://academic.oup.com/ije/article-lookup/doi/10.1093/ije/dyu192
- [2]
-
[3]
R. M. Anderson and R. M. May. Infectious Diseases of Humans: Dynamics and Control . Oxford University Pres, 1991
work page 1991
-
[4]
F. Ball. Deterministic and stochastic epidemics with several kinds of susceptibles. Advances in applied probability, 17 0 (1): 0 1--22, 1985
work page 1985
-
[5]
F. Ball, T. Britton, T. House, V. Isham, D. Mollison, L. Pellis, and G. Scalia Tomba . Seven challenges for metapopulation models of epidemics, including households models . Epidemics, 10: 0 63--67, 2015. ISSN 17554365. doi:10.1016/j.epidem.2014.08.001. URL https://linkinghub.elsevier.com/retrieve/pii/S175543651400036X
-
[6]
S. Bansal, B. T. Grenfell, and L. A. Meyers. When individual behaviour matters: homogeneous and network models in epidemiology . Journal of The Royal Society Interface, 4 0 (16): 0 879--891, 2007. ISSN 1742-5689. doi:10.1098/rsif.2007.1100. URL http://www.royalsocietypublishing.org/doi/10.1098/rsif.2007.1100
- [7]
- [8]
Show all 51 references
-
[9]
Bootsma, K
M. Bootsma, K. M. D. Chan, O. Diekmann, and H. Inaba. The effect of host population heterogeneity on epidemic outbreaks. Mathematics in Applied Sciences and Engineering, 5 0 (1): 0 1--84, 2024
2024
-
[10]
Chinazzi, J
M. Chinazzi, J. T. Davis, M. Ajelli, C. Gioannini, M. Litvinova, S. Merler, A. P. y Piontti, K. Mu, L. Rossi, K. Sun, C. Viboud, X. Xiong, H. Yu, M. E. Halloran, I. M. Longini, and A. Vespignani. The effect of travel restrictions on the spread of the 2019 novel coronavirus (co...
2019
-
[11]
Colizza and A
V. Colizza and A. Vespignani. Epidemic modeling in metapopulation systems with heterogeneous coupling pattern: Theory and simulations . Journal of Theoretical Biology, 251 0 (3): 0 450--467, 2008. ISSN 0022-5193. doi:10.1016/J.JTBI.2007.11.028. URL https://www.sciencedirect.co...
2008 doi
-
[12]
R. M. Corder, M. U. Ferreira, and M. G. M. Gomes. Modelling the epidemiology of residual plasmodium vivax malaria in a heterogeneous host population: A case study in the amazon basin. PLoS Computational Biology, 16 0 (3): 0 e1007377, 2020
2020
-
[13]
P. C. Cross, J. O. Lloyd-Smith, P. L. F. Johnson, and W. M. Getz. Duelling timescales of host movement and disease recovery determine invasion of disease in structured populations. Ecology Letters, 8 0 (6): 0 587--595, 2005
2005
-
[14]
Eubank, H
S. Eubank, H. Guclu, V. S. Anil Kumar, M. V. Marathe, A. Srinivasan, Z. Toroczkai, and N. Wang. Modelling disease outbreaks in realistic urban social networks. Nature, 429 0 (6988): 0 180--184, 2004
2004
-
[15]
M. G. M. Gomes, J. F. Oliveira, A. Bertolde, D. Ayabina, T. A. Nguyen, E. L. Maciel, R. Duarte, B. H. Nguyen, P. B. Shete, and C. Lienhardt. Introducing risk inequality metrics in tuberculosis policy development. Nature Communications, 10 0 (1): 0 2480, 2019
2019
-
[16]
M. G. M. Gomes, M. U. Ferreira, R. M. Corder, J. G. King, C. Souto-Maior, C. Penha-Gon c alves, G. Gon c alves, M. Chikina, W. Pegden, and R. Aguas. Individual variation in susceptibility or exposure to sars-cov-2 lowers the herd immunity threshold. Journal of Theoretical Biol...
2022
-
[17]
M. G. M. Gomes, A. M. Blagborough, K. E. Langwig, and B. Ringwald. Remodelling selection to optimise disease forecasts and policies. Journal of Physics A: Mathematical and Theoretical, 57 0 (10): 0 103001, 2024
2024
-
[18]
Scottish index of multiple deprivation 2020
GOV. Scottish index of multiple deprivation 2020. https://www.gov.scot/collections/scottish-index-of-multiple-deprivation-2020/, 0 (Accessed on 2022-04-04), 2022
2020
-
[19]
Coronavirus (covid-19): data for scotland
GOV. Coronavirus (covid-19): data for scotland. https://www.gov.scot/publications/coronavirus-covid-19-daily-data-for-scotland/, 0 (Accessed on 2024-03-11), 2024
2024
-
[20]
R. F. Grais, J. Hugh Ellis , and G. E. Glass. Assessing the impact of airline travel on the geographic spread of pandemic influenza . European Journal of Epidemiology, 18 0 (11): 0 1065--1072, 2003. ISSN 03932990. doi:10.1023/A:1026140019146. URL http://link.springer.com/10.10...
2003 doi
-
[21]
M. E. Halloran, I. M. Longini, and C. J. Struchiner. Estimability and interpretation of vaccine efficacy using frailty mixing models. American Journal of Epidemiology, 144 0 (1): 0 83–97, 1996
1996
-
[22]
G. Hess. Disease in Metapopulation Models: Implications for Conservation . Ecology, 77 0 (5): 0 1617--1632, 1996. ISSN 00129658. doi:10.2307/2265556. URL http://doi.wiley.com/10.2307/2265556
1996 doi
-
[23]
Hougaard
P. Hougaard. Survival models for heterogeneous populations derived from stable distributions. Biometrika, 73 0 (2): 0 387--396, 1986. ISSN 00063444. URL http://www.jstor.org/stable/2336215
1986
-
[24]
G. Katriel. The size of epidemics in populations with heterogeneous susceptibility. Journal of Mathematical Biology, 65: 0 237–262, 2012
2012
-
[26]
M. J. Keeling, L. Danon, M. C. Vernon, and T. A. House. Individual identity and movement networks for disease metapopulations. Proceedings of the National Academy of Sciences, 107 0 (19): 0 8866--8870, 2010
2010
-
[27]
C. C. Kerr, R. M. Stuart, D. Mistry, R. G. Abeysuriya, K. Rosenfeld, G. R. Hart, R. C. Núñez, J. A. Cohen, P. Selvaraj, B. Hagedorn, L. George, M. Jastrzębski, A. S. Izzo, G. Fowler, A. Palmer, D. Delport, N. Scott, S. L. Kelly, C. S. Bennette, B. G. Wagner, S. T. Chang, A. P....
2021
-
[28]
R. Levins. Some Demographic and Genetic Consequences of Environmental Heterogeneity for Biological Control . Bulletin of the Entomological Society of America, 15 0 (3): 0 237--240, 1969. ISSN 0013-8754. doi:10.1093/besa/15.3.237. URL https://academic.oup.com/ae/article-lookup/...
1969 doi
-
[29]
A. L. Lloyd and R. M. May. Spatial Heterogeneity in Epidemic Models . Journal of Theoretical Biology, 179 0 (1): 0 1--11, 1996. ISSN 00225193. doi:10.1006/jtbi.1996.0042. URL http://www.ncbi.nlm.nih.gov/pubmed/8733427 http://linkinghub.elsevier.com/retrieve/pii/S0022519396900429
1996
-
[30]
R. M. May, R. M. Anderson, and M. E. Irwin. The transmission dynamics of human immunodeficiency virus (hiv) [and discussion]. Philosophical Transactions of the Royal Society of London. Series B, Biological Sciences, 321 0 (1207): 0 565--607, 1988. ISSN 00804622. URL http://www...
1988
-
[31]
Megiddo, A
I. Megiddo, A. R. Colson, A. Nandi, S. Chatterjee, S. Prinja, A. Khera, and R. Laxminarayan. Analysis of the universal immunization programme and introduction of a rotavirus vaccine in india with indiasim. Vaccine, 32: 0 A151--A161, 2014
2014
-
[32]
Meloni, N
S. Meloni, N. Perra, A. Arenas, S. G \' o mez, Y. Moreno, and A. Vespignani. Modeling human mobility responses to the large-scale spreading of infectious diseases . Scientific Reports, 1 0 (1): 0 62, 2011. ISSN 2045-2322. doi:10.1038/srep00062. URL http://www.nature.com/articl...
2011 doi
-
[33]
J. C. Miller. Epidemic size and probability in populations with heterogeneous infectivity and susceptibility. Phys. Rev. E, 76: 0 010101, Jul 2007. doi:10.1103/PhysRevE.76.010101. URL https://link.aps.org/doi/10.1103/PhysRevE.76.010101
2007 doi
-
[34]
J. C. Miller. A note on the derivation of epidemic final sizes. Bulletin of Mathematical Biology, 74 0 (9): 0 2125--2141, 2012
2012
-
[35]
J. C. Miller, A. C. Slim, and E. M. Volz. Edge-based compartmental modelling for infectious disease spread. Journal of the Royal Society Interface, 9: 0 890--906, 2012
2012
-
[36]
S. M. Moghadas, A. Shoukat, M. C. Fitzpatrick, C. R. Wells, P. Sah, A. Pandey, J. D. Sachs, Z. Wang, L. A. Meyers, B. H. Singer, and A. P. Galvani. Projecting hospital utilization during the covid-19 outbreaks in the united states. Procedings of the National Academy of Science...
2020
-
[37]
Moreno, R
Y. Moreno, R. Pastor-Satorras, and A. Vespignani. Epidemic outbreaks in complex heterogeneous networks. The European Physical Journal B - Condensed Matter and Complex Systems, 26 0 (4): 0 521--529, 2002
2002
-
[38]
A. S. Novozhilov. On the spread of epidemics in a closed heterogeneous population. Mathematical Biosciences, 215 0 (2): 0 177--185, 2008
2008
-
[39]
Panigutti, M
C. Panigutti, M. Tizzoni, P. Bajardi, Z. Smoreda, and V. Colizza. Assessing the use of mobile phone data to describe recurrent mobility patterns in spatial epidemic models . Royal Society Open Science, 4 0 (5): 0 160950, 2017. ISSN 2054-5703. doi:10.1098/rsos.160950. URL http:...
2017 doi
-
[40]
A. W. Park, S. Gubbins, and C. A. Gilligan. Extinction times for closed epidemics: the effects of host spatial structure . Ecology Letters, 5 0 (6): 0 747--755, 2002. ISSN 1461023X. doi:10.1046/j.1461-0248.2002.00378.x. URL http://doi.wiley.com/10.1046/j.1461-0248.2002.00378.x
2002
-
[41]
S. Ruan, W. Wang, and S. A. Levin. The effect of global travel on the spread of sars. Mathematical biosciences and engineering : MBE, 3 0 (1): 0 205--18, 2006. ISSN 1547-1063. URL http://www.ncbi.nlm.nih.gov/pubmed/20361819
2006
-
[42]
Rubrichi, Z
S. Rubrichi, Z. Smoreda, and M. Musolesi. A comparison of spatial-based targeted disease mitigation strategies using mobile phone data . EPJ Data Science, 7 0 (1): 0 17, 2018. ISSN 2193-1127. doi:10.1140/epjds/s13688-018-0145-9. URL https://epjdatascience.springeropen.com/arti...
2018 doi
-
[43]
H. Sevil. The impact of socio-economic deprivation and heterogeneous mixing on covid-19 epidemic dynamics in the uk. PhD Thesis, University of Strathclyde, 2025
2025
-
[44]
Singer and J
B. Singer and J. Heckman. A method for minimizing the impact of distributional assumptions in econometric models for duration data. Econometrics, 52 0 (2): 0 271--320, 1984
1984
-
[45]
Tizzoni, P
M. Tizzoni, P. Bajardi, A. Decuyper, G. Kon Kam King , C. M. Schneider, V. Blondel, Z. Smoreda, M. C. Gonz \' a lez, and V. Colizza. On the Use of Human Mobility Proxies for Modeling Epidemics . PLoS Computational Biology, 10 0 (7): 0 e1003716, 2014. ISSN 1553-7358. doi:10.137...
2014 doi
-
[46]
A. V. Tkachenko, S. Maslov, A. Elbanna, G. N. Wong, Z. J. Weiner, and N. Goldenfeld. Time-dependent heterogeneity leads to transient suppression of the covid-19 epidemic, not herd immunity. Proceedings of the National Academy of Sciences, 118 0 (17): 0 e2015972118, 2021
2021
-
[47]
J. W. Vaupel, K. G. Manton, and E. Stallard. The impact of heterogeneity in individual frailty on the dynamics of mortality. Demography, 16 0 (3): 0 439--454, 1979. ISSN 00703370, 15337790. URL http://www.jstor.org/stable/2061224
1979
-
[48]
A. Vazquez. Epidemic outbreaks on structured populations . Journal of Theoretical Biology, 245 0 (1): 0 125--129, 2007. ISSN 0022-5193. doi:10.1016/J.JTBI.2006.09.018. URL https://www.sciencedirect.com/science/article/pii/S0022519306004279
2007 doi
-
[49]
Wesolowski, N
A. Wesolowski, N. Eagle, A. J. Tatem, D. L. Smith, A. M. Noor, R. W. Snow, and C. O. Buckee. Quantifying the impact of human mobility on malaria. Science, 338 0 (6104): 0 267--270, 2012
2012
-
[50]
Willem, F
L. Willem, F. Verelst, J. Bilcke, N. Hens, and P. Beutels. Lessons from a decade of individual-based models for infectious disease transmission: a systematic review (2006-2015) . BMC Infectious Diseases, 17 0 (1): 0 612, 2017. ISSN 1471-2334. doi:10.1186/s12879-017-2699-8. URL...
2006 doi
-
[51]
J. T. Wu, K. Leung, and G. M. Leung. Nowcasting and forecasting the potential domestic and international spread of the 2019-ncov outbreak originating in wuhan, china: a modelling study. The Lancet, 395 0 (10225): 0 689--697, 2020
2019
-
[52]
Zachreson, S
C. Zachreson, S. Chang, N. Harding, and M. Prokopenko. The effects of local homogeneity assumptions in metapopulation models of infectious disease. Royal Society Open Science, 9 0 (7): 0 211919, 2022
2022
Reviewed August 7, 2026 · model on record in the stance chip above.
Discussion (0). Sign in to comment.