REVIEW 4 major objections 6 minor 49 references
Long Term Reverberation Mapping of Iron Coronal Lines in MKN 110
T0 review · 4 major / 6 minor · reviewed 2026-08-07 · deepseek-v4-flash
Pith's one-line read The iron coronal line [Fe VII] in MKN 110 lags the optical continuum by about 650 days, while [Fe X] does not, revealing a stratified coronal-line region.
desk verdict A careful 30-year coronal-line light curve for MKN 110 with a plausible but not overdetermined [Fe VII] lag; the stratification claim rests more on line widths than on the lag. read the letter →
The pith
A machine-rendered reading of the paper's core claim, the machinery that carries it, and where it could break.
The reading
What carries the argument
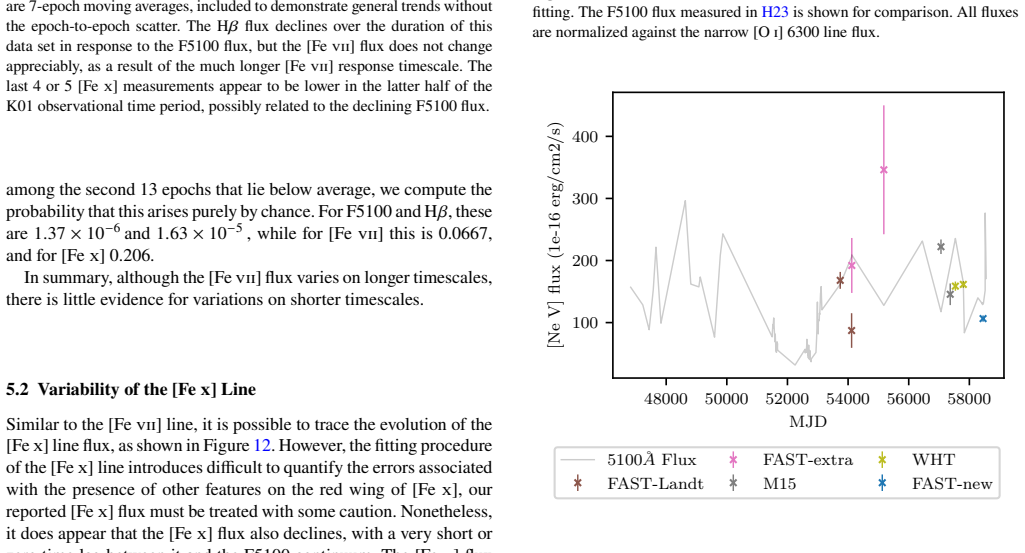
The argument is carried by two line light curves: the [Fe VII] 6087 Å and [Fe X] 6375 Å fluxes, measured from spectra spanning 1987-2019 and normalized to the narrow [O I] 6300 Å line to suppress cross-instrument calibration and aperture effects. The coronal lines are isolated by fitting a pseudo-continuum and Gaussian components, with the [Fe X] flux recovered by fixing the [O I] 6363 Å to [O I] 6300 Å flux ratio to its theoretical value of 0.323. The lag is quantified with two estimators, a Monte Carlo flux-randomization/random-subset cross-correlation and a damped random-walk time-series model, and the region sizes are connected to cloud densities through photoionization modelling that scans gas density at the lag-derived radii. The same machinery yields a responsivity plot from which a non-varying component and saturation of the [Fe VII] response are fitted.
What would settle it
A new, densely sampled spectroscopic campaign covering another large swing in MKN 110's continuum would settle it: if the [Fe VII] flux again reaches its minimum roughly 650 days after the continuum minimum while [Fe X] reaches its minimum earlier or simultaneously, the stratified picture is confirmed; if both lines respond with the same delay, or if the apparent lag disappears when a different narrow-line normalization is used, the claim fails.
Extended reading notes
Core claim
The central claim is that the coronal line region of MKN 110 is not a single zone but a stratified structure extending from roughly 100 light-days to beyond 10 pc. The evidence is the disparity between [Fe VII] and [Fe X]: the flux-randomization/random-subset cross-correlation gives a modal [Fe VII] lag of 652 days against the 5100 Å continuum (median 533 days, with +113/-133 day errors), while the [Fe X] lag is consistent with zero (modal -41 days, median -65 days with +138/-147 day errors), and the two lag distributions are inconsistent at 97.8 per cent confidence. The measured mean line widths also differ by more than a factor of two: 330 km/s for [Fe VII] versus 778 km/s for [Fe X]. The authors combine the lag distance of 652 light-days, a virial scaling of line widths, and photoionization modelling to argue that the bulk of [Fe VII] is emitted at parsec scales whereas [Fe X] is emitted closer in (about 116 light-days by the width scaling), and that a separate non-varying component of the [Fe VII] flux arises from a more extended region at or beyond 10 pc. On short timescales neither line responds to continuum changes, so the variability only shows up across the factor-of-three, decade-long decline in the continuum.
Load-bearing premise
The lag measurement assumes that the narrow [O I] 6300 Å line is a constant flux standard across 30 years and many different telescopes; if that line varies in time, or if the aperture used to observe it samples the spatially extended coronal lines differently from epoch to epoch, the normalized [Fe VII] and [Fe X] fluxes and their derived lags are systematically biased.
Editorial extensions
If this is right
- A sustained multi-year continuum swing is required to see coronal-line response; weekly or monthly monitoring alone will not detect it.
- The coronal line region of MKN 110 is stratified, with the higher-ionization [Fe X] gas located closer to the black hole than [Fe VII].
- A substantial part of the [Fe VII] flux does not respond to the continuum, so the emitting region extends beyond the 652-light-day lag radius, probably to 10 pc or more.
- Single-cloud photoionization models are insufficient; a range of gas densities and a radial density profile are required to reproduce [Fe VII] and [Fe X] simultaneously.
Reading between the lines
- If confirmed by a second continuum swing, the same archival stacking approach could be applied to other AGNs with multi-decade spectral archives, producing a sample of coronal-line lags that directly maps the radius-ionization relation of the CLR.
- The non-varying [Fe VII] component implies that low-density gas far outside the lag radius also contributes coronal-line flux; high-spatial-resolution observations of MKN 110 could test whether that extended emission is diffuse or clumpy.
- The disagreement between the two lag estimators (652 days versus 869 days) points to an intrinsically broad transfer function, so a velocity-resolved reverberation campaign with better spectral resolution could measure its shape directly.
Editorial analysis
A structured set of objections, weighed in public.
Referee Report
Summary. The paper compiles optical spectra of MKN 110 spanning three decades from eleven different instruments and measures the fluxes of the coronal lines [Fe VII] 6087 Å and [Fe X] 6375 Å, after subtraction of a pseudo-continuum and, for [Fe X], correction for blending with [O I] 6363. The authors find that [Fe VII] shows variability on multi-year timescales and detect a lag relative to the 5100 Å continuum with a modal value of 652 days from the FR/RSS method (median 533 +113/-133 days), while [Fe X] shows no significant lag. They also measure line widths, finding [Fe X] to be roughly twice as broad as [Fe VII], and they apply a simple emissivity-weighted response model to infer a non-varying component in the [Fe VII] flux. Combining the lag, the line widths, and photoionization models, they argue for a stratified coronal line region in which [Fe VII] arises predominantly at parsec scales and [Fe X] closer in, and they caution that single-cloud models are insufficient for describing the CLR.
Significance. If the reported lag is robust, this would be one of the first long-term reverberation measurements of optical coronal lines, providing a direct estimate of the CLR size and supporting the long-standing idea of stratification within the CLR. The paper is also valuable for its compilation of three decades of archival spectra and its careful, transparent treatment of line fitting and systematics. The authors explicitly acknowledge several sources of uncertainty (e.g., aperture effects, flux calibration, blending) and are appropriately cautious in places, which strengthens the credibility of the data presentation. However, the central claim rests on a fairly weak statistical detection and on a normalization assumption that is not fully validated, so the significance of the paper depends on whether those issues can be addressed.
major comments (4)
- [Section 5.1 and Table C1] The [Fe VII] light curve is normalized by dividing by the narrow [O I] 6300 Å flux under the assumption that this line is constant, but Table C1 shows that the measured [O I] flux varies by roughly a factor of two across the data set (e.g., 150.5 at MJD 49870, 305.0 at MJD 53043, and 95.2 at MJD 57834). Because the eleven observing runs have no temporal overlap, these variations cannot be separated into intrinsic [O I] variability, aperture differences, or calibration offsets, and dividing [Fe VII] by [O I] imprints all of them onto the coronal-line light curve. For example, the raw [Fe VII] flux at MJD 53043 is 28.5, comparable to many K01 values, yet its normalized value is approximately half of the K01 values because the [O I] flux at that epoch is an outlier at 305.0; the deep normalized [Fe VII] points in 2002–2005 (such as 15.3/206.5 = 0.074 at MJD 53108) are thus partly a consequence of the [O I] normalization rather than genuine coronal-line behavior. The 652-day lag and the stratification claim depend directly on this normalization. The authors should demonstrate robustness by redoing the lag analysis using an alternative reference line (e.g., [O III] 5007, which they note is stable to ~10%), by fitting for a floating instrumental offset per epoch, or by analyzing the raw fluxes with a hierarchical model that includes aperture and calibration terms.
- [Section 6.1] The statistical significance of the 652-day lag is modest: only 90.5% of the FR/RSS lag distribution lies at positive lags, and the modal lag (652 days) differs substantially from the median (533 +113/-133 days). The JAVELIN result gives a modal lag of 869 days, which the authors note is inconsistent with 652 days, and they dismiss JAVELIN because the continuum is not a damped random walk. However, the discrepancy between the two methods indicates that the lag estimate is sensitive to the assumed form of the transfer function and the stochastic model, especially given that the light curve contains only a single broad continuum dip and that the fitted non-varying component in Section 7 accounts for ~68% of the [Fe VII] flux. The paper should either provide a more conservative interpretation (e.g., a lag in the range ~500–900 days rather than a specific 652-day value) or perform additional tests, such as a time-series analysis without the modal-lag assumption, to establish that the lag is not driven by the normalization artifacts described above.
- [Sections 6.2 and 8] The claim of 'strong evidence for stratification' in the Abstract and Section 8 rests on two pieces of evidence: the difference between the [Fe VII] and [Fe X] lags (652 days versus consistent with zero, with the distributions stated to be inconsistent at 97.8% confidence) and the factor-of-two difference in line widths. However, the [Fe X] flux measurements are heavily affected by blending with [O I] 6363 and by the choice of pseudo-continuum, which the authors themselves state changes the measured fluxes by ~25% (Section 3.2). The [Fe X] line-width values in Table 3 also show large run-to-run scatter (586 to 979 km/s) and are only marginally resolved. The persuasive power of the line-width comparison is limited by these systematics, and the predicted [Fe X] distance of 116 days relies on an assumption of virial motion and on a particular black hole mass and inclination. Given the large and unquantified systematic errors in the [Fe X] measurements, the stratification conclusion should be framed as suggestive rather than strong; the paper would benefit from a quantitative error budget for the [Fe X] fluxes and lags, including the effect of the [O I] subtraction uncertainty.
- [Section 7 and Figure 17] The responsivity analysis uses the 652-day lag to align the [Fe VII] and continuum light curves and then interprets the resulting correlation as supporting the lag, but this is a circular consistency check rather than an independent confirmation. The caption of Figure 17 states that '704 days' corresponds to the modal FR/RSS lag, while the text and Table 5 use 652 days; this inconsistency must be corrected. In addition, the linear response fit in Table 5 gives a slope k = 0.122 ± 0.123, which is consistent with zero, so the evidence for a positive responsivity slope is weak without the saturation model; the large chi-square values (3607 for the linear model, 1834 with saturation) suggest that the model is missing significant scatter, and the improvement in chi-square is presented without a formal model comparison (e.g., an F-test or AIC) or a discussion of the number of free parameters. The non-varying component c = 0.682 ± 0.067 is a robust conclusion, but the claims about saturation and the slope less than unity should be toned down or supported by a proper statistical comparison.
minor comments (6)
- [Figure 17 caption] The caption says '704 days' but the text and Table 5 refer to the modal lag as 652 days; please correct this numerical inconsistency.
- [Section 3.2] The ratio [O I] 6363/6300 = 0.323 is quoted without a reference; please provide a citation for this value, as the ratio is used to subtract the blend.
- [Tables 2 and 3] The mean velocities quoted in Tables 2 and 3 (330 km/s for [Fe VII] and 778 km/s for [Fe X]) do not match the simple averages of the listed values (which are approximately 371 km/s for [Fe VII] and 801 km/s for [Fe X]); please clarify how the mean and the instrumental-broadening correction were computed, or correct the values.
- [Section 5.1] The text notes that the error bars in Figure 9 do not fully capture the variance due to differences in resolution and other systematics; please consider adding a quantitative estimate of the systematic uncertainty, for instance the ~10% scatter in [O III] 5007 that is mentioned in the text, to the light-curve plots or to the lag error analysis.
- [Section 6.1] The secondary peak at ~5000 days in the FR/RSS distribution is omitted; please specify its amplitude and provide a more explicit justification for the 2000-day cutoff, since the data set spans about 10,000 days.
- [Key words] The key word 'Transients' appears in the header but the paper is not about transients; consider replacing it with a more relevant term such as 'techniques: spectroscopic' or 'galaxies: Seyfert'.
Circularity Check
No significant circularity: the 652-day lag is measured by FR/RSS cross-correlation from observed light curves; later uses of the lag are explicitly illustrative consistency checks, not fitted inputs renamed as predictions.
full rationale
The central claim, a 652-day [Fe VII] lag, is derived directly from the observed [Fe VII] and F5100 light curves using the standard FR/RSS method (Section 6.1), with the lag as an output of the cross-correlation rather than an input. The [Fe X] lag is likewise measured independently (Section 6.2). The subsequent responsivity fit (Section 7) shifts F5100 by the already-measured 652-day lag and fits a linear/saturated model; this is a consistency check and characterization of the response, not a derivation of the lag. The Cloudy models in Section 8.2 place clouds at distances 'com[ing] from taking the lag distance of 652 light days' and the width-derived 116 light days, and the authors explicitly state 'these results are illustrative only, and are not proposed as actual predictions.' The stratification evidence rests on the measured lag distributions being inconsistent at 97.8% confidence and on measured line widths (Tables 2 and 3), which are independent of any model. The normalization against [O I] 6300 is an assumption that could introduce systematics, but it is not a circular reduction: no fitted parameter is renamed as a prediction, and no equation reduces to its inputs by construction. Minor self-citations exist (the H23 dataset, K01, and the Kollatschny 2003 mass estimate), but none is load-bearing for the lag measurement; the lag would stand or fall on the light curves regardless of those citations. JAVELIN gives a different lag (869 days), and the authors caution against it rather than forcing consistency. Therefore no significant circularity is present; the paper is largely self-contained against external benchmarks, with a score of 2 reflecting only minor non-load-bearing self-citations.
Assumptions & free parameters
free parameters (4)
- Responsivity slope k =
0.122 +/- 0.123 (linear); 0.783 +/- 0.092 (saturated)
- Non-varying component c =
0.682 +/- 0.067 (linear); 0.317 +/- 0.051 (saturated)
- Saturating ionizing flux x_sat =
0.840 +/- 0.067
- Cloud boundary fraction for matter-limited models =
0.1
assumptions (5)
- domain assumption The [O I] 6300 Å line flux is constant over the observing baseline and across apertures, so it can normalize all spectra.
- domain assumption The 5100 Å optical continuum is a faithful proxy for the EUV ionizing continuum that drives the coronal lines.
- domain assumption Line widths reflect virialized orbital motion, so v^2 is proportional to r^-1.
- domain assumption The [O I] 6363/6300 flux ratio is exactly 0.323 and any Si III 6371 contribution to the [Fe X] blend is small.
- domain assumption Cloudy photoionization models with the default AGN SED reproduce the relative line fluxes closely enough to infer densities.
Cite this review
Pith. "Pith review of Long Term Reverberation Mapping of Iron Coronal Lines in MKN 110." pith.science (2026). https://pith.science/paper/NKOTHEQS
@misc{pith2026250604337,
  author       = {Pith},
  title        = {Pith review of: Long Term Reverberation Mapping of Iron Coronal Lines in MKN 110},
  year         = {2026},
  howpublished = {\url{https://pith.science/paper/NKOTHEQS}},
  note         = {Machine review of arXiv:2506.04337}
}
read the original abstract
We present flux measurements of the coronal lines [Fe VII] and [Fe X] spanning three decades, in the highly variable Active Galactic Nucleus (AGN) MKN 110. These coronal lines are sensitive to the spectral energy distribution (SED) of AGNs in the extreme ultraviolet (EUV). Neither [Fe VII] nor [Fe X] demonstrates variability in the short term on a weekly or monthly timescale. However, by taking advantage of a long term decrease in the continuum flux of MKN 110 on the order of years, we were able to track the [Fe VII] and [Fe X] fluxes as they respond to the continuum. We were able to detect a lag for [Fe VII] relative to the continuum at 5100 {\AA}, with a modal lag of 652 days, but were unable to detect a significant lag in the [Fe x] flux, though there exist significant uncertainties in the [Fe X] fit. These two lag results are not consistent and the line widths for the two line species also do not match. This provides strong evidence for stratification within the coronal line region (CLR). There is also evidence of a non-varying component within the coronal line flux, probably a result of a more extended region of origin. Taken together, these results suggest a CLR where the bulk of the [Fe VII] originates on parsec scales, but a portion of the [Fe VII] flux originates further out, at or beyond a 10 pc scale. These results also indicate the limitations of single-cloud models in describing the physical conditions of the CLR.
Figures


Figures from the paper (10 more)




Reference graph
Works this paper leans on
-
[1]
P., R \'o \.z a \'n ska A., Czerny B., Hryniewicz K., Ferland G
Adhikari T. P., R \'o \.z a \'n ska A., Czerny B., Hryniewicz K., Ferland G. J., 2016, @doi [The Astrophysical Journal] 10.3847/0004-637X/831/1/68 , 831, 68
-
[2]
Afanasiev V. L., Popovi \'c L. C ., Shapovalova A. I., 2019, @doi [Monthly Notices of the Royal Astronomical Society] 10.1093/mnras/sty2995 , 482, 4985
-
[3]
J., 1991, Astronomy and Astrophysics, 250, 57
Appenzeller I., Wagner S. J., 1991, Astronomy and Astrophysics, 250, 57
work page 1991
-
[4]
Bischoff K., Kollatschny W., 1999, Astronomy and Astrophysics, 345, 49
work page 1999
-
[5]
Chatzikos M., et al., 2023, @doi [Revista Mexicana de Astronomia y Astrofisica] 10.22201/ia.01851101p.2023.59.02.12 , 59, 327
-
[6]
De Robertis M. M., Osterbrock D. E., 1984, @doi [The Astrophysical Journal] 10.1086/162585 , 286, 171
-
[7]
Erkens U., Appenzeller I., Wagner S., 1997, Astronomy and Astrophysics, 323, 707
work page 1997
-
[8]
Ferguson J. W., Korista K. T., Ferland G. J., 1997, @doi [The Astrophysical Journal Supplement Series] 10.1086/312998 , 110, 287
doi:10.1086/312998 1997
Show all 49 references
-
[9]
M., Mullaney J
Gelbord J. M., Mullaney J. R., Ward M. J., 2009, @doi [Monthly Notices of the Royal Astronomical Society] 10.1111/j.1365-2966.2009.14961.x , 397, 172
2009
-
[10]
C., Micheva G., Weilbacher P
Herenz E. C., Micheva G., Weilbacher P. M., Monreal-Ibero A., Hayes M., Anders F., Rivinius T., 2023, @doi [Research Notes of the American Astronomical Society] 10.3847/2515-5172/acd69e , 7, 99
2023 doi
-
[11]
Homan D., et al., 2023, @doi [Monthly Notices of the Royal Astronomical Society] 10.1093/mnras/stac3571 , 519, 1745
2023 doi
-
[12]
Kollatschny W., 2003, @doi [Astronomy and Astrophysics] 10.1051/0004-6361:20034611 , 412, L61
2003 doi
-
[13]
Kollatschny W., Bischoff K., 2002, @doi [Astronomy and Astrophysics] 10.1051/0004-6361:20020388 , 386, L19
2002 doi
-
[14]
L., Welsh W
Kollatschny W., Bischoff K., Robinson E. L., Welsh W. F., Hill G. J., 2001, @doi [Astronomy and Astrophysics] 10.1051/0004-6361:20011323 , 379, 125
2001 doi
-
[15]
Komossa S., et al., 2008, @doi [The Astrophysical Journal] 10.1086/588281 , 678, L13
2008 doi
-
[16]
J., Ferland G
Kynoch D., Landt H., Dehghanian M., Ward M. J., Ferland G. J., 2022, @doi [Monthly Notices of the Royal Astronomical Society] 10.1093/mnras/stac2443 , 516, 4397
2022 doi
-
[17]
Lamperti I., et al., 2017, @doi [Monthly Notices of the Royal Astronomical Society] 10.1093/mnras/stx055 , 467, 540
2017 doi
-
[18]
C., Ward M
Landt H., Bentz M. C., Ward M. J., Elvis M., Peterson B. M., Korista K. T., Karovska M., 2008, @doi [The Astrophysical Journal Supplement Series] 10.1086/522373 , 174, 282
2008 doi
-
[19]
J., Bentz M
Landt H., Elvis M., Ward M. J., Bentz M. C., Korista K. T., Karovska M., 2011, @doi [Monthly Notices of the Royal Astronomical Society] 10.1111/j.1365-2966.2011.18383.x , 414, 218
2011
-
[20]
J., Steenbrugge K
Landt H., Ward M. J., Steenbrugge K. C., Ferland G. J., 2015a, @doi [Monthly Notices of the Royal Astronomical Society] 10.1093/mnras/stv062 , 449, 3795
-
[21]
J., Steenbrugge K
Landt H., Ward M. J., Steenbrugge K. C., Ferland G. J., 2015b, @doi [Monthly Notices of the Royal Astronomical Society] 10.1093/mnras/stv2176 , 454, 3688
-
[22]
Lawrence A., 2012, @doi [Monthly Notices of the Royal Astronomical Society] 10.1111/j.1365-2966.2012.20889.x , 423, 451
2012
-
[23]
Mazzalay X., Rodr \'i guez-Ardila A., Komossa S., 2010, @doi [Monthly Notices of the Royal Astronomical Society] 10.1111/j.1365-2966.2010.16533.x , 405, 1315
2010
-
[24]
D., Satyapal S., Laor A., Abel N
McKaig J. D., Satyapal S., Laor A., Abel N. P., Doan S. M., Ricci C., Cann J. M., 2024, @doi [The Astrophysical Journal] 10.3847/1538-4357/ad7a7910.1134/S1063772908070020 , 976, 130
2024
-
[25]
Meyer-Hofmeister E., Meyer F., 2011, @doi [Astronomy and Astrophysics] 10.1051/0004-6361/201015478 , 527, A127
2011 doi
-
[26]
R., Ward M
Mullaney J. R., Ward M. J., Done C., Ferland G. J., Schurch N., 2009, @doi [Monthly Notices of the Royal Astronomical Society: Letters] 10.1111/j.1745-3933.2008.00599.x , 394, L16
2009
-
[27]
M \"u ller-S \'a nchez F., Hicks E. K. S., Malkan M., Davies R., Yu P. C., Shaver S., Davis B., 2018, @doi [The Astrophysical Journal] 10.3847/1538-4357/aab9ad , 858, 48
2018 doi
-
[28]
Murayama T., Taniguchi Y., 1998, @doi [The Astrophysical Journal] 10.1086/311264 , 497, L9
1998 doi
-
[29]
M., S \'a nchez F
Negus J., Comerford J. M., S \'a nchez F. M., Revalski M., Riffel R. A., Bundy K., Nevin R., Rembold S. B., 2023, @doi [The Astrophysical Journal] 10.3847/1538-4357/acb772 , 945, 127
2023 doi
-
[30]
B., Sargent W
Oke J. B., Sargent W. L. W., 1968, @doi [The Astrophysical Journal] 10.1086/149486 , 151, 807
1968 doi
-
[31]
Oliva E., Salvati M., Moorwood A. F. M., Marconi A., 1994, Astronomy and Astrophysics, 288, 457
1994
-
[32]
A., Ferrarese L., Merritt D., Peterson B
Onken C. A., Ferrarese L., Merritt D., Peterson B. M., Pogge R. W., Vestergaard M., Wandel A., 2004, @doi [The Astrophysical Journal] 10.1086/424655 , 615, 645
2004 doi
-
[33]
Onori F., et al., 2022, arXiv e-prints
2022
-
[34]
V., Fosbury R
Penston M. V., Fosbury R. A. E., Boksenberg A., Ward M. J., Wilson A. S., 1984, @doi [Monthly Notices of the Royal Astronomical Society] 10.1093/mnras/208.2.347 , 208, 347
1984 doi
-
[35]
Perez E., Robinson A., de La Fuente L., 1992, @doi [Monthly Notices of the Royal Astronomical Society] 10.1093/mnras/256.1.103 , 256, 103
1992 doi
-
[36]
M., Wanders I., Horne K., Collier S., Alexander T., Kaspi S., Maoz D., 1998, @doi [PASP] 10.1086/316177 , 110, 660
Peterson B. M., Wanders I., Horne K., Collier S., Alexander T., Kaspi S., Maoz D., 1998, @doi [PASP] 10.1086/316177 , 110, 660
1998 doi
-
[37]
M., et al., 2004, @doi [The Astrophysical Journal] 10.1086/423269 , 613, 682
Peterson B. M., et al., 2004, @doi [The Astrophysical Journal] 10.1086/423269 , 613, 682
2004 doi
-
[38]
O., Doan S
Reefe M., Satyapal S., Sexton R. O., Doan S. M., Secrest N. J., Cann J. M., 2022, @doi [The Astrophysical Journal] 10.3847/1538-4357/ac8981 , 936, 140
2022 doi
-
[39]
A., 2020, @doi [The Astrophysical Journal] 10.3847/2041-8213/ab901b , 895, L9
Rodr \'i guez-Ardila A., Fonseca-Faria M. A., 2020, @doi [The Astrophysical Journal] 10.3847/2041-8213/ab901b , 895, L9
2020 doi
-
[40]
M., 2004, @doi [Proceedings of the International Astronomical Union] 10.1017/S1743921304002273 , 222, 283
Rodr \'i guez-Ardila A., Prieto A., Viegas S. M., 2004, @doi [Proceedings of the International Astronomical Union] 10.1017/S1743921304002273 , 222, 283
2004 doi
-
[41]
A., Viegas S., Gruenwald R., 2006, @doi [The Astrophysical Journal] 10.1086/508864 , 653, 1098
Rodr \'i guez-Ardila A., Prieto M. A., Viegas S., Gruenwald R., 2006, @doi [The Astrophysical Journal] 10.1086/508864 , 653, 1098
2006 doi
-
[42]
A., Portilla J
Rodr \'i guez-Ardila A., Prieto M. A., Portilla J. G., Tejeiro J. M., 2011, @doi [The Astrophysical Journal] 10.1088/0004-637X/743/2/100 , 743, 100
2011 doi
-
[43]
N., 2015, @doi [Monthly Notices of the Royal Astronomical Society] 10.1093/mnras/stv113 , 448, 2900
Rose M., Elvis M., Tadhunter C. N., 2015, @doi [Monthly Notices of the Royal Astronomical Society] 10.1093/mnras/stv113 , 448, 2900
2015 doi
-
[44]
Short P., et al., 2023, @doi [Monthly Notices of the Royal Astronomical Society] 10.1093/mnras/stad2270 , 525, 1568
2023 doi
-
[45]
Veilleux S., 1988, @doi [The Astronomical Journal] 10.1086/114766 , 95, 1695
1988 doi
-
[46]
M., et al., 2021, @doi [Monthly Notices of the Royal Astronomical Society] 10.1093/mnras/stab1033 , 504, 4337
Vincentelli F. M., et al., 2021, @doi [Monthly Notices of the Royal Astronomical Society] 10.1093/mnras/stab1033 , 504, 4337
2021 doi
-
[47]
M., McHardy I., Hern \'a ndez Santisteban J
Vincentelli F. M., McHardy I., Hern \'a ndez Santisteban J. V., Cackett E. M., Gelbord J., Horne K., Miller J. A., Lobban A., 2022, @doi [Monthly Notices of the Royal Astronomical Society] 10.1093/mnrasl/slac009 , 512, L33
2022 doi
-
[48]
Webb W., Malkan M., 2000, @doi [The Astrophysical Journal] 10.1086/309341 , 540, 652
2000 doi
-
[49]
S., Peterson B
Zu Y., Kochanek C. S., Peterson B. M., 2011, @doi [The Astrophysical Journal] 10.1088/0004-637X/735/2/80 , 735, 80
2011 doi
Reviewed August 7, 2026 · model on record in the stance chip above.
Discussion (0). Sign in to comment.