REVIEW 4 major objections 5 minor 30 references
Cancer model with moving extinction threshold reproduces real cancer data
T0 review · 4 major / 5 minor · reviewed 2026-08-07 · deepseek-v4-flash
Pith's one-line read One simple model with a moving immune extinction threshold reproduces exponential and breast-cancer risk curves and predicts a cycle-length risk ratio close to observation.
desk verdict A genuinely novel modeling framework with a clean fix to Allee-type growth, but the breast-cancer story is oversold: the key immune-switch mechanism is fitted to the data and confounding explanations are left untested. read the letter →
The pith
A machine-rendered reading of the paper's core claim, the machinery that carries it, and where it could break.
The reading
What carries the argument
The load-bearing object is the moving extinction threshold, an Allee-type critical cluster size separating immune elimination from cancer establishment. In the model it is approximated by \(\bar{A}(t)\approx(s_m(t)-\overline{m}(t))/(\nu r-\mu(\nu+a\ln 10))\), where \(s_m(t)\) is the daily immune-elimination rate, \(\overline{m}(t)\) is the mean daily mutation count, and \(\nu,r,\mu\) are growth parameters. The threshold is what makes most mutated clusters die out and only threshold-crossing clusters become cancer; when \(s_m(t)\) varies with menstrual cycle phase and menopause, the threshold moves and changes the shape of the age-specific risk curve.
What would settle it
Measure age-specific cumulative breast cancer risk in a large cohort of women who never used HRT and were never screened: the model with distributed menopause but no HRT under-predicts risk after age 50, so if such a cohort still shows the same linear postmenopausal rise as the general population, the menopause/HRT switch cannot be the cause.
Extended reading notes
Core claim
The paper's central claim is that a single daily-update model, \(x(t+1)=x(t)+\nu r x(t)-\nu\mu x(t)^{(\nu+1)/\nu}-s_m(t)+m(t)\) clipped at zero, captures both carcinogenesis and tumour progression: \(m(t)\) is a binomially distributed number of new mutations whose per-cell probability rises linearly with age, and \(s_m(t)\) is the number of mutated cells the immune system removes each day. The immune term creates a critical cluster size, the extinction threshold \(A(t)\), below which the immune system eradicates the cluster and above which it grows into cancer. With a constant immune response the model produces the exponentially rising cumulative risk typical of most cancers and fits colorectal cancer data; with an immune response that weakens during the luteal phase of the menstrual cycle and returns to full strength after an effective menopause, it reproduces the polynomial-then-linear breast cancer risk curve once distributed menopause and HRT use are included. The same simulations fit breast cancer growth in two mouse datasets, reproduce a 1.75-fold relative risk for short versus longer cycles against the observed 1.86-fold value, and place most transitions to cancer in the luteal phase.
Load-bearing premise
The central explanation rests on the assumption that the postmenopausal flattening of breast cancer risk is caused by a switch in immune response at menopause; if the flattening instead comes from screening overdiagnosis, cohort changes, or another biological pathway, the breast-cancer explanation collapses even though the mathematics may remain consistent.
Editorial extensions
If this is right
- A constant immune response is sufficient to explain why most cancers show exponentially rising age-specific cumulative risk.
- The postmenopausal flattening of breast cancer risk can be explained dynamically by the end of cyclic progesterone-related immune weakening, without invoking separate biological mechanisms for young and old ages.
- Shorter menstrual cycles raise risk because more days are spent with a lowered extinction threshold; the model quantifies this as a 1.75-fold effect for 22–25 versus 25–31 day cycles.
- Most modelled transitions to breast cancer occur in the luteal phase (63–76%), consistent with progesterone as the main cycle-associated driver.
- The same moving-threshold mechanism can be applied to other cancers and to time-varying factors such as infections, immune deficiencies, and immunotherapy.
Reading between the lines
- Beyond the paper: if the extinction threshold is the true control point, strengthening immune clearance during the luteal phase should measurably shift the age of first threshold crossing in animal models.
- Beyond the paper: the rescue-event mechanism implies that temporary immunosuppression need not be fatal—a cluster can cross the threshold and fall back below it—so timing-based immune interventions may deserve study.
- Beyond the paper: the model offers a dynamical alternative to screening-artifact explanations of the postmenopausal breast cancer plateau; comparing never-screened, never-HRT cohorts with the model's predictions would separate the explanations.
Editorial analysis
A structured set of objections, weighed in public.
Referee Report
Summary. The paper proposes an ODE/stochastic model of carcinogenesis in which a cluster of mutated cells grows under a modified Richards' equation with an additional immune-elimination term (Eq. 5), random mutations are drawn from a binomial distribution whose mutation probability increases linearly with age (Eqs. 8-9), and a time-varying immune response s(t) produces a moving extinction threshold A(t) approximated by Eq. (11). The authors first show that the classical Volterra/Allee model (Model 1) cannot produce the growth-versus-saturation asymmetry typical of cancer, while their Model 2 can (Sec. 2.2, Supplement Prop. 1.1). They then fit Model 2 to two mouse breast-tumour data sets (Sec. 3.1), reproduce the exponential cumulative risk of colorectal cancer with a constant immune response (Fig. 6), and reproduce the polynomial-then-linear cumulative risk of breast cancer in Irish women by adding a menstrual-cycle immune switch, distributed menopause, and HRT-delayed menopause (Eq. 12, Fig. 7d). Finally, they report a model-predicted 1.75-fold increase in breast-cancer risk for 22-25-day cycles relative to 25-31-day cycles, compared with the 1.86-fold ratio observed by Yuan et al. 1988 (Sec. 3.2.3).
Significance. If established, the paper would make a useful contribution: a single process-based model with an extinction threshold generates several qualitatively different incidence patterns, and the moving-threshold concept is transferable to other time-varying immune contexts. The formal asymmetry result for Model 1 versus Model 2 is a clean and permanent mathematical contribution; the mice-data fits in Sec. 3.1 are genuine empirical tests with plausible estimated carrying capacities; and the colorectal exponential fit is a nontrivial qualitative success. The breast-cancer application, however, is at present an in-sample proof-of-concept rather than an established explanation: the key mechanism in Eq. (12) is not independently identified, the data are a single cross-section with known screening and cohort confounders, and the cycle-length and HRT 'predictions' are made with the same mechanism used to fit the curve. With a strengthened statistical and identifiability analysis, and with claims scaled to the evidence, this could become a solid paper.
major comments (4)
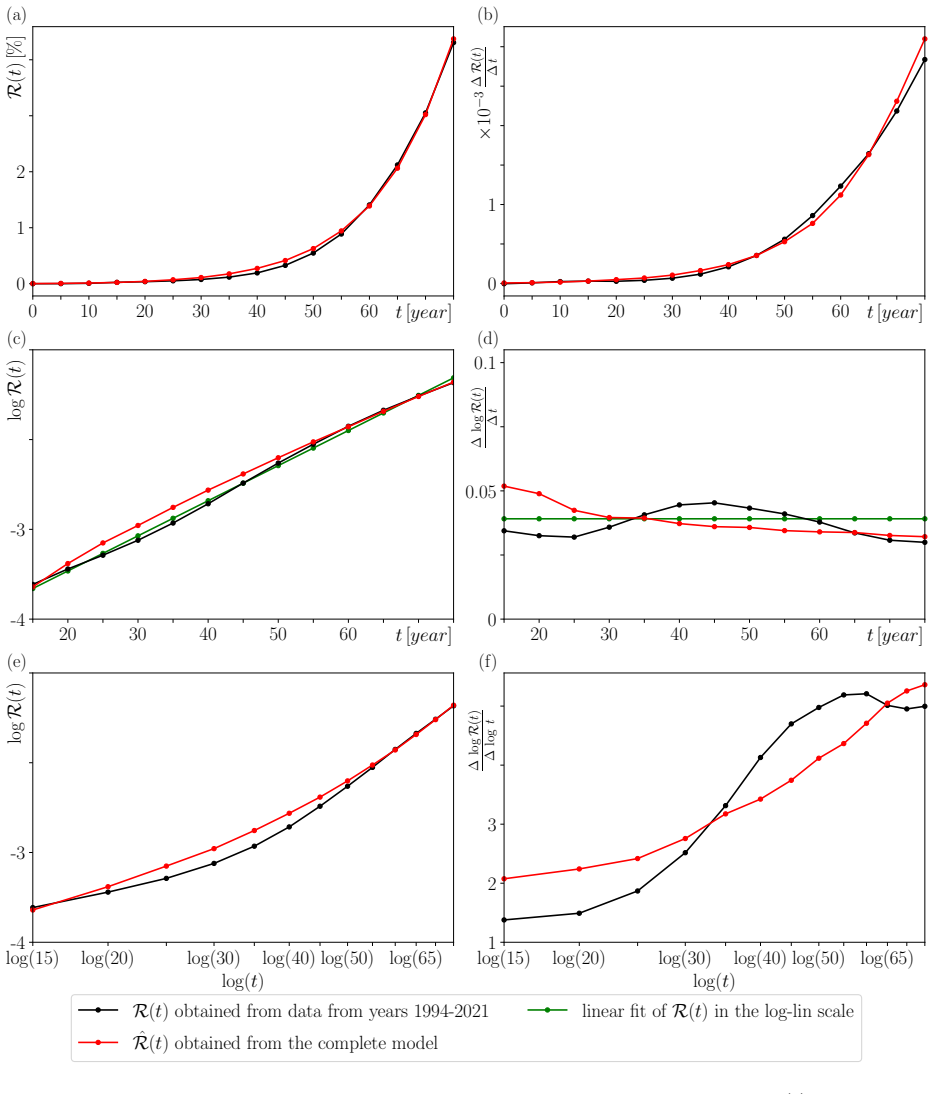
- [Abstract, §3.2, Tables 2-3, Fig. 7] The abstract and Conclusions claim that the model 'accurately reproduces' the breast-cancer cumulative risk and 'predicts' HRT and cycle-length effects, but every component of the breast-cancer fit is calibrated to the same 2016 Irish cumulative-risk curve: p0, pT, smin, and smax in Table 2, the menopause distribution, and the 26% HRT fraction and gamma-distribution parameters in Table 3 are all chosen so that Fig. 7(d) visually matches the black curve in Fig. 7. There is no holdout age band, no second population, no goodness-of-fit statistic, and no confidence interval on either R(t) or R-hat(t). With at least seven free parameters available for a 16-point curve, a visual match cannot support the strength of the reported claim. Please provide an out-of-sample check (for example, fit on ages 0-45 and predict the 50-85 age bands, or fit the NCRI 1994-2021 averaged data and predict the 2016 census-year curve) and quantify uncertainty with bootstrap or profile-likelihood methods.
- [§3.2.2, Eq. (12), Fig. 7] The post-menopausal flattening of the cumulative risk is produced by the discrete switch sm(t)=smax for t>M together with the HRT-delayed effective menopause M; without this switch (Cases 1 and 2 in Fig. 7b-c) the model under-predicts risk above age 50. This switch is not measured or independently estimated; it is supported only by qualitative progesterone-immunology citations and by the improved fit in Fig. 7(d). The observed polynomial-to-linear transition at ages 44-50 could instead arise from the organized biennial screening programme (overdiagnosis and lead-time), from birth-cohort differences in HRT use and reproductive history in the single-year 2016 cross-section, or from the proposed immune switch. Because the abstract claims 'new insights' into HRT, this identifiability problem is load-bearing. A concrete test would be to fit the model to screening-adjusted or age-period-cohort-decomposed incidence, or to a population with a different screening policy, and to compare the implied smin/smax switch with independent evidence on progesterone-related immune modulation in women.
- [§3.2.3 and Supplement §2.2.6] The 1.75-fold cycle-length ratio is not a free prediction: the menstrual-cycle mechanism in Eq. (12) is already the mechanism used to fit the overall breast-cancer curve in Fig. 7(d), so the cycle-length comparison in Fig. 9 is a consistency check of the same fitted mechanism rather than an independent test of the model. The quoted ratio also depends on modeling choices whose sensitivity is not reported: the lower bound of 22 days is set as approximately two standard deviations below the mean (Supplement §2.2.6), the luteal phase is fixed at 14 days, and the comparison target is a 1988 Shanghai study with a different birth cohort and screening context than the 2016 Irish data. Please report the ratio as a function of the chosen cycle-length bounds, give Monte Carlo uncertainty estimates for R-hat(51, tf), and state the population mismatch explicitly.
- [Supplement §3 and Table 3] The parameter values used in the complete model (Table 3) are obtained by fitting Model 2 to two measurements from a single untreated human breast cancer (Fornvik et al. 2016), with A and K fixed a priori. The uncertainties from this two-point boundary-value problem are not propagated into Fig. 7 or Fig. 9, and the text does not report how strongly the final breast-cancer curves depend on r, mu, s, and nu=10. Because these progression parameters are then held fixed while p0, pT, smin, and smax are tuned, the effective number of degrees of freedom in the breast-cancer fit is larger than a casual reading of Table 2 suggests. Please add a sensitivity analysis (for example, doubling or halving r, mu, and s and refitting the remaining parameters) or provide a joint uncertainty propagation.
minor comments (5)
- [Eq. (8)] The binomial distribution is printed as n!/(m!(n-m!)) in Eq. (8); the denominator should be m!(n-m)!.
- [Eqs. (7) and (11)] The variable a in A=10^a is used in Eqs. (7) and (11) but is not defined in the main text; please define it explicitly near the first occurrence.
- [Fig. 5 caption] The caption says 'black triangles in Fig. 5(a)' for Dataset 2, but Dataset 2 is plotted in Fig. 5(b).
- [Supplement §1.5.2] There is a duplicated article in the sentence 'falls again below the the (blue/red) moving extinction threshold'; please correct.
- [§3.2 and Supplement §4] The text describes the pre-menopausal breast-cancer curve as a '7th order polynomial', but the supporting analysis in Supplement Fig. 5 fits a power law R(t)=a t^b with b≈7; these are different functional forms, and the evidence for 'linear thereafter' is based on a cubic fit without tests of coefficient significance. Please clarify the terminology and report confidence intervals for the fitted exponents.
Circularity Check
No significant circularity: the breast-cancer curves are honest fits, and the 1.75-fold cycle-length prediction is an out-of-sample model output.
full rationale
The paper's derivation chain is not circular. The breast-cancer cumulative-risk curves in Fig. 7 are obtained by fitting the model parameters to the same NCRI incidence data; the Supplement (Table 2) explicitly states that the listed parameters were "obtained through fitting (red) Rhat(t) to (black) R(t)". The paper presents these as reproductions, not out-of-sample predictions, so there is no fitted-input-renamed-as-prediction at this step. The time-varying immune response in Eq. (12) is an input hypothesis supported by independent biological citations, not a quantity the model is claimed to derive from first principles; the polynomial-to-linear transition is an output of the assumed menopause switch, and the paper does not claim that the switch itself was predicted. The only explicit prediction, the 1.75-fold risk ratio for short cycles, is not a fitted parameter: all parameters were fixed by the Fig. 7(d) fit, and the ratio is obtained by varying follicular-phase length and comparing to an external observation [79] that was not used in the fit, so the prediction has independent content. Self-citations to [44] refer to the included supplementary material, which contains the technical proofs, parameter tables, and fitting details; these are checkable within the submission and do not constitute an unverified external authority. Limitations such as single-year 2016 Irish breast-cancer data, screening/cohort confounders, and the two-point human breast-growth fit (Supplement Sec. 3) are validity concerns, not circularity, and are outside the scope of this pass.
Assumptions & free parameters
free parameters (8)
- p0 =
2.7394e-5 to 2.7399e-5 (per dataset)
- pT =
2.7408e-5
- smin =
274203 to 274295 cells/day
- smax =
274250 to 274300.9 cells/day
- r, mu, s (growth and immune removal) =
r=2.7878e-3/day, mu=1.5708e-4, s=239.32 cells/day (human full model); different fitted values for mice (Table 1)
- nu (shape parameter) =
10 (full model); 1 or 97196 for mice fits
- n (stem cell count) =
1e10 cells
- xd (detection threshold) =
3.05e9 cells (breast), 4.2e9 (colorectal)
assumptions (6)
- domain assumption Stem cell mutations are independent Bernoulli trials, and the daily number of mutations follows a binomial distribution with n=10^10 cells and probability p(t) that increases linearly with age (Eqs. 8-9).
- domain assumption The immune system is represented solely by a daily removal rate s(t) of mutated cells, which sets an extinction threshold A(t) as in Model 2 (Eq. 5).
- ad hoc to paper Progesterone during the luteal phase weakens the immune response, so sm(t) drops from smax to smin in luteal phases; this is the dominant mechanism for breast cancer risk (Eq. 12).
- domain assumption Population parameters for menopause (mean 51, sd 4.86) and HRT (26% use; gamma duration with mode 6 years, sd 4.8 years) apply to the 2016 Irish female cohort.
- ad hoc to paper The moving extinction threshold is well approximated by A-bar(t) = (sm(t) - m-bar(t)) / (nu*r - mu*(nu + a ln 10)) in Eq. (11), including for nu=10 used in simulations.
- standard math The incidence rate is constant within 5-year age bands when converting registry data to cumulative risk R(t) (Supplement 2.2.1).
invented entities (1)
-
Moving extinction threshold A(t)
independent evidence
Cite this review
Pith. "Pith review of Cancer model with moving extinction threshold reproduces real cancer data." pith.science (2026). https://pith.science/paper/7RUXZNYK
@misc{pith2026250605992,
  author       = {Pith},
  title        = {Pith review of: Cancer model with moving extinction threshold reproduces real cancer data},
  year         = {2026},
  howpublished = {\url{https://pith.science/paper/7RUXZNYK}},
  note         = {Machine review of arXiv:2506.05992}
}
read the original abstract
We propose a simple dynamic model of cancer development that captures carcinogenesis and subsequent cancer progression. A central idea of the model is to include the immune system as an extinction threshold, similar to the strong Allee effect in population biology. We first identify the limitations of commonly used Allee effect models in reproducing typical cancer progression. We then address these limitations by deriving a new model that incorporates: (i) random mutations of stem cells at a rate that increases with age and (ii) immune response whose strength may also vary over time. Our model accurately reproduces a wide range of real-world cancer data: the typical age-specific cumulative risk of most human cancers, the progression of breast cancer in mice, and the unusual age-specific cumulative risk of breast cancer in women. In the last case, we use a moving extinction threshold to reflect the different immune response at different phases of the menstrual cycle and menopausal treatment. This provides new insights into the effects of hormone replacement therapy and menstrual cycle length. This moving threshold approach can be applied to a variety of other cancer scenarios where the immune response or other important factors may vary over time.
Figures


Figures from the paper (14 more)




Reference graph
Works this paper leans on
-
[1]
Vito Volterra. Population growth, equilibria, and extin ction under specified breeding conditions: a development and extension of the theory of the logistic curve. Human Biology, 10(1):1–11, 1938
work page 1938
-
[2]
A gompertz population model with allee effect and fuzzy initia l values
Zenia Amarti, Nenden Siti Nurkholipah, Nursanti Anggriani, a nd Asep K Supriatna. A gompertz population model with allee effect and fuzzy initia l values. In AIP Conference Proceedings, volume 1937, page 020002. AIP Publishing LLC, 2018
work page 1937
-
[3]
Cancer model with moving extinction thre shold reproduces breast cancer data, 2024
Frank Bastian, Hassan Alkhayuon, Kieran Mulchrone, Miche al O’Riordain, and Se- bastian Wieczorek. Cancer model with moving extinction thre shold reproduces breast cancer data, 2024
work page 2024
-
[4]
Trevor Hastie, Robert Tibshirani, Jerome H Friedman, and Jerome H Friedman.The ele- ments of statistical learning: data mining, inference, and prediction , volume 2. Springer, 2009
work page 2009
-
[5]
Does the cell number 109 still really fit one g ram of tumor tissue? Cell Cycle, 8(3):505–506, 2009
Ugo Del Monte. Does the cell number 109 still really fit one g ram of tumor tissue? Cell Cycle, 8(3):505–506, 2009. PMID: 19176997
work page 2009
-
[6]
Mochel, Michalis Mastri, Clair Poignard, John M
Cristina Vaghi, Anne Rodallec, Rapha¨ elle Fanciullino, Joseph Ciccolini, Jonathan P. Mochel, Michalis Mastri, Clair Poignard, John M. L. Ebos, and S´ ebastien Benzekry. Population modeling of tumor growth curves and the reduced g ompertz model improve prediction of the age of experimental tumors. PLOS Computational Biology, 16(2):1–24, 02 2020
work page 2020
-
[7]
Laura Cabeza, Ra´ ul Ortiz, Jos´ e L Arias, Jose Prados, MariaAdolfina Ruiz Mart´ ınez, Jos´ e M Entrena, Raquel Luque, and Consolaci´ on Melguizo. Enhanced antitumor ac- tivity of doxorubicin in breast cancer through the use of pol y (butylcyanoacrylate) nanoparticles. International journal of nanomedicine , 10:1291, 2015
work page 2015
-
[8]
Matt Newville, Renee Otten, Andrew Nelson, Till Stensitzk i, Antonino Ingargiola, Dan Allan, Austin Fox, Faustin Carter, Micha/suppress l, Ray Osborn, Dima Pustakhod, lneuhaus, Sebastian Weigand, Andrey Aristov, Glenn, Christoph Deil, mg unyho, Mark, Allan L. R. Hansen, Gustavo Pasquevich, Leon Foks, Nicholas Zobrist, Oliver Frost, Stuermer, azelcer, Anth...
work page 2023
Show all 30 references
-
[9]
Armitage and R
P. Armitage and R. Doll. The age distribution of cancer and a multi-stage theory of carcinogenesis. British Journal of Cancer , 91(12):1983–1989, 12 2004
1983
-
[10]
The hazard rate: theory and inference
Horst Rinne. The hazard rate: theory and inference. Justus-Liebig-Universit¨ at Giessen: Giessen, Germany , pages 149–151, 2014
2014
-
[11]
https://www .ncri.ie/data/incidence-statistics
National cancer registry ireland (ncri). https://www .ncri.ie/data/incidence-statistics
-
[12]
PyTorch 2: Faster Machine Learning Through Dynamic Python Bytecode Transformation and Graph Compilation
Jason Ansel, Edward Yang, Horace He, Natalia Gimelshein, Animesh Jain, Michael Voz- nesensky, Bin Bao, Peter Bell, David Berard, Evgeni Burovsk i, Geeta Chauhan, Anjali Chourdia, Will Constable, Alban Desmaison, Zachary DeVito, El ias Ellison, Will Feng, Jiong Gong, Michael Gs...
2024
-
[13]
Numba: a llvm-based python jit compiler
Siu Kwan Lam, Antoine Pitrou, and Stanley Seibert. Numba: a llvm-based python jit compiler. In Proceedings of the Second Workshop on the LL VM Compiler Infrastructure in HPC, LLVM ’15, New York, NY, USA, 2015. Association for Computing Machi nery
2015
-
[14]
Sarah E. H. Moorman, Akshat C. Pujara, Michelle D. Sakala, Colleen H. Neal, Kather- ine E. Maturen, Leigh Swartz, Heidi Egloff, and Mark A. Helvie. Annual screening mam- mography associated with lower stage breast cancer compare d with biennial screening. American Journal of Ro...
2021
-
[15]
Health service executive (hse)
-
[16]
Uk key performance indicators and quality assurance standards for colonoscopy
Colin J Rees, Siwan Thomas Gibson, Matt D Rutter, Phil Baragwanath, Rupert Pullan, Mark Feeney, and Neil Haslam. Uk key performance indicators and quality assurance standards for colonoscopy. Gut, 65(12):1923–1929, 2016
1923
-
[17]
Connelly, Marcie Richardson, and Richard Pl att
Maureen T. Connelly, Marcie Richardson, and Richard Pl att. Prevalence and duration of postmenopausal hormone replacement therapy use in a manag ed care organization, 1990–1995. Journal of General Internal Medicine , 15(8):542–550, 8 2000
1990
-
[18]
The effect of hormone replacement therapy on the survival of uk wo men: a retrospective cohort study 1984- 2017
Nurunnahar Akter, Elena Kulinskaya, Nicholas Steel, and Ilyas Bakbergenuly. The effect of hormone replacement therapy on the survival of uk wo men: a retrospective cohort study 1984- 2017. BJOG: An International Journal of Obstetrics & Gynaecology , 129(6):994–1003, 2022
1984
-
[19]
Yu, Ronald K
Jian-Min Yuan, Mimi C. Yu, Ronald K. Ross, Yu-Tang Gao, an d Brian E. Henderson. Risk Factors for Breast Cancer in Chinese Women in Shanghai1 . Cancer Research, 48(7):1949–1953, 04 1988
1949
-
[20]
F¨ ornvik, K
D. F¨ ornvik, K. L˚ ang, I. Andersson, M. Dustler, S. Borgquist, and P. Timberg. ES- TIMATES OF BREAST CANCER GROWTH RATE FROM MAMMOGRAMS AND ITS RELATION TO TUMOUR CHARACTERISTICS. Radiation Protection Dosime- try, 169(1-4):151–157, 06 2016
2016
-
[21]
A Gompertzian Model of Human Breast Cancer G rowth
Larry Norton. A Gompertzian Model of Human Breast Cancer G rowth. Cancer Re- search, 48(24 Part 1):7067–7071, 12 1988
1988
-
[22]
Nath, Anjaline Jayapraba A, and K Indhumathi
Srigitha S. Nath, Anjaline Jayapraba A, and K Indhumathi. De tection of breast cancer using imaging sensor and mammogram - a review. In 2022 8th International Conference on Smart Structures and Systems (ICSSS) , pages 1–8, 2022
2022
-
[23]
Survival of pa tients with untreated breast cancer
P A Johnstone, M S Norton, and R H Riffenburgh. Survival of pa tients with untreated breast cancer. J Surg Oncol , 73(4):273–277, 4 2000
2000
-
[24]
Adams, Heinrich Jasper, and K
Peter D. Adams, Heinrich Jasper, and K. Lenhard Rudolph. Agi ng-induced stem cell mutations as drivers for disease and cancer. Cell Stem Cell , 16(6):601–612, 2015. 22
2015
-
[25]
Methylation-Based Biological Age and Breas t Cancer Risk
Jacob K Kresovich, Zongli Xu, Katie M O’Brien, Clarice R We inberg, Dale P Sandler, and Jack A Taylor. Methylation-Based Biological Age and Breas t Cancer Risk. JNCI: Journal of the National Cancer Institute , 111(10):1051–1058, 02 2019
2019
-
[26]
Manecksha and John M
Rustom P. Manecksha and John M. Fitzpatrick. Epidemiology of testicular cancer. BJU International, 104(9b):1329–1333, 2009
2009
-
[27]
Cole, Donald G
Laurence A. Cole, Donald G. Ladner, and Francis W. Byrn. Th e normal variabilities of the menstrual cycle. Fertility and Sterility , 91(2):522–527, 2009
2009
-
[28]
Physi- ology, menarche
Amy E Lacroix, Hurria Gondal, Karlie R Shumway, and Miche lle D Langaker. Physi- ology, menarche. In StatPearls [Internet]. StatPearls Publishing, 2022
2022
-
[29]
Hormonal changes during menopause
Farook Al-Azzawi and Santiago Palacios. Hormonal changes during menopause. Matu- ritas, 63(2):135–137, 2009. Female sexual dysfunctions in the offi ce
2009
-
[30]
Pokoradi, Lisa Iversen, and Philip C
Alida J. Pokoradi, Lisa Iversen, and Philip C. Hannaford. Factors associated with age of onset and type of menopause in a cohort of uk women. American Journal of Obstetrics and Gynecology, 205(1):34.e1–34.e13, 2011. 23
2011
Reviewed August 7, 2026 · model on record in the stance chip above.
Discussion (0). Continue with ORCID to comment.