REVIEW 4 major objections 6 minor 22 references
Spatial Process Mining
T0 review · 4 major / 6 minor · reviewed 2026-08-07 · deepseek-v4-flash
Pith's one-line read Ranking event nodes finds factory trouble spots without experts
desk verdict A genuinely new pipeline idea—camera-generated event logs plus HITS-style ranking for deviation focus—but the ranking algorithm is a self-cited black box and the validation is three event logs with no statistics. read the letter →
The pith
A machine-rendered reading of the paper's core claim, the machinery that carries it, and where it could break.
The reading
What carries the argument
The load-bearing object is the event node ranking algorithm, a gradient-descent-style iteration on the symmetric matrix A[i] = L[i]^T L[i] (with the hub version on H[i] = L[i] L[i]^T). The authors define it as a modification of HITS that needs no L2 normalization and no teleportation hyperparameter, with convergence and exact step size claimed to follow from theorem 5 of their companion preprint. Around it, the event-detection pipeline converts bounding-box overlap between detected workers or AGVs and predefined work areas into event logs; a directly-follows graph mined from those logs supplies the link matrix L. This machinery does the work of turning camera pixels into ranked nodes whose spread can flag an unusual cycle.
What would settle it
Run the proposed gradient iteration on the paper's own 3-node and 4-node examples (L0 and L1) and verify it reproduces the tabulated rankings and solves the stated eigenproblem; then plant a synthetic deviation into a known process network and check whether the spread of top-ranked authority and hub values grows only when the planted deviation is present. If the iteration fails on L0 or L1, or the spread does not track the planted deviation, the central claim is falsified.
Extended reading notes
Core claim
In the paper's own terms, the discovery is that the distribution of event-node rankings, computed from the authority matrix A = L^T L and hub matrix H = L L^T of a weighted process network, carries diagnostic information: a cycle that runs longer than usual (CT(EL3) = 10 m 38 s versus about 8.5 min for usual cycles) shows a visibly wider spread in the ranking values, and the nodes that drop out of the top ten common to two usual cycles point at the activities that changed. The authors state that the variation of the ranking distribution expresses 'the degree of anxiety of the process,' and that watching the upper layers of authority and hub rankings for each cycle lets one notice which nodes to focus on without special knowledge. This is offered as a practical route from raw camera images to a focused KAIZEN action.
Load-bearing premise
The ranking values that drive the anomaly claim are supported by a theorem asserted to live in the authors' own companion preprint [19]; if that theorem is wrong, inapplicable to the MDFM link matrices, or not equivalent to the no-hyperparameter iteration, the ranking spread in Tables 4 and 5 has no stated foundation.
Editorial extensions
If this is right
- A plant operator who can read the top ten authority and hub nodes per cycle can, in principle, be pointed to the deviating locations without a process-mining specialist.
- Cycle-to-cycle comparison of ranking distributions gives a scalar 'anxiety' signal that can be tracked over time as an early-warning metric.
- The same camera-plus-overlap event detection can be applied to other spatially organized workplaces, since it only requires predefined areas and detected objects.
- Because the ranking method claims to avoid the teleportation hyperparameter, it could be used on dense process networks where classical HITS and PageRank require tuning.
- The Gantt chart output gives experienced workers a quantitative view of event starts that can be checked against standard work procedures.
Reading between the lines
- Beyond the paper, the 'degree of anxiety' concept could be operationalized as a formal deviation score, such as the statistical spread or entropy of the top-k ranking values, and calibrated against cycle time or defect rates in other factories.
- A testable extension is to apply the ranking to object-centric event logs with multiple interacting entities, where the separation of authority and hub roles might localize not just which location deviates but whether the cause is a supply-side or demand-side disruption.
- The method's dependence on the companion theorem could be stress-tested by running the gradient iteration on synthetic weighted networks with known spectra and checking that the returned top eigenvector matches the computed dominant eigenvector.
- Since the event-detection thresholds (3-second overlap, 10% box overlap) were chosen heuristically, one could measure how sensitive the ranking spread is to those thresholds; if small threshold changes flip the anomaly signal, threshold tuning becomes part of the method.
Editorial analysis
A structured set of objections, weighed in public.
Referee Report
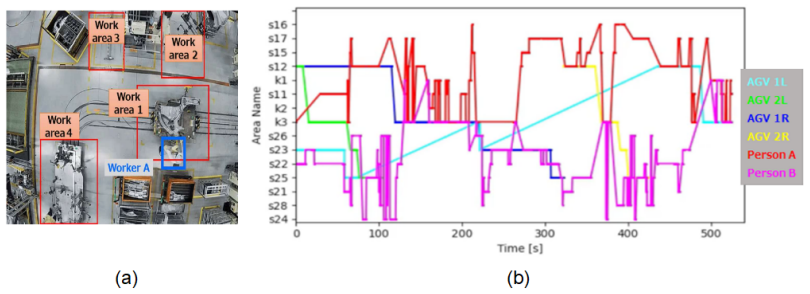
Summary. This paper proposes "Spatial Process Mining", a framework that generates event logs by ceiling-camera object detection in a cell production system, partitions physical space into locations, builds directly-follows process networks, and analyzes them with a proposed hyperparameter-free HITS-like ranking method. The authors present a Gantt-chart visualization and a case study of three production cycles (two usual, one unusual by cycle time), claiming that the distribution of authority/hub ranking scores identifies anomalous nodes without expert knowledge. The main technical method is stated to be a gradient dynamical-system algorithm based on Theorem 5 of the authors' preprint [19], but the algorithm and theorem are not specified in this paper.
Significance. If fully substantiated, the framework would be a useful low-cost approach to process mining in physical settings: active sensing with off-the-shelf object detection, clear event-log generation, and hyperparameter-free node ranking. The case study includes real factory data and reports 83.1% event-detection precision, which is a strength. However, the contribution's central ranking algorithm is outsourced to a self-citation, and the validation is based on only three cycles with no statistical analysis. Therefore the current version does not yet establish the central claims; the significance is conditional on making the algorithm and its convergence theorem checkable and on stronger validation.
major comments (4)
- [Section 4 (paragraph introducing 'Our proposed method')] The ranking algorithm that produces Tables 4 and 5 is never specified. The text states that the method is "a gradient algorithm for a symmetric matrix A[i] = A[i](1) = L[i]^T L[i]" and that convergence and exact step size follow from "theorem 5 given in [19]", but neither the theorem, the differential equation, the discretization, the step-size rule, nor the initialization are given. Moreover, L[i] is not formally defined for the MDFM process network (the node set, edge weights, and orientation are not specified). As a consequence, the ranking values in Tables 4 and 5 cannot be independently computed or checked, and the central empirical claim of the paper is not verifiable.
- [Section 4 and Reference [19]] No argument is made that the matrices arising from the case study satisfy the assumptions of Theorem 5 of [19]. The title of [19] restricts the result to matrices with positive eigenvalues, while L[i]^T L[i] is positive semidefinite and is singular whenever an activity has no incoming or outgoing edges, which is typical for the start and end of a directly-follows process. The paper should state Theorem 5 and prove or explicitly verify its hypotheses for the MDFM matrices A_i and H_i; otherwise the convergence of the gradient algorithm to the reported eigenvectors is unsupported.
- [Section 6] The interpretation in Section 6 that the larger spread of the EL3 ranking distribution expresses "the degree of anxiety of the process" is not supported by any quantitative test. The evidence consists of three cycles (two usual, one unusual), top-10 overlap counts, and a visual comparison of ranking values. No measure of distribution spread, no confidence interval, and no null model are given, so the difference between EL3 and EL1/EL2 could be sampling or algorithmic noise. The term "degree of anxiety" is not defined operationally, which makes the claim unfalsifiable as stated.
- [Section 4 versus Section 6] There is an apparent contradiction about normalization. Section 4 says the proposed method "does not require L2 normalization", but Section 6 states that "the node values in Tables 4 and 5 are squared for each node, and their sum is 1 (normalization). This is a property of our ranking algorithm." If the final output is unit L2 norm, the manuscript should clarify whether this is an inherent property of the gradient flow or a post-processing step; the current wording obscures a detail that is essential for reproducing the tables.
minor comments (6)
- [Figure 3 caption] The caption reads "Spacial Process Mining" and should be "Spatial Process Mining".
- [Table 3] In the EL2 column, the top-ranked node is listed as "PR_s11", which appears to be a typo for "RP_s11" used everywhere else.
- [Section 5.3] The text contains "meams" where "means" is intended.
- [Section 5.2] The 3-second duration and 10% overlap-ratio thresholds are described as heuristic; a sensitivity analysis would help because the event logs and all downstream rankings depend directly on these thresholds.
- [Section 3.2] The event-log tuple notation is not fully formal: the meaning of "property of E" is left undefined, and the handling of simultaneous events is not specified precisely enough for reproduction.
- [Tables 1 and 2] The "b-1" notation is explained only after the tables; it should be defined in the captions or before first use.
Circularity Check
The ranking algorithm behind Tables 4 and 5 is justified solely by the authors' own Theorem 5 in self-cited preprint [19]; the Section 6 localization and 'anxiety' conclusions rest on ranking values whose derivation is neither stated nor independently verifiable.
-
self citation load bearing
[Section 4, Ranking Algorithms, immediately after Tables 1-2; reference [19] in the reference list]
"Our proposed method is a gradient algorithm for a symmetric matrix A[i] = A[i](1) = L[i]^T L[i], which does not require L2 normalization and hyperparameter α, and it is based on the theorem 5 given in [19],A[i] and H[i] = H[i](1) =L[i]L[i]^T and their eigenvectors can be obtained by an iterative algorithm. As far as we know, our method is an unprecedented contribution in that it allows the exact step size to be determined from the potential function."
The all-important ranking values in Tables 4 and 5 are produced by an algorithm whose convergence and exact step size are claimed to follow from Theorem 5 of [19], the authors' own preprint arXiv:2307.09635. The theorem is not stated, the iteration is not specified, and no reproduction or machine-checked verification is supplied. The only support for the central numerical evidence is therefore a self-citation chain. The cited preprint's title restricts it to 'axisymmetric matrices with positive eigenvalues', while L[i]^T L[i] built from a directly-follows graph is positive semidefinite and typically singular at process start/end nodes; the paper gives no argument that the MDFM matrices satisfy the theorem's assumptions.
full rationale
The paper's central claim is not definitionally equivalent to its inputs: the 'degree of anxiety' is tied to independently measured cycle times (CT(EL1)=8:30, CT(EL2)=8:24, CT(EL3)=10:38), and the observed larger spread in Tables 4/5 for EL3 is an empirical assertion, not a fitted parameter renamed as a prediction. However, the viability of that assertion depends entirely on the correctness and applicability of the ranking algorithm, and that algorithm is outsourced to Theorem 5 of self-cited reference [19], without the theorem being stated or the iteration being specified in the present paper. No machine-checked proof, code reproduction, or parameter-free derivation with stated assumptions is given, so the citation is not independent evidence under the rules. The same three event logs are used both to illustrate the method and to confirm it, which weakens external validation but is not by itself a circular step. Because the load-bearing numerical artifact (Tables 4 and 5) reduces to a self-citation chain, a score of 5 is appropriate: partial circularity in the central technical support, while the empirical framing has independent content.
Assumptions & free parameters
free parameters (2)
- Overlap duration threshold =
3 seconds
- Bounding-box overlap ratio =
10%
assumptions (4)
- standard math Perron-Frobenius theory guarantees convergence of the power method for nonnegative primitive matrices and supports HITS/PageRank-type rankings.
- ad hoc to paper Theorem 5 in arXiv:2307.09635 (cited as [19]) guarantees that the gradient dynamical system finds eigenvectors of A=L^T L and H=L L^T without normalization or a hyperparameter.
- domain assumption Directly-follows graphs mined with ProM's 'Mine with Directly Follows visual Miner' adequately represent the process structure for ranking.
- domain assumption Manual annotation from visual inspection of videos provides reliable event logs for validation.
Cite this review
Pith. "Pith review of Spatial Process Mining." pith.science (2026). https://pith.science/paper/LP3FUWUZ
@misc{pith2026250606081,
  author       = {Pith},
  title        = {Pith review of: Spatial Process Mining},
  year         = {2026},
  howpublished = {\url{https://pith.science/paper/LP3FUWUZ}},
  note         = {Machine review of arXiv:2506.06081}
}
read the original abstract
We propose a new framework that focuses on on-site entities in the digital twin, a pairing of the real world and digital space. Characteristics include active sensing to generate event logs, spatial and temporal partitioning of complex processes, and visualization and analysis of processes that can be scaled in space and time. As a specific example, a cell production system is composed of connected manufacturing spaces called cells in a manufacturing process. A cell is sensed by ceiling cameras to generate a Gantt chart that provides a bird's-eye view of the process according to the cycle of events that occur in the cell. This Gantt chart is easy to understand for experienced operators, but we also propose a method for finding the focus of causes of deviations from the usual process without special experience or knowledge. This method captures the characteristics of the processes occurring in a cell by using our own event node ranking algorithm, a modification of HITS (Hypertext Induced Topic Selection), which scores web pages against a complex network generated from a process model.
Figures


Figures from the paper (5 more)


Reference graph
Works this paper leans on
-
[19]
Dynamical systems for eigenvalue problems of axisymmetric matrices with positive eigenvalues
Yoshizawa, S.: Dynamical systems for eigenvalue problems of axisymmetric matrices with positive eigenvalues. arXiv preprint, arXiv:2307.09635 (2023). 11
work page Pith review arXiv 2023
-
[1]
van der Aalst, W.: Process Mining: Data Science in Action. Springer, 2nd. (2016)
work page 2016
-
[2]
Mathematics 2, 11(12), 2691, (2023)
van der Aalst, W.M.P.: Object-Centric Process Mining: Unraveling the Fabric of Operational Pro- cesses. Mathematics 2, 11(12), 2691, (2023)
work page 2023
-
[3]
(2021).https://www.youtube.com/watch?v=kPzphTxxLzM,
Lufthansa CityLine: Lufthansa CityLine streamlines aircraft turnaround, reduces flight delays with Azure Video Analyzer. (2021).https://www.youtube.com/watch?v=kPzphTxxLzM,
work page 2021
-
[4]
In: Fahland, D., Ghidini, C., Becker, J., Dumas, M
Pasquadibisceglie, V., Appice, A., Castellano, G., Malerba, D.: Predictive Process Mining Meets Computer Vision. In: Fahland, D., Ghidini, C., Becker, J., Dumas, M. (eds) Business Process ManagementForum.BPM2020.LectureNotesinBusinessInformationProcessing, vol392.Springer, Cham (2020)
work page 2020
-
[5]
and Farhadi, A.: YOLOv3: An Incremental Improvement
Redmon, J. and Farhadi, A.: YOLOv3: An Incremental Improvement. arXiv preprint, arXiv:1804.02767 (2018)
arXiv 2018
-
[6]
Bradski, G.: The OpenCV Library. Dr. Dobb’s Journal of Software Tools, 120, pp. 122–125.(2000)
work page 2000
-
[7]
M.P.: A practitioner’s guide to process mining: Limitations of the directly-follows graph
van der Aalst, W. M.P.: A practitioner’s guide to process mining: Limitations of the directly-follows graph. Procedia Computer Science, Vol. 164, pp. 321–328 (2019)
work page 2019
Show all 22 references
-
[8]
and Wynn, M
Leemans, S.J.J., Poppe, E. and Wynn, M. T.: Directly Follows-Based Process Mining: Exploration & a Case Study. International Conference on Process Mining (ICPM 2019)
2019
-
[9]
(2017).https: //www.leemans.ch/publications/ivm.pdf
Leemans, S.J.J.: Inductive visual Miner & Directly Follows visual Miner manual. (2017).https: //www.leemans.ch/publications/ivm.pdf
2017
-
[10]
and Browning, T
Eppinger, S.D. and Browning, T. R.: Design Structure Matrix Methods and Applications. MIT Press, (2012)
2012
-
[11]
and Reich, Y.: Managing the Dynamics of New Product Development Processes: A New Product Lifecycle Management Paradigm
Karniel, A. and Reich, Y.: Managing the Dynamics of New Product Development Processes: A New Product Lifecycle Management Paradigm. Springer, (2011)
2011
-
[12]
Saaty, T. L. and Vargas, L. G.: Decision Making with the Analytic Network Process. Springer New York, (2013)
2013
-
[13]
M.: Authoritative sources in a hyperlinked environment
Kleinberg, J. M.: Authoritative sources in a hyperlinked environment. Journal of the ACM (JACM), 5, Vol.46, pp. 604–632, (1999)
1999
-
[14]
and Page, L.: The anatomy of a large scale hypertextual Web search engine
Brin, S. and Page, L.: The anatomy of a large scale hypertextual Web search engine. Computer Networks and ISDN Systems, 30, pp. 107–117, (1998)
1998
-
[15]
Langville, A. N. and Meyer. C. D.: Google’s PageRank and beyond: The Science of Search Engine Rankings. Princeton Univ. Press, (2006)
2006
-
[16]
Langville, A. N. and Meyer. C. D.: Who’s #1? The Science of Rating and Ranking. Princeton Univ. Press, Princeton and Oxford, (2012)
2012
-
[17]
K., Pramanik, A., Maiti, J
Pal, S. K., Pramanik, A., Maiti, J. and Mitra, P.: Deep learning in multi-object detection and tracking: state of the art. Appl Intell 51, 6400–6429 (2021)
2021
-
[18]
and Lowe, D
Brown, M. and Lowe, D. G.: Automatic Panoramic Image Stitching using Invariant Features. Inter- national Journal of Computer Vision 74(1), pp. 59—73, (2007)
2007
-
[20]
and Tian, Y.: Deep Learning-Based Action Detection in Untrimmed Videos: A Survey
Vahdani, E. and Tian, Y.: Deep Learning-Based Action Detection in Untrimmed Videos: A Survey. IEEE Transactions on Pattern Analysis and Machine Intelligence. 45(4), pp. 4302-4320, (2023)
2023
-
[21]
Tritin Truong
Sekachev, B., Manovich, N., Zhiltsov-Max, Zhavoronkov, A., Kalinin, D., Hoff, B., TOsmanov, Zankevich, A., DmitriySidnev, Markelov, M., Johannes222, Chenuet, M., A-Andre, Telenachos, Mel- nikov, A., Kruchinin, D., Jijoong Kim, Ilouz, L., Glazov, N., ... Tritin Truong. (2020). ...
2020
-
[22]
Powers, D. M. W.: Evaluation: From precision, recall and F-measure to ROC, informedness, marked- ness & correlation. J. Mach. Learn. Technol. 2, pp. 2229-3981, (2011). 12
2011
Reviewed August 7, 2026 · model on record in the stance chip above.
Discussion (0). Sign in to comment.