REVIEW 3 major objections 8 minor 40 references
Dynamic Social Networks in Dairy Cows
T0 review · 3 major / 8 minor · reviewed 2026-08-07 · deepseek-v4-flash
Pith's one-line read Dairy cows form no stable whole-barn social communities; their stable groups appear only in feeding and general areas.
desk verdict A solid descriptive study of dairy cow proximity networks whose central negative result hinges on an untested 30-minute threshold; worth reviewing after sensitivity analysis. read the letter →
The pith
A machine-rendered reading of the paper's core claim, the machinery that carries it, and where it could break.
The reading
What carries the argument
The central object is the time adjacency matrix (TAM): an N x N matrix in which each cell records how many seconds a pair of cows spent within 150 cm of each other during a day, sampled every 10 seconds. Edges are kept only if the pair spent at least 30 minutes together, producing a binary or weighted adjacency matrix from which graphs are built. The argument then runs through community detection by modularity maximization (weighted Louvain) and through temporal stability measured by normalized mutual information between partitions of consecutive days. The key comparison is between the whole-barn TAM and four area-specific TAMs (bed, robot, feeding, general), which isolates where stable structure actually lives.
What would settle it
Recompute the daily networks with a grid of proximity thresholds (for example 100, 150, and 200 cm) and time thresholds (for example 10, 20, 30, and 60 minutes). If any reasonable threshold yields whole-barn modularity above about 0.3 with consecutive-day NMI above about 0.5, the claim of no stable barn-level communities would be overturned; if a 10-minute threshold reveals stable communities in the robot area, the claim that meaningful structure only appears in feeding and general areas would be overturned.
Extended reading notes
Core claim
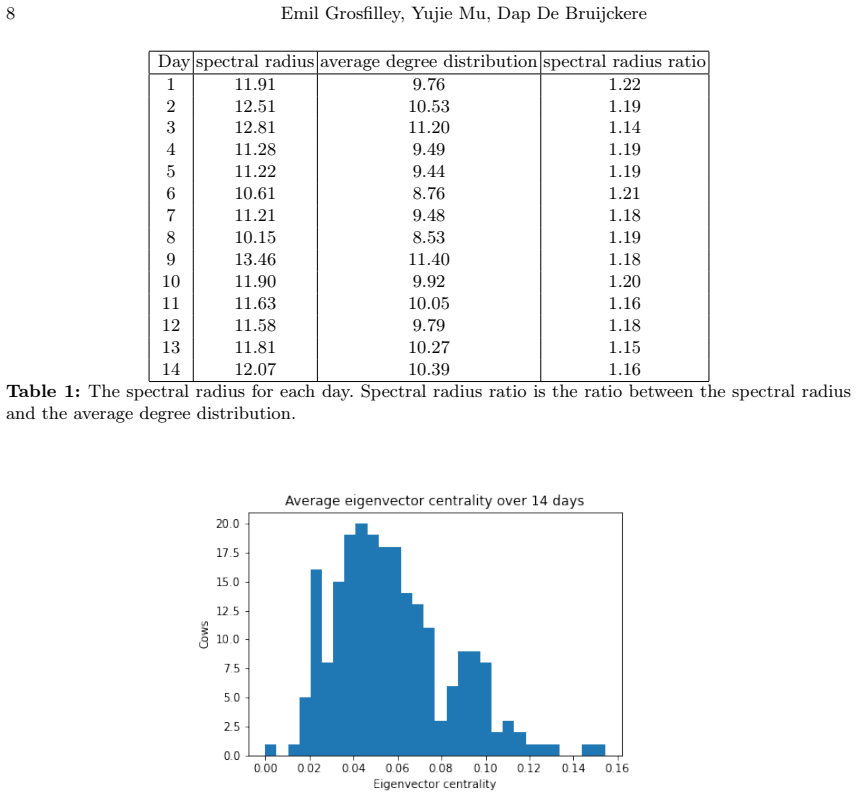
The paper's core claim is that dairy cow social networks, measured by co-location, are hierarchical but not modular at the barn level. Using daily networks built from proximity data, the authors find that the network is sparse (around 4.5 percent density), has low connectivity, and contains three cows who appear in the top decile of degree on 10 to 11 of the 14 days, indicating a persistent top of the hierarchy. Community detection with weighted Louvain yields modularity values around 0.3 to 0.5 for the whole barn and day-to-day normalized mutual information below 0.2, so community membership reshuffles almost completely between consecutive days. When the same analysis is restricted to feeding and general areas, modularity rises to roughly 0.72 to 0.89 and the consecutive-day NMI rises substantially, which the authors take as evidence that meaningful, relatively stable communities exist only in activity-specific contexts. The bed area behaves like noise and the robot area yields no communities at the 30-minute threshold, which the paper flags as an artifact of the cutoff.
Load-bearing premise
The load-bearing premise is that being within 150 cm of another cow for at least 30 minutes per day, measured at 10-second resolution, is a valid proxy for a social interaction; the paper chooses both thresholds without a sensitivity analysis, and the robot-area result is explicitly an artifact of the 30-minute cutoff.
Editorial extensions
If this is right
- Grouping or splitting cows based on whole-barn social communities is not supported; any stable social structure should be defined separately for feeding and general areas.
- The few cows that consistently hold top centrality are the most likely bridge or risk nodes for disease transmission, so targeted monitoring of those individuals may be more effective than monitoring the whole group.
- Daily community membership changes drastically even when the hierarchy persists, meaning social bonds are more fluid than stable network metrics suggest.
- Bed-area co-location should be treated as noise in future dairy social-network studies, and the milking area needs a shorter time threshold before any conclusion is possible.
Reading between the lines
- A direct test the paper leaves open: lowering the 30-minute edge threshold should reveal whether robot-area communities exist and whether whole-barn communities appear at finer time scales; the paper itself says the robot-area null result is an artifact of the cutoff.
- If the proximity proxy is partly driven by physical crowding at feeders rather than social preference, the area-specific communities may reflect shared scheduling constraints such as feeding times rather than affiliative bonds; that distinction would require direct behavioural observation.
- The three consistently central cows could be followed across a longer period or linked to production, health, and dominance records to see whether high centrality is a stable individual trait.
- The same area-specific TAM pipeline could be transferred to other group-housed livestock such as pigs, goats, or poultry, where activity zones also structure social contact.
Editorial analysis
A structured set of objections, weighed in public.
Referee Report
Summary. The manuscript reconstructs daily proximity-based social networks of about 210 lactating dairy cows over 14 days using Cowview positioning data. Edges are defined by co-location within 150 cm for at least 30 min per day, sampled at 10 s resolution, with weights from Eq. (1). The authors apply Girvan-Newman, Louvain, and clique percolation community detection to whole-barn and area-specific networks, and compare NMI and transitivity against random-graph null models. They conclude that the whole-barn network shows no stable community structure, that feeding and general areas show relatively clear communities, that bed-area structure is weak, and that the network is centralized with a persistent top of the degree hierarchy. The paper also discusses future uses of federated learning and LLMs.
Significance. If the central result holds, it would usefully shift attention from whole-barn herd partitions to activity-specific interaction zones, with practical implications for disease-transmission modeling and group management. The paper's strengths are its explicit, reproducible preprocessing pipeline; the use of 1000 random-graph null models for NMI and transitivity; and the manual inspection of community overlap in feeding and general areas. The main weakness is that the thresholds defining an interaction (150 cm, 30 min) are not subjected to sensitivity analysis, and the paper's own robot-area result shows that the 30-min cutoff can eliminate community structure. The result is therefore plausible but not yet robust.
major comments (3)
- [Sections 3.2-3.3, Eq. (1), Sections 4.5 and 6] The 30-minute minimum co-location time tmin is load-bearing for the central negative result, but no sensitivity analysis is reported for tmin or for the 150 cm proximity threshold. The manuscript itself shows the threshold matters: Section 4.5 attributes the absence of communities in the robot area to 'the threshold of 30 minutes is too long,' and Section 6 recommends decreasing the time threshold. Because the whole-barn TAM aggregates all areas, the whole-barn null NMI (Figure 7) and the sharp contrast with area-specific results could change under a lower tmin, as could density (Table 6), Louvain partitions, and the top-degree cows in Table 7. A threshold sweep (e.g., tmin in 5, 10, 15, 20, 30, 45, 60 minutes and distance in 100, 150, 200 cm) with reported density, modularity, NMI, and degree-centrality persistence is needed before the headline claim can be accepted.
- [Section 4.5] The statement 'it is assumed that the number of communities should not change significantly' is used to select Louvain over CPM and to judge the communities as stable, but the assumption is not justified from either the literature or the data. If the true number of communities varies across days, then penalizing methods that report a varying number introduces a circularity into the method comparison. The authors should either justify the assumption independently or evaluate stability with criteria that do not assume count invariance, such as NMI relative to a null distribution or cluster-validity indices computed without a fixed count.
- [Section 4.1, Table 7 and Section 4.4] The hierarchy claim, namely that there are 'three leading cows' that are 'significantly more' central, is not backed by a formal statistical test or a group-level centralization measure. The text reports counts of appearances in the top 10% list but does not test whether the gap between 10-11 appearances and 6-7 appearances exceeds what is expected under a null model, nor does it report a centralization index (e.g., degree centralization) to support the word 'significant' in the abstract. A permutation or bootstrap test on top-degree membership, together with a standard centralization statistic, would make this claim load-bearing.
minor comments (8)
- [Section 3.2] The statement that a 10 s resolution 'preserves about 98% of the information' is not defined; specify whether this is the fraction of nonzero TAM cells, total co-location time, or something else.
- [Section 4.1, Table 7] The phrase 'none between 7 and 10' is confusing because the table contains entries equal to 10; clarify that no cow appears in 8 or 9 days.
- [Section 4.5] The sentence 'As mentioned in Section 4.6.2' refers to a subsection that does not exist; the area-specific TAMs are described in Section 3.2.
- [Figure 5] The eigenvector similarity plot has no axis label or scale, and the text reports values up to 368.736 without explaining what scale would make these interpretable.
- [Section 4.5] The claim that 'an NMI of about 0.55' indicates stable communities is presented without a source or derivation; report the actual NMI values for the feeding and general areas and justify the threshold.
- [Sections 3.2, 3.3, Abstract] There are several typos, including 'an time adjacency matrix,' 'time int the WAM,' and 'dutch'; a careful proofreading pass is needed.
- [Section 4.3, Table 4] The comparison of real and simulated transitivity claims significance, but no test statistic or p-value is reported.
- [Section 6] The paragraphs on federated learning and large language models are not connected to the reported analysis and would be better placed in a separate discussion or removed.
Circularity Check
No significant circularity: the study is a descriptive observational network analysis with independent null-model and manual stability checks, and no fitted parameter is later relabeled as a prediction.
full rationale
The paper's derivation chain is not circular. Positional data are converted into time-adjacency matrices using explicit proximity and duration thresholds (Section 3.2–3.3), and the resulting networks are described with standard metrics and community-detection algorithms. The central claims about whole-barn versus area-specific community structure rest on temporal consistency measured by NMI, and these NMI values are compared against 1000 random graphs with matched density (Section 4.5). The manual stability check provides an external, non-algorithmic validation of the NMI interpretation. The only mild methodological concern is that Louvain maximizes modularity and the paper later cites relatively high modularity as evidence of community structure, but this is not a reduction of a prediction to a fitted input, and the independent NMI and manual checks carry the weight of the community-structure claims. There is no load-bearing self-citation; cited prior work on proximity and area-specific social structure is external. The acknowledged threshold limitation for the robot area (Section 4.5) is a robustness caveat, not a circular step. No fitted parameter is renamed as a prediction, and no result is defined in terms of the quantity it is claimed to explain.
Assumptions & free parameters
free parameters (3)
- proximity threshold =
150 cm
- minimum co-location time t_min =
30 minutes
- sampling resolution =
10 seconds
assumptions (4)
- domain assumption Spatial proximity is a valid proxy for social interaction in dairy cows.
- domain assumption The social relationship between two cows is symmetric, so an undirected graph is appropriate.
- ad hoc to paper The number of cow communities should not change significantly across 14 consecutive days.
- domain assumption Modularity values above 0.3 indicate a good community partition.
Cite this review
Pith. "Pith review of Dynamic Social Networks in Dairy Cows." pith.science (2026). https://pith.science/paper/CKRPOHJZ
@misc{pith2026250606372,
  author       = {Pith},
  title        = {Pith review of: Dynamic Social Networks in Dairy Cows},
  year         = {2026},
  howpublished = {\url{https://pith.science/paper/CKRPOHJZ}},
  note         = {Machine review of arXiv:2506.06372}
}
read the original abstract
Social relations have been shown to impact individual and group success in farm animal populations. Fundamental to addressing these relationships is an understanding of the social network structure resulting from the co-habitation and co-movement of relationships between individuals in a group. Here, we investigate the social network of a group of around 210 lactating dairy cows on a dutch farm during a 14 days period. A positioning system called \emph{Cowview} collected positional data for the whole period. We make the assumption that spatial proximity can be used as a proxy for social interaction. The data is processed to get adjacency matrices. Then social networks are identified based on these matrices. Community detection techniques are applied to the networks. We measure metrics of different dimensions to test community structure, centralization, and similarity of network structure over time. Our study show that there is no evidence that cows are subdivided into stable social communities when looking at interaction in the whole barn. We, however, notice relatively clear communities when dividing the barn into areas with different activities. The social network is characterized by significant centralization, low connectivity, and a hierarchy.
Figures


Figures from the paper (5 more)


Reference graph
Works this paper leans on
-
[1]
“Gea system cowview™.”https://www.gea-cowview.com/. Accessed: 2022-01-08
work page 2022
-
[2]
Socio-spatial relationships in dairy cows,
L. Gygax, G. Neisen, and B. Wechsler, “Socio-spatial relationships in dairy cows,”Ethology, vol. 116, no. 1, pp. 10–23, 2010
work page 2010
-
[3]
Social licking patterns in cattle (bos taurus): influence of environ- mental and social factors,
S. Sato, S. Sako, and A. Maeda, “Social licking patterns in cattle (bos taurus): influence of environ- mental and social factors,”Applied Animal Behaviour Science, vol. 32, no. 1, pp. 3–12, 1991
work page 1991
-
[4]
Grouping and social preferences in calves, heifers and cows,
K. E. Bøe and G. Færevik, “Grouping and social preferences in calves, heifers and cows,”Applied Animal Behaviour Science, vol. 80, no. 3, pp. 175–190, 2003
work page 2003
-
[5]
N.Hasegawa,A.Nishiwaki,K.Sugawara,andI.Ito,“Theeffectsofsocialexchangebetweentwogroups of lactating primiparous heifers on milk production, dominance order, behavior and adrenocortical response,”Applied Animal Behaviour Science, vol. 51, no. 1, pp. 15–27, 1997
work page 1997
-
[6]
Heifer rearing conditions affect length of productive life in swedish dairy cows,
J. Hultgren and C. Svensson, “Heifer rearing conditions affect length of productive life in swedish dairy cows,”Preventive Veterinary Medicine, vol. 89, no. 3, pp. 255–264, 2009
work page 2009
-
[7]
Precision livestock breeding - improving both health and production in dairy cattle
“Precision livestock breeding - improving both health and production in dairy cattle.”https://www. slu.se/en/faculties/vh/research/forskningsprojekt/not/precision- livestock- breeding/. Accessed: 2022-01-20
work page 2022
-
[8]
C. S, I. A, W. BJ, S. MW, and L. C, “Spatial-temporal dynamics of high-resolution animal networks: What can we learn from domestic animals?,”PLoS ONE, vol. 10, 2015
work page 2015
Show all 40 references
-
[9]
D. P. Croft, R. James, and J. Krause,Exploring animal social networks. Princeton University Press, 2008
2008
-
[10]
Animal social networks: an introduction,
J. Krause, D. Lusseau, and R. James, “Animal social networks: an introduction,”Behavioral Ecology and Sociobiology, vol. 63, no. 7, pp. 967–973, 2009
2009
-
[11]
Proximity as a proxy for interactions: issues of scale in social network analysis,
D. R. Farine, “Proximity as a proxy for interactions: issues of scale in social network analysis,”Animal Behaviour, vol. 104, pp. e1–e5, 2015
2015
-
[12]
Persistence of sociality in group dynamics of dairy cattle,
L. E. Rocha, O. Terenius, I. Veissier, B. Meunier, and P. P. Nielsen, “Persistence of sociality in group dynamics of dairy cattle,”Applied Animal Behaviour Science, vol. 223, p. 104921, 2020
2020
-
[13]
Finding and evaluating community structure in networks,
M. E. J. Newman and M. Girvan, “Finding and evaluating community structure in networks,”Phys. Rev. E, vol. 69, p. 026113, Feb 2004
2004
-
[14]
From louvain to leiden: guaranteeing well-connected communities,
V. A. Traag, L. Waltman, and N. J. Van Eck, “From louvain to leiden: guaranteeing well-connected communities,”Scientific reports, vol. 9, no. 1, pp. 1–12, 2019
2019
-
[15]
Clique percolation in random networks,
I. Derényi, G. Palla, and T. Vicsek, “Clique percolation in random networks,”Physical review letters, vol. 94, no. 16, p. 160202, 2005
2005
-
[16]
Old and new results on algebraic connectivity of graphs,
N. M. M. de Abreu, “Old and new results on algebraic connectivity of graphs,”Linear Algebra and its Applications, vol. 423, no. 1, pp. 53–73, 2007. Special Issue devoted to papers presented at the Aveiro Workshop on Graph Spectra
2007
-
[17]
Learning graph matching,
T. S. Caetano, J. J. McAuley, L. Cheng, Q. V. Le, and A. J. Smola, “Learning graph matching,”IEEE transactions on pattern analysis and machine intelligence, vol. 31, no. 6, pp. 1048–1058, 2009
2009
-
[18]
Common eigenvectors of two matrices,
D. Shemesh, “Common eigenvectors of two matrices,”Linear Algebra and its Applications, vol. 62, pp. 11–18, 1984
1984
-
[19]
Fast algorithm for detecting community structure in networks. phys. rev. e stat. nonlin. soft. matter. phys. 69(6 pt 2), 066133,
M. Newman, “Fast algorithm for detecting community structure in networks. phys. rev. e stat. nonlin. soft. matter. phys. 69(6 pt 2), 066133,”Physical review. E, Statistical, nonlinear, and soft matter physics, vol. 69, p. 066133, 07 2004
2004
-
[20]
A comparative analysis of community detection algo- rithms on artificial networks,
Z. Yang, R. Algesheimer, and C. J. Tessone, “A comparative analysis of community detection algo- rithms on artificial networks,”Scientific reports, vol. 6, no. 1, pp. 1–18, 2016
2016
-
[21]
Normalized mutual information to evaluate overlapping community finding algorithms,
A. F. McDaid, D. Greene, and N. Hurley, “Normalized mutual information to evaluate overlapping community finding algorithms,” Oct. 2011
2011
-
[22]
Evaluating accuracy of community detection using the relative normalized mutual infor- mation,
P. Zhang, “Evaluating accuracy of community detection using the relative normalized mutual infor- mation,”Journal of Statistical Mechanics: Theory and Experiment, vol. 2015, p. P11006, nov 2015
2015
-
[23]
Identify well-connected users in an undirected graph,
G. Rohrich, “Identify well-connected users in an undirected graph,” Apr 2021
2021
-
[24]
Fiedler’s theory of spectral graph partitioning
B. Slininger, “Fiedler’s theory of spectral graph partitioning.”
-
[25]
The social network structure of a dynamic group of dairy cows: From individual to group level patterns,
N. K. Boyland, D. T. Mlynski, R. James, L. J. Brent, and D. P. Croft, “The social network structure of a dynamic group of dairy cows: From individual to group level patterns,”Applied Animal Behaviour Science, vol. 174, pp. 1–10, 2016
2016
-
[26]
Federated machine learning: Concept and applications,
Q. Yang, Y. Liu, T. Chen, and Y. Tong, “Federated machine learning: Concept and applications,” ACM Transactions on Intelligent Systems and Technology (TIST), vol. 10, no. 2, pp. 1–19, 2019
2019
-
[27]
Federated learning: Challenges, methods, and future directions,
T. Li, A. K. Sahu, A. Talwalkar, and V. Smith, “Federated learning: Challenges, methods, and future directions,”IEEE Signal Processing Magazine, vol. 37, no. 3, pp. 50–60, 2020. Dynamic Social Networks in Dairy Cows 19
2020
-
[28]
Efficient Resource Scheduling for Distributed Infrastructures Using Ne- gotiation Capabilities ,
J. Chu, P. Singh, and S. Toor, “ Efficient Resource Scheduling for Distributed Infrastructures Using Ne- gotiation Capabilities ,” in2023 IEEE 16th International Conference on Cloud Computing (CLOUD), (Los Alamitos, CA, USA), pp. 486–492, IEEE Computer Society, July 2023
2023
-
[29]
Federated optimization: Distributed machine learning for on-device intelligence,
J. Konečn` y, B. McMahan, F. Yu, P. Richtárik, A. T. Suresh, and D. Bacon, “Federated optimization: Distributed machine learning for on-device intelligence,” inarXiv preprint arXiv:1610.02527, 2016
2016 arXiv
-
[30]
Communication-efficient learn- ing of deep networks from decentralized data,
B. McMahan, E. Moore, D. Ramage, S. Hampson, and B. A. y Arcas, “Communication-efficient learn- ing of deep networks from decentralized data,” inProceedings of the 20th International Conference on Artificial Intelligence and Statistics, pp. 1273–1282, 2017
2017
-
[31]
On the opportunities and risks of foundation models,
R. Bommasani, D. A. Hudson, E. Adeli,et al., “On the opportunities and risks of foundation models,” arXiv preprint arXiv:2108.07258, 2021
2021 arXiv
-
[32]
Llm4agri: Large language models for smart agriculture,
W. Zhang, J. Wang, H. Li,et al., “Llm4agri: Large language models for smart agriculture,”Computers and Electronics in Agriculture, vol. 206, p. 107661, 2023
2023
-
[33]
Acomprehensivesurveyonlargelanguagemodels:recentadvancesandfutureprospects,
P.Liuet al.,“Acomprehensivesurveyonlargelanguagemodels:recentadvancesandfutureprospects,” arXiv preprint arXiv:2303.18223, 2023
2023 arXiv
-
[34]
Extracting training data from large language models,
N. Carlini, F. Tramer, E. Wallace,et al., “Extracting training data from large language models,” in USENIX Security Symposium, pp. 2633–2650, 2021
2021
-
[35]
Does bert pretrain on medical corpora make a difference?,
E. Lehmanet al., “Does bert pretrain on medical corpora make a difference?,”arXiv preprint arXiv:2104.07467, 2021
2021 arXiv
-
[36]
Reconstruct your previous conversations! comprehensively investigating privacy leakage risks in conversations with GPT models,
J. Chu, Z. Sha, M. Backes, and Y. Zhang, “Reconstruct your previous conversations! comprehensively investigating privacy leakage risks in conversations with GPT models,” inProceedings of the 2024 Conference on Empirical Methods in Natural Language Processing(Y. Al-Onaizan, M. ...
2024
-
[37]
Understanding privacy risks of data in language models,
H. Zhanget al., “Understanding privacy risks of data in language models,” inProceedings of the 30th USENIX Security Symposium, 2021
2021
-
[38]
Languagemodelsarefew-shotlearners,
T.B.Brownet al.,“Languagemodelsarefew-shotlearners,”Advances in neural information processing systems, vol. 33, pp. 1877–1901, 2020
1901
-
[39]
Llama: Open and efficient foundation language models,
H. Touvronet al., “Llama: Open and efficient foundation language models,”arXiv preprint arXiv:2302.13971, 2023
2023 arXiv
-
[40]
Gpt-4 technical report,
OpenAI, “Gpt-4 technical report,” 2023.https://openai.com/research/gpt-4
2023
Reviewed August 7, 2026 · model on record in the stance chip above.
Discussion (0). Sign in to comment.