REVIEW 4 major objections 4 minor 31 references
Influence Mechanism of Truncation on Low-Frequency Phase Measurement
T0 review · 4 major / 4 minor · reviewed 2026-08-07 · deepseek-v4-flash
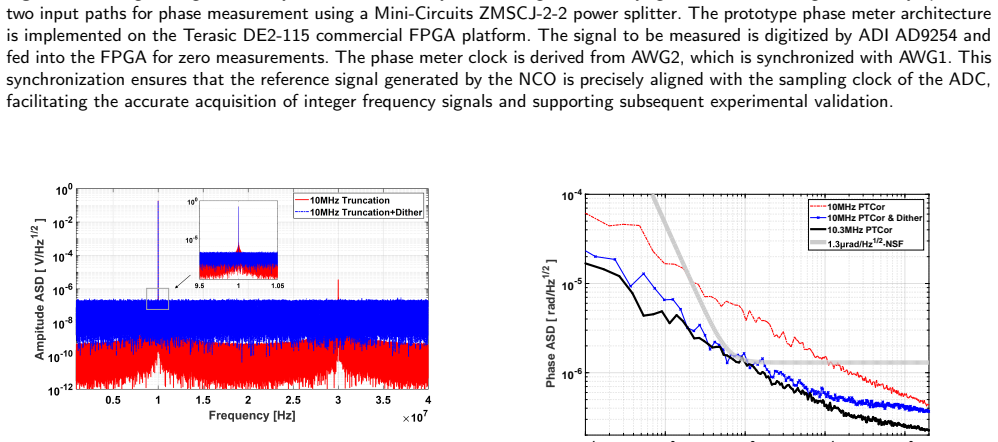
Pith's one-line read Dither added before phase truncation suppresses low-frequency phase noise in digital phasemeters, yielding a 9.5 dB improvement at 10 mHz.
desk verdict The 9.5 dB dither improvement is real, but the paper's own equations make phase-truncation spurs vanish at exactly 10 MHz with 80 MHz sampling, so the central attribution is wrong. read the letter →
The pith
A machine-rendered reading of the paper's core claim, the machinery that carries it, and where it could break.
The reading
What carries the argument
The load-bearing object is the truncated phase word in the numerically controlled oscillator, quantified by the equivalent tuning word $\mathrm{ETW}=\mathrm{PIR}\bmod 2^B$ and the grand repetition rate $\mathrm{GRR}=2^A/\mathrm{GCD}(\mathrm{PIR},2^A)$. The truncation error behaves as a sawtooth wave with period $T_t=2^B/\mathrm{ETW}$ (or its mirror for $\mathrm{ETW}\ge 2^{B-1}$), which is why the spurs are periodic and alias into the Nyquist band. The suppression machinery is Gaussian dither synthesized from linear feedback shift registers, added to the phase before truncation so the deterministic error no longer correlates with the signal; the dither period must exceed 10,000 seconds to cover the 0.1 mHz band.
What would settle it
With the same test setup, measure a 10 MHz carrier while the numerically controlled oscillator keeps all phase bits (no truncation); if the low-frequency noise floor does not drop to the 10.3 MHz level, phase truncation is not the dominant cause of the excess noise.
Extended reading notes
Core claim
On the paper's own terms, the central claim is that phase truncation in the numerically controlled oscillator produces a periodic sawtooth error whose spurs alias into the measurement band exactly when the signal frequency and sampling frequency approach an integer ratio. For a 10 MHz signal this concentrates remapped spectral lines at 10 MHz and 30 MHz; the 30 MHz component acts as a $3\omega$ artifact that, after mixing and aliasing, adds a nonlinear term $G\sin(2\varphi_m)$ to the measured phase. Adding Gaussian dither before truncation smooths the sawtooth, broadens the spurs into a white floor, and restores a phase noise of about $1.3\,\mathrm{\mu rad/Hz^{1/2}}\cdot\mathrm{NSF}$ from 0.1 mHz to 1 Hz, matching the readout requirement for space gravitational wave detection.
Load-bearing premise
The experiment's excess noise at 10 MHz is blamed specifically on the internal step of dropping low-order phase bits, and not on other parts of the test chain that also differ between the 10 MHz and 10.3 MHz runs.
Editorial extensions
If this is right
- Non-integer test frequencies such as 10.3 MHz avoid a real noise mechanism, so swept-frequency carriers that pass through integer ratios will momentarily encounter elevated low-frequency phase noise unless dither is active.
- An LFSR-based Gaussian dither can be implemented directly in Verilog on the same FPGA, so the suppression costs little additional hardware.
- Suppressing the truncation spurs also removes the $3\omega$ artifact, eliminating the nonlinear phase error term $G\sin(2\varphi_m)$ from the phase readout.
- With dither, the measured phase noise floor meets the $1.3\,\mathrm{\mu rad/Hz^{1/2}}\cdot\mathrm{NSF}$ requirement from 0.1 mHz to 1 Hz, the band needed for space gravitational wave interferometry.
Reading between the lines
- If the mechanism is as general as the paper's framing suggests, any direct digital synthesis system whose output frequency approaches an integer submultiple of the clock should show the same spur-concentration effect, so dithering before phase-to-amplitude conversion could serve as a general spur-mitigation recipe.
- The experimental chain only compares one integer-ratio frequency (10 MHz) with one non-integer frequency (10.3 MHz); sweeping the carrier across the integer-ratio boundary with and without dither would test whether the predicted noise hump tracks the resonance condition.
- The paper's spur-position calculation uses an illustrative equivalent tuning word ($\mathrm{ETW}=2674$) rather than the actual PIR of the experimental setup; recovering the real register values and re-running the aliasing calculation would quantify how tightly the 10/30 MHz spur prediction is tied to this particular experiment.
Editorial analysis
A structured set of objections, weighed in public.
Referee Report
Summary. This manuscript studies quantization and phase-truncation errors in FPGA-based digital phasemeters for space gravitational-wave detection. It distinguishes white-noise conditions for truncation errors from non-white spurs that arise when the signal frequency is near an integer multiple of the sampling rate, explains how spur aliasing and amplitude artifacts degrade low-frequency phase measurements, and proposes suppressing the effect by adding LFSR-synthesized Gaussian dither before phase truncation. The experimental section reports that a 10.3 MHz signal meets the 1.3 µrad/Hz^1/2·NSF requirement from 0.1 mHz to 1 Hz, whereas a 10 MHz signal exceeds the requirement from 2 mHz to 0.1 Hz, and that adding dither improves the 10 MHz phase noise by 9.5 dB at 10 mHz, restoring compliance.
Significance. If substantiated, the manuscript would provide a practical, low-cost mitigation for the integer-ratio phase-noise problem in digital phasemeters, with a concrete LFSR dither implementation and a 10,000 s experimental validation. The qualitative description of spur aliasing and nonlinear phase artifacts is useful and addresses a real issue for space gravitational-wave readout. However, the central attribution of the 10 MHz excess noise to phase truncation is contradicted by the authors' own Eq. (8) for the stated fs=80 MHz and 10 MHz signal, so the claimed mechanism and the 9.5 dB improvement require major clarification and additional evidence.
major comments (4)
- [§3.2, Eq. (8), and §4, Fig. 10] The central claim is internally inconsistent with the stated parameters. For fs=80 MHz and a 10 MHz signal, PIR = 2^(A-3) in the NCO, and for any practical accumulator width A≥15 the lower B=12 bits of PIR are zero, so Eq. (8) gives ETW=0. The truncation word is then constant, the sawtooth in Fig. 4 has zero amplitude, and the phase-truncation error is identically zero. Under the paper's own equations, the 10 MHz excess noise shown in Fig. 10 cannot be caused by phase truncation, and the 9.5 dB dither improvement cannot be interpreted as smoothing of truncation error, unless the locked PIR contained an unreported fractional offset. Please report the NCO accumulator width, the actual PIR used in the locked loop, and a simulation of the truncation spur spectrum for the experimental parameters; if the signal was not exactly 10.000000 MHz, state the actual frequency offset.
- [§3.2] The ETW=2,674 example is explicitly illustrative and is never derived from the experimental phase accumulator width and PIR. The prediction that aliased truncation spurs are concentrated at 10 MHz and 30 MHz is therefore not quantitatively established for the measured configuration. This is load-bearing because it is the sole basis for attributing the dashed red curve in Fig. 10 to truncation rather than to the AWG, ADC, power splitter, or clock synchronization. The analysis should be rerun with the actual PIR and fs used in the experiment.
- [§4, Fig. 10] The experimental evidence for the 9.5 dB improvement is a single differential measurement without repeated runs, error bars, or a control condition that isolates the truncation mechanism, such as disabling phase truncation entirely or testing a frequency with a nonzero ETW that is not an integer multiple. Given the inconsistency identified in the first major comment, the observed improvement could equally be explained by dither acting on other quantization or clock paths. Please add repeated measurements, quantify run-to-run dispersion, and include a control measurement that verifies the absence of truncation-induced noise when ETW=0.
- [§4 (dither synthesis) and Eq. (6)] The manuscript does not specify the dither amplitude or standard deviation relative to the LSB, the LFSR length and polynomial used in the experiment, or the criterion for choosing them; without this information the claimed 9.5 dB result cannot be reproduced. In addition, Eq. (6) sets the phase noise density equal to the amplitude noise density of Eq. (4), omitting the |S_n|/|S_0| dependence of Eq. (5); the calculated white-noise floor of 0.03 µrad/Hz^1/2 is therefore not substantiated as stated and should be rederived with the carrier amplitude included.
minor comments (4)
- [Fig. 4 caption] The caption states that '1,024 discrete frequencies constitute the truncation spurs' while the complete sequence repeats after GRR=2048; please clarify the relationship between the number of unique spur lines, the GRR, and the Nyquist binning.
- [Fig. 10] The legend label '10MHz PTCor' is unclear; please spell out the abbreviation and clearly distinguish the measured curves from the requirement curve 1/2·NSF in the caption or legend.
- [Section 2, Eq. (3)] The transfer function H(z) in Eq. (3) is presented without a derivation or reference; please define all loop coefficients and state the assumptions under which the linearized DPLL transfer function is valid.
- [Frontmatter] The abstract appears twice at the beginning of the manuscript; please remove the duplicate.
Circularity Check
No significant circularity; the dither improvement is an experimental comparison against an external requirement, and the truncation-spur model comes from prior external DDS theory.
full rationale
The paper does not derive its central claim by reusing its own inputs. The 9.5 dB improvement after adding LFSR-synthesized Gaussian dither is an experimental result comparing measured phase-noise spectra at 10 MHz with and without dither against the externally stated 1.3 µrad/Hz^1/2·NSF requirement (Fig. 10 and Section 4). The non-white truncation-spur mechanism is imported from external DDS literature (Sripad & Snyder [28], Nicholas & Samueli [30]), and Eq. (8) defines ETW without fitting it to the measured data; the ETW=2674 example is explicitly illustrative (Section 3.2). The only self-citation, Ref. [17] (Feng et al. 2024), appears in a routine list of phasemeter performance improvements and is not load-bearing for the dither claim. A separate consistency concern is that with fs=80 MHz the stated 10 MHz test tone may give ETW=0 in Eq. (8), which would mean phase truncation produces no spurs under the paper's own equations; the paper never reports the NCO PIR or accumulator width used in the experiment, so the attribution of the measured excess noise to truncation is under-supported. That is a correctness/evidence gap, not a circular reduction, and does not raise the circularity score under the rubric.
Assumptions & free parameters
free parameters (3)
- ETW example value 2674 =
2674 (mod 2^12, B=12)
- Dither amplitude or standard deviation =
not stated
- NCO phase accumulator width and PIR =
not stated
assumptions (4)
- standard math Quantization noise can be treated as uniformly distributed white noise when the Sripad-Snyder conditions hold.
- domain assumption Phase truncation error can be represented as a sawtooth whose period is T_t = 2^B / (ETW or 2^B - ETW), with grand repetition rate GRR.
- ad hoc to paper For the experimental signal, aliased truncation spurs concentrate at 10 MHz and 30 MHz.
- domain assumption The mission requirement is 1.3 µrad/Hz^1/2 times NSF, with NSF = [1 + (6 mHz/f)^4]^1/2.
Cite this review
Pith. "Pith review of Influence Mechanism of Truncation on Low-Frequency Phase Measurement." pith.science (2026). https://pith.science/paper/MV3XP25W
@misc{pith2026250606788,
  author       = {Pith},
  title        = {Pith review of: Influence Mechanism of Truncation on Low-Frequency Phase Measurement},
  year         = {2026},
  howpublished = {\url{https://pith.science/paper/MV3XP25W}},
  note         = {Machine review of arXiv:2506.06788}
}
abstract
Driven by advances in electronic technology, modern digital phasemeters have significantly improved in integration and functionality, enabling real-time measurement and analysis of dynamic signals. High-precision phase measurement is closely associated with the quantization process. This paper specifically analyzes the white and non-white noise characteristics associated with the quantization errors of phase truncation in digital phasemeters. The error can be considered white noise under specific conditions, which power correlates with the resolution of quantizer and is uniformly distributed within the Nyquist frequency. However, when the signal frequency and sampling frequency are close to an integer multiple, the non-white noise caused by truncation can result in low-frequency phase noise. Additionally, artifacts may induce nonlinear phase errors. Introducing Gaussian dither synthesized by LFSRs can smooth the truncation process, thereby mitigating its impacts on phase measurement. The results indicate that for a 10 MHz signal under test, the noise floor of the phasemeter exceeds the requirement from 2 mHz to 0.1 Hz due to the integer multiple. After adding dither, the phase noise was optimized by 9.5 dB at 10 mHz, achieving the requirement of 1.3 $\rm{\upmu rad/Hz^{1/2}} \cdot \rm{NSF}$ from 0.1 mHz to 1 Hz in space gravitational wave detection. This demonstrates that adding dither can effectively suppress the low-frequency phase noise caused by truncation.
Figures


Figures from the paper (6 more)


Reference graph
Works this paper leans on
-
[1]
IntegratedCircuitDesignforHigh- Speed Frequency Synthesis
D.Foster,P.Calvin,andR.John. IntegratedCircuitDesignforHigh- Speed Frequency Synthesis. Artech, 2006
work page 2006
- [2]
-
[3]
K. Danzmann and A. Rüdiger. Lisa technology—concept, status, prospects. Classical and Quantum Gravity, 20:S1, 2003
work page 2003
-
[4]
J.Luo,L.S.Chen,H.Z.Duan,Y.G.Gong,S.Hu,J.Ji,Q.Liu,J.Mei, V. Milyukov, M. Sazhin, C. G. Shao, V. T. Toth, H. B. Tu, Y. Wang, H.C.YehY.Wang,M.S.Zhan,Y.Zhang,V.Zharov,andZ.B.Zhou. Tianqin: a space-borne gravitational wave detector.Classical and Quantum Gravity, 33:035010, 2016
work page 2016
-
[5]
W. R. Hu and Y. L. Wu. The taiji program in space for gravitational wave physics and the nature of gravity.National Science Review, 4:685–686, 2017
work page 2017
-
[6]
Y.G.Gong,J.Luo,andB.Wang.Conceptsandstatusofchinesespace gravitational wave detection projects.Nature Astronomy, 5:881–889, 2021
work page 2021
-
[7]
Demonstra- tionofthelisaphasemeasurementprinciple
O.Jennrich,R.T.Stebbins,P.L.Bender,andS.Pollack. Demonstra- tionofthelisaphasemeasurementprinciple. ClassicalandQuantum Gravity, 18:4159, 2001
work page 2001
-
[8]
Z. Luo, Z. Guo, G. Jin, Y. Wu, and W. Hu. A brief analysis to taiji: Science and technology.Results in Physics, 16:102918, 2020
work page 2020
Show all 31 references
-
[9]
Overview of the lisa phasemeter
D.Shaddock,B.Ware,P.G.Halverson,R.E.Spero,andB.Klipstein. Overview of the lisa phasemeter. AIP Conference Proceedings, 873:654–660, 2006
2006
-
[10]
Lisaphasemeter development
V.Wand,F.Guzmán,G.Heinzel,andK.Danzmann. Lisaphasemeter development. AIP Conference Proceedings, 873:689–696, 2006
2006
-
[11]
Gerberding, B
O. Gerberding, B. Sheard, I. Bykov, J. Kullmann, J. J. E. Delgado, K.Danzmann,andG.Heinzel. Phasemetercoreforintersatellitelaser heterodyne interferometry: modelling, simulations and experiments. Classical and Quantum Gravity, 30:235029, 2013
2013
-
[12]
Phasereadoutforsatelliteinterferometry .PhDthesis, Leibniz U., Hannover, 2014
O.Gerberding. Phasereadoutforsatelliteinterferometry .PhDthesis, Leibniz U., Hannover, 2014
2014
-
[13]
Gerberding, C
O. Gerberding, C. Diekmann, J. Kullmann, M. Tröbs, I. Bykov, S. Barke, N. C. Brause, J. J. Esteban Delgado, T. S. Schwarze, K. Danzmann J. Reiche, T. Rasmussen, T. V. Hansen, A. Enggaard, S. M. Pedersen, O. Jennrich, M. Suess, Z. Sodnik, and G. Heinzel. Readout for intersatell...
2015
-
[14]
Note: Inter-satellite laser range-rate measurement by using digital phase locked loop.Review of Scientific Instruments, 86:016106, 2015
Y.R.Liang,H.Z.Duan,X.L.Xiao,B.B.Wei,andH.C.Yeh. Note: Inter-satellite laser range-rate measurement by using digital phase locked loop.Review of Scientific Instruments, 86:016106, 2015
2015
-
[15]
C. H. Bode.Noise in the LISA phasemeter. PhD thesis, Leibniz U., Hannover, 2024
2024
-
[16]
Multi-frequency signalacquisitionandphasemeasurementinspacegravitationalwave detection
Q.T.Zhang,H.S.Liu,P.Dong,P.Li,andZ.R.Luo. Multi-frequency signalacquisitionandphasemeasurementinspacegravitationalwave detection. Review of Scientific Instruments, 95:054501, 2024
2024
-
[17]
Y. J. Feng, Y. Z. Jiang, G. Y. Xiao, L. Y. Chen, B. F. Lu, Z. L. Xv, and Y. R. Liang. Utilizing multi-point temperature sensing to evaluatethelowfrequencynoiseofphasemeterforintersatellitelaser interferometer. Review of Scientific Instruments, 95:104503, 2024
2024
-
[18]
X. G. Tian, X. Liu, H. Chen, and M. Y. Duan. Ddfs spurious signals due to amplitude quantization in absence of phase-accumulator trun- cation. JournalofSystemsEngineeringandElectronics ,20:485–492, 2009
2009
-
[19]
X. G. Tian, Zhang Z. L, and E. Y. Zhang. Spurious signals due to amplitude quantization in direct digital frequency synthesizers. Microelectronics Journal, 41:114–120, 2010
2010
-
[20]
Y. K. Rybin and T. A. Petlina. Basic metrological properties of electronic oscillators with direct digital synthesis. Measurement, 98:243–249, 2017
2017
-
[21]
Yamamoto
K. Yamamoto. Intersatellite clock synchronization and absolute rangingforgravitationalwavedetectioninspace .PhDthesis,Leibniz U., Hannover, 2023
2023
-
[22]
IEEE standard definitions ofphysicalquantitiesforfundamentalfrequencyandtimemetrology- random instabilities.IEEE Std 1139-2008, 1-35, 2009
IEEE Standards Coordinating Committee. IEEE standard definitions ofphysicalquantitiesforfundamentalfrequencyandtimemetrology- random instabilities.IEEE Std 1139-2008, 1-35, 2009
2008
-
[23]
B. C. Levy. Random Processes with Applications to Circuits and Communications. Springer, 2020
2020
-
[24]
Discrete-TimeSignalProcessing
A.V.OppenheimandR.W.Schafer. Discrete-TimeSignalProcessing. Pearson, 2009
2009
-
[25]
W. R. Bennett. Spectra of quantized signals. The Bell System Technical Journal, 27:446–472, 1948
1948
-
[26]
B. Widrow. A study of rough amplitude quantization by means of nyquistsamplingtheory. IRETransactionsonCircuitTheory ,3:266– 276, 1956
1956
-
[27]
B. Widrow. Statistical analysis of amplitude-quantized sampled- data systems. Transactions of the American Institute of Electrical Engineers, Part II: Applications and Industry, 79:555–568, 1961
1961
-
[28]
Sripad and D
A. Sripad and D. Snyder. A necessary and sufficient condition for quantization errors to be uniform and white.IEEE Transactions on Acoustics, Speech, and Signal Processing, 25:442–448, 1977
1977
-
[29]
Wissel, A
L. Wissel, A. Wittchen, T. S. Schwarze, M. Hewitson, G. Heinzel, and H. Halloin. Relative-intensity-noise coupling in heterodyne interferometers. Physical Review Applied, 17:024025, 2022
2022
-
[30]
H. T. Nicholas and H. Samueli. An analysis of the output spectrum of direct digital frequency synthesizers in the presence of phase- accumulator truncation. The 41st Annual Symposium on Frequency Control, 1987
1987
-
[31]
Widrow and I
B. Widrow and I. Kollár.Quantization Noise. Cambridge University Press, 2008. Page 7 of 7
2008
Reviewed August 7, 2026 · model on record in the stance chip above.
Discussion (0). Sign in to comment.