REVIEW 4 major objections 5 minor 41 references
Capability demonstration of a JEDI-based system for TEMPO assimilation: system description and evaluation
T0 review · 4 major / 5 minor · reviewed 2026-08-07 · deepseek-v4-flash
Pith's one-line read This paper demonstrates the first JEDI-based TEMPO NO2 assimilation with 4DEnVar and an EDA, improving column analyses and capturing diurnal variability while lowering surface NO2.
desk verdict First JEDI 4DEnVar+EDA cycling of hourly TEMPO NO2 is a credible integration milestone, but the column-improvement claim is overstated and the systematic negative surface increments may be a TEMPO-bias artifact. read the letter →
The pith
A machine-rendered reading of the paper's core claim, the machinery that carries it, and where it could break.
The reading
What carries the argument
The load-bearing mechanism is the fusion of 4DEnVar with EDA inside JEDI. 4DEnVar defines the assimilation cost function in the ensemble subspace, so background error covariances are flow-dependent and observations are matched against time-interpolated ensemble trajectories; this is what lets hourly TEMPO data act on all hours of a six-hour window without a tangent-linear or adjoint model. EDA runs an independent 4DEnVar analysis for each ensemble member with perturbed observations, perturbed meteorology from a replayed forecast ensemble, and sector-dependent multiplicative emissions perturbations, which keeps ensemble spread alive and provides a posterior uncertainty estimate. Around that core sit the UFO column retrieval operator, which maps model mixing ratios to tropospheric or total columns using the retrieval's averaging kernels and a priori profile; the SABER/BUMP covariance machinery with NICAS localization, configured with a horizontal localization radius growing from 100 km near the surface to 5000 km aloft and a vertical localization of 0.3 in eta coordinates; and the GEOS-CF replay configuration, which fixes meteorology while letting transport uncertainty enter through the ensemble. Ozone is deliberately not among the variables being optimized (the control vector), so all ozone changes in the analysis are produced by model chemistry responding to the NO2 increments.
What would settle it
Compare TEMPO tropospheric NO2 columns with collocated Pandora total-column NO2 and GCAS partial columns at the same places and times, stratified by hour, cloud fraction, and region over August 2023. If TEMPO shows a systematic morning high bias of the same sign and magnitude as the negative analysis increments, the surface NO2 degradation is a retrieval-bias artifact; if no such bias appears, the degradation points to a real model or vertical-representativeness error, and bias correction would still be needed but for a different reason.
Extended reading notes
Core claim
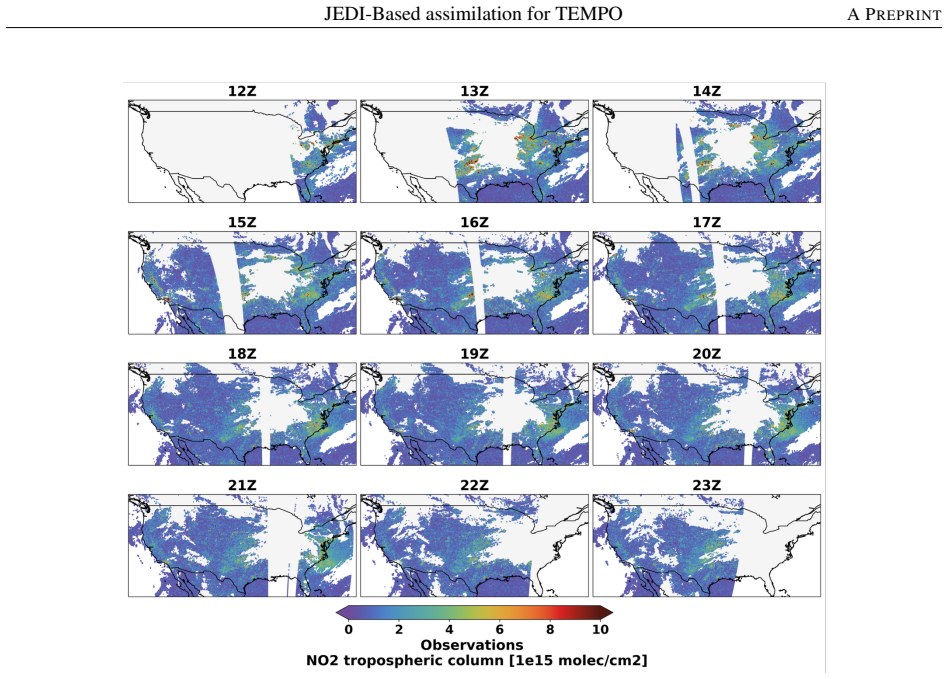
The paper's central claim is that a JEDI-based 4DEnVar system with a 32-member EDA can assimilate hourly TEMPO geostationary NO2 retrievals into GEOS-CF alongside daily TROPOMI retrievals, producing credible chemical analyses and demonstrating that weather-forecasting-grade assimilation technology transfers to air quality. In the August 2023 CONUS experiment, the analysis moves the modeled columns closer to the assimilated observations, spreads observational influence through the six-hour assimilation windows via ensemble trajectories, and brings the modeled morning NO2 peak closer to TEMPO. The dominant physical signature is a systematic negative increment in the lower troposphere: column assimilation removes NO2 near the surface, improving agreement with Pandora total columns and AEROMMA in situ NO2 and ozone, but degrading surface NO2 relative to AirNow. The paper flags that TEMPO may carry a high bias and that no variational bias correction is applied, so the surface degradation could be a bias artifact; it also notes the ozone improvement is chemically expected but achieved 'for the wrong reasons,' since ozone is not assimilated and the improvement follows from NO2 reductions in regimes where volatile organic compounds limit ozone production.
Load-bearing premise
The load-bearing premise is that the filtered TEMPO tropospheric NO2 columns are unbiased enough, and the uncertainty values attached to them are accurate enough, that pulling the model toward them improves the true atmospheric state; if TEMPO is biased high, the systematic negative surface increments and the degraded AirNow comparison are artifacts of that bias, not real corrections.
Editorial extensions
If this is right
- Hourly geostationary NO2 columns can be assimilated into a global chemical forecast at scale: the JEDI system improves the match to TEMPO and captures the morning NO2 peak across CONUS and all study regions.
- The generic column retrieval operator handles TEMPO, TROPOMI, GCAS, and Pandora in one framework, so assimilation and independent evaluation share the same observation operator infrastructure instead of separate post-processing tools.
- Column-only NO2 assimilation lowers surface NO2; if TEMPO is biased high, this is a bias artifact that calls for bias correction, and if the model is genuinely biased, it is a real correction that needs a surface constraint, and in either case the next step is jointly optimizing concentrations and emissions instead of columns alone.
- Ozone improves indirectly because lowering NO2 suppresses photochemical ozone in summer conditions where volatile organic compounds limit ozone production; this corrects the model's known positive ozone bias without adding ozone observations, which exposes VOC emission and photochemistry uncertainties.
- The forecast model dominates computational cost, so real-time operational use of TEMPO assimilation depends on reducing that cost; the paper identifies neural network model emulation as the active development path.
Reading between the lines
- A direct test of the TEMPO-bias hypothesis would be to rerun the August 2023 experiment with a Pandora-anchored bias correction for TEMPO columns: if the AirNow surface degradation vanishes, the negative surface increments are retrieval artifacts rather than model corrections.
- The same JEDI 4DEnVar-EDA setup is a natural platform for observing system simulation experiments that quantify how much hourly geostationary sampling adds over daily polar sampling for NOx emission inversions, a comparison the paper motivates but does not run.
- Because ozone enters only through chemistry, the reported ozone improvement is compensation rather than an independent constraint; assimilating ozone or VOC-sensitive observations alongside NO2 would separate genuine ozone increments from NO2-driven compensation.
- The replay configuration fixes meteorology, so the composition analysis cannot feed back into weather; a coupled meteorology-composition application would require extending the system beyond the demonstrated setup.
Editorial analysis
A structured set of objections, weighed in public.
Referee Report
Summary. The manuscript reports the first implementation of TEMPO tropospheric NO2 column assimilation in the JEDI framework, using 4DEnVar with an Ensemble of Data Assimilations (EDA) coupled to the GEOS-CF model. Hourly TEMPO and daily TROPOMI NO2 retrievals are cycled over CONUS for August 2023, and the analysis is evaluated against Pandora, AirNow, AEROMMA, and STAQS/GCAS observations. The authors demonstrate that the system can ingest high-frequency geostationary retrievals, reduce observation-minus-background residuals, and reproduce diurnal NO2 variability. They also report systematic negative near-surface NO2 increments that improve agreement with Pandora and AEROMMA but degrade comparisons with AirNow and GCAS, and they discuss mechanisms including possible TEMPO bias and the absence of bias correction. The central claim is feasibility of applying 4DEnVar+EDA to atmospheric composition, with a secondary claim that assimilation improves model performance in the column.
Significance. If the feasibility claim holds, this is a notable advance: it is, to my knowledge, the first demonstration of 4DEnVar combined with EDA for tropospheric composition assimilation, and it shows that a model-agnostic framework like JEDI can assimilate hourly geostationary observations with flow-dependent, ensemble-derived background errors. The manuscript is unusually candid in reporting degraded comparisons against independent datasets (GCAS and AirNow), which is a scientific strength. The system description is detailed enough to be reproduced in principle, and the independent evaluation across ground, aircraft, and satellite platforms is a model for subsequent GEO-AQ assimilation studies. However, the paper's accuracy claims about column improvements are not uniformly supported by the independent evaluation, and the absence of observational bias correction leaves a key mechanism for the systematic surface degradation unaddressed. With appropriate qualification or additional testing, this would be a valuable contribution to the field.
major comments (4)
- [Abstract and §4] The abstract claims that assimilation 'improves model performance in the column,' but this is not uniformly supported by the independent evaluation. Section 3.3.2 reports that the GCAS comparison is generally degraded (§14), and Section 3.3.3 reports degraded surface NO2 against AirNow. The column improvements are evident for Pandora rural/suburban sites and in the fit to the assimilated TEMPO/TROPOMI columns, but the GCAS partial-column degradation indicates that the improvement claim is dataset-dependent. I recommend either qualifying the claim to specific datasets or providing a synthesized evaluation that weighs the contradictory evidence.
- [§2.5 and §4] The observation perturbations in the EDA assume that reported retrieval errors are accurate, independent, and Gaussian. Geostationary retrievals typically have spatially and temporally correlated errors from common air-mass-factor, cloud, and albedo assumptions; using them at face value with a diagonal error model can overfit the correlated component. The paper itself notes in §4 that TEMPO may carry a high bias and that no VarBC is applied. If TEMPO columns are biased high, the systematic negative near-surface increments shown in Figures 9 and 10 could be artifacts of pulling the model toward a biased observational target, which would independently explain the degraded AirNow and GCAS comparisons. A sensitivity test with bias-corrected TEMPO columns or with inflated/correlated observation errors would directly test this, and should be reported before drawing conclusions about the accuracy of surface-level changes.
- [§3.1] The fit-to-observation metric (|OMB| - |OMA|, Figure 5) is an internal diagnostic: it verifies that the minimization reduced the cost function, not that the analysis is closer to the true atmospheric state. The text in §3.1 repeatedly interprets this metric as 'improvement' relative to observations. I recommend explicitly labeling these as consistency diagnostics and reserving accuracy statements for the independent evaluations in Section 3.3.
- [§3.4] The improved agreement with AirNow and AEROMMA ozone after assimilation is described in §3.4 as an improvement achieved 'for the wrong reasons,' because it results from lowering surface NO2 rather than from a physically better NO2 state. This is an honest and important caveat, but it undercuts the idea that the ozone improvement is an independent confirmation of assimilation skill. I recommend presenting the ozone result as a hypothesis-generating finding about model VOC/NOx biases, not as a validated benefit of the assimilation system, unless further evidence is provided.
minor comments (5)
- [Throughout] There are several typographical inconsistencies: 'TropOMI' should be 'TROPOMI' in Section 2.1.2, the title has a spacing issue in 'JEDI- BASED', and the CEOS reference contains 'Compositin' and 'Aeroas'. These should be corrected in a final polish.
- [§3.3.1] Figure 13 is described with colored lines ('blue line' and 'red line' in the text), but the caption does not identify which line corresponds to 32mem and which to noDA. Please add a legend or explicit caption labels.
- [§3.3.2] Figure 14 boxplots are not fully defined in the caption; for consistency with Figure 15, state what the box edges, whiskers, and median represent.
- [§2.3.3] The sentence '4DEnVar does not assimilate observations at their exact time' is ambiguous because the method does use observation times through time-interpolated ensemble trajectories. I recommend rewording to clarify that it does not perform a model integration to the exact observation time, but it does account for observation time.
- [§2.4 and §3.3.1] The manuscript reports model resolution inconsistently: GEOS-CF is described as ~25 km global in §2.4, while §3.3.1 refers to '1° and 0.25°' for the analysis and forecasting system. Please clarify which resolution is used for the assimilation control vector and which for the evaluation.
Circularity Check
Only minor circularity: OMB-OMA fit diagnostics are definitional; the central capability claim rests on independent evaluations.
-
self definitional
[Section 3.1, 'Observation-space analysis statistics', fit-to-observation metric definition]
"A fit-to-observation performance metric is defined as the difference of the absolute errors between observation-minus-background (OMB) and observation-minus-analysis (OMA). Positive values of this metric indicate that the assimilation has improved agreement with the observations (i.e., OMA is smaller than OMB), bringing the analysis closer to the assimilated data."
OMA is the output of the 4DEnVar minimization whose cost function contains exactly the squared observation-minus-analysis misfit for the assimilated TEMPO/TROPOMI columns. Therefore OMA being smaller than OMB in this metric is a property of the minimization, not an independent empirical result. The paper uses this only as a diagnostic sanity check and explicitly labels it as such, while the abstract's column-improvement claim is additionally supported by independent Pandora and aircraft comparisons. The step is definitional but not load-bearing for the central feasibility claim.
full rationale
The paper's central claim is a technical feasibility demonstration: first implementation of a JEDI-based 4DEnVar plus EDA system assimilating hourly TEMPO NO2 retrievals alongside TROPOMI into GEOS-CF. The evaluation suite includes independent datasets (AirNow surface, Pandora columns, AEROMMA in situ, STAQS/GCAS aircraft), none of which are inputs to the assimilation, so the main result is not defined by the assimilated observations. The only substantively circular element is the Section 3.1 fit-to-observation metric: |OMB|-|OMA| is positive by construction for assimilated observations because the analysis minimizes exactly that observation misfit; the paper itself calls this a diagnostic check. Self-citations are present (Barré et al. 2019 for EDA reducing inflation need; Abdi-Oskouei et al. 2022 for VOC-limited ozone regimes), but they are not load-bearing: the EDA spread is demonstrated in the experiment, and the VOC remark is a secondary interpretation. The paper transparently reports mixed independent results, including degradation against AirNow and GCAS, so no prediction is disguised as a fit. Overall circularity is minor and does not undermine the capability demonstration.
Assumptions & free parameters
free parameters (5)
- Horizontal localization radius (NICAS) =
100 km at surface to 5000 km at TOA
- Vertical localization scale (eta) =
0.3 uniform
- Emission perturbation magnitudes by sector =
Agriculture 75%, Energy 30%, Industry 30%, Residential 45%, Ships 40%, Solvents 50%, Traffic 35%, Waste 55%
- Emission spatial correlation lengths =
500 km for Agriculture, Ships, and Waste; 200 km for others
- Observation error standard deviations =
reported retrieval errors, assumed Gaussian
assumptions (6)
- standard math The 4DEnVar ensemble subspace spans the true background error covariance.
- domain assumption TEMPO and TROPOMI tropospheric NO2 retrievals are unbiased after the cloud fraction, SZA, and qa_value filters.
- domain assumption Observation and model errors are Gaussian, zero-mean, and independent for the EDA perturbations.
- domain assumption GEOS-FP replay meteorology and its ensemble represent transport uncertainty in the composition system.
- domain assumption The column retrieval operator correctly converts model NO2 to retrieval space using averaging kernels and a priori profiles.
- domain assumption The model's NO2-O3 photochemistry responds realistically to NO2 increments.
Cite this review
Pith. "Pith review of Capability demonstration of a JEDI-based system for TEMPO assimilation: system description and evaluation." pith.science (2026). https://pith.science/paper/YJ46RSEL
@misc{pith2026250607321,
  author       = {Pith},
  title        = {Pith review of: Capability demonstration of a JEDI-based system for TEMPO assimilation: system description and evaluation},
  year         = {2026},
  howpublished = {\url{https://pith.science/paper/YJ46RSEL}},
  note         = {Machine review of arXiv:2506.07321}
}
read the original abstract
The launch of the Tropospheric Emissions: Monitoring of Pollution (TEMPO) mission in 2023 marked a new era in air quality monitoring by providing high-frequency, geostationary observations of column NO2 across North America. In this study, we present the first implementation of a TEMPO NO2 data assimilation system using the Joint Effort for Data assimilation Integration (JEDI) framework. Leveraging a four-dimensional ensemble variational (4DEnVar) approach and an Ensemble of Data Assimilations (EDA), we demonstrate a novel capability to assimilate hourly NO2 retrievals from TEMPO alongside polar-orbiting TROPOMI data into NASA's GEOS Composition Forecast (GEOS-CF) model. The system is evaluated over the CONUS region for August 2023, using a suite of independent measurements including Pandora spectrometers, AirNow surface stations, and aircraft-based observations from AEROMMA and STAQS field campaigns. Results show that the assimilation system successfully integrates geostationary NO2 observations, improves model performance in the column, and captures diurnal variability. However, assimilation also leads to systematic reductions in surface NO2 levels, improving agreement with some datasets (e.g., Pandora, AEROMMA) but degrading comparisons with others (e.g., AirNow). These findings highlight the importance of joint evaluation across platforms and motivate further development of dual-concentration emission assimilation schemes. While the system imposes high computational costs, primarily from the forecast model, ongoing efforts to integrate AI-based model emulators offer a promising path toward scalable, real-time assimilation of geostationary atmospheric composition data.
Figures


Figures from the paper (15 more)


Reference graph
Works this paper leans on
-
[1]
CEOS Atmospheric Composition Constellation . A Geostationary Satellite Constellation for Observing Global Air Quality : An International Path Forward , 2011. URL https://ceos.org/observations/documents/AC-VC_Geostationary-Cx-for-Global-AQ-final_Apr2011.pdf
work page 2011
-
[2]
CEOS Atmospheric Compositin Virtual Constellation and CEOS Working Group on Calibration and Validation. Geostationary Satellite Constellation for Observing Global Air Quality : Geophysical Validation Needs , October 2019. URL https://ceos.org/observations/documents/GEO_AQ_Constellation_Geophysical_Validation_Needs_1.1_2Oct2019.pdf
work page 2019
-
[3]
Jérôme Barré, David Edwards, Helen Worden, Arlindo Da Silva, and William Lahoz. On the feasibility of monitoring carbon monoxide in the lower troposphere from a constellation of Northern Hemisphere geostationary satellites. ( Part 1). Atmospheric Environment, 113: 0 63--77, July 2015. ISSN 13522310. doi:10.1016/j.atmosenv.2015.04.069. URL https://linkingh...
-
[4]
Jérôme Barré, David Edwards, Helen Worden, Avelino Arellano, Benjamin Gaubert, Arlindo Da Silva, William Lahoz, and Jeffrey Anderson. On the feasibility of monitoring carbon monoxide in the lower troposphere from a constellation of northern hemisphere geostationary satellites: Global scale assimilation experiments ( Part II ). Atmospheric Environment, 140...
-
[5]
J. Fishman, L. T. Iraci, J. Al-Saadi, K. Chance, F. Chavez, M. Chin, P. Coble, C. Davis, P. M. DiGiacomo, D. Edwards, A. Eldering, J. Goes, J. Herman, C. Hu, D. J. Jacob, C. Jordan, S. R. Kawa, R. Key, X. Liu, S. Lohrenz, A. Mannino, V. Natraj, D. Neil, J. Neu, M. Newchurch, K. Pickering, J. Salisbury, H. Sosik, A. Subramaniam, M. Tzortziou, J. Wang, and ...
work page 2012
-
[6]
Jay Al-Saadi, Mian Chin, Arlindo da Silva, David Edwards, Greg Frost, Daven Henze, Laura Iraci, Daniel Jacob, Antonio Mannino, Vijay Natraj, Brad Pierce, Joe Salisbury, and Jun Wang. Advancing the Science of Both Coastal Ocean Biophysics and Atmospheric Pollution Chemistry : A final report to the NASA Earth Science Division by the GEO - CAPE team, 2018
work page 2018
-
[7]
Jhoon Kim, Ukkyo Jeong, Myoung-Hwan Ahn, Jae H. Kim, Rokjin J. Park, Hanlim Lee, Chul Han Song, Yong-Sang Choi, Kwon-Ho Lee, Jung-Moon Yoo, Myeong-Jae Jeong, Seon Ki Park, Kwang-Mog Lee, Chang-Keun Song, Sang-Woo Kim, Young Joon Kim, Si-Wan Kim, Mijin Kim, Sujung Go, Xiong Liu, Kelly Chance, Christopher Chan Miller, Jay Al-Saadi, Ben Veihelmann, Pawan K. ...
work page 2020
-
[8]
Edwards, Sara Martínez-Alonso, Duseong S
David P. Edwards, Sara Martínez-Alonso, Duseong S. Jo, Ivan Ortega, Louisa K. Emmons, John J. Orlando, Helen M. Worden, Jhoon Kim, Hanlim Lee, Junsung Park, and Hyunkee Hong. Quantifying the diurnal variation in atmospheric NO _ 2 from Geostationary Environment Monitoring Spectrometer ( GEMS ) observations. Atmospheric Chemistry and Physics, 24 0 (15): 0 ...
Show all 41 references
-
[9]
Zoogman, X
P. Zoogman, X. Liu, R.M. Suleiman, W.F. Pennington, D.E. Flittner, J.A. Al-Saadi, B.B. Hilton, D.K. Nicks, M.J. Newchurch, J.L. Carr, S.J. Janz, M.R. Andraschko, A. Arola, B.D. Baker, B.P. Canova, C. Chan Miller, R.C. Cohen, J.E. Davis, M.E. Dussault, D.P. Edwards, J. Fishman,...
2017
-
[10]
Henze, Arthur P
Chia-Hua Hsu, Daven K. Henze, Arthur P. Mizzi, Gonzalo González Abad, Jian He, Colin Harkins, Aaron R. Naeger, Congmeng Lyu, Xiong Liu, Christopher Chan Miller, R. Bradley Pierce, Matthew S. Johnson, and Brian C. McDonald. An Observing System Simulation Experiment Analysis of ...
2024 doi
-
[11]
Miyazaki, T
K. Miyazaki, T. Sekiya, D. Fu, K. W. Bowman, S. S. Kulawik, K. Sudo, T. Walker, Y. Kanaya, M. Takigawa, K. Ogochi, H. Eskes, K. F. Boersma, A. M. Thompson, B. Gaubert, J. Barre, and L. K. Emmons. Balance of Emission and Dynamical Controls on Ozone During the Korea ‐ United Sta...
2019 doi
-
[12]
Bowman, Keiya Yumimoto, Thomas Walker, and Kengo Sudo
Kazuyuki Miyazaki, Kevin W. Bowman, Keiya Yumimoto, Thomas Walker, and Kengo Sudo. Evaluation of a multi-model, multi-constituent assimilation framework for tropospheric chemical reanalysis. Atmospheric Chemistry and Physics, 20 0 (2): 0 931--967, January 2020. ISSN 1680-7316....
2020 doi
-
[13]
James, Curtis R
Eric P. James, Curtis R. Alexander, David C. Dowell, Stephen S. Weygandt, Stanley G. Benjamin, Geoffrey S. Manikin, John M. Brown, Joseph B. Olson, Ming Hu, Tatiana G. Smirnova, Terra Ladwig, Jaymes S. Kenyon, and David D. Turner. The High - Resolution Rapid Refresh ( HRRR ): ...
2022 doi
-
[14]
Benjamin, Stephen S
Stanley G. Benjamin, Stephen S. Weygandt, John M. Brown, Ming Hu, Curtis R. Alexander, Tatiana G. Smirnova, Joseph B. Olson, Eric P. James, David C. Dowell, Georg A. Grell, Haidao Lin, Steven E. Peckham, Tracy Lorraine Smith, William R. Moninger, Jaymes S. Kenyon, and Geoffrey...
2016 doi
-
[15]
The CAMS reanalysis of atmospheric composition
Antje Inness, Melanie Ades, Anna Agustí-Panareda, Jérôme Barré, Anna Benedictow, Anne-Marlene Blechschmidt, Juan Jose Dominguez, Richard Engelen, Henk Eskes, Johannes Flemming, Vincent Huijnen, Luke Jones, Zak Kipling, Sebastien Massart, Mark Parrington, Vincent-Henri Peuch, M...
2019 doi
-
[16]
Sector‐ Based Top ‐ Down Estimates of NOx , SO2 , and CO Emissions in East Asia
Zhen Qu, Daven K Henze, Helen M Worden, Zhe Jiang, Benjamin Gaubert, Nicolas Theys, and Wei Wang. Sector‐ Based Top ‐ Down Estimates of NOx , SO2 , and CO Emissions in East Asia . Geophysical Research Letters, 49, 2022. doi:10.1029/2021GL096009
2022 doi
-
[17]
The Joint Effort for Data Assimilation Integration ( JEDI )
Yannick Trémolet and Thomas Auligné. The Joint Effort for Data Assimilation Integration ( JEDI ). JCSDA Quarterly Newsletter, 0 (66): 0 1--5, 2020. doi:10.25923/RB19-0Q26. URL https://repository.library.noaa.gov/view/noaa/22752. Publisher: Joint Center for Satellite Data Assim...
2020 doi
-
[18]
Zhiquan Liu, Chris Snyder, Jonathan J. Guerrette, Byoung-Joo Jung, Junmei Ban, Steven Vahl, Yali Wu, Yannick Trémolet, Thomas Auligné, Benjamin Ménétrier, Anna Shlyaeva, Stephen Herbener, Emily Liu, Daniel Holdaway, and Benjamin T. Johnson. Data assimilation for the Model for ...
2022
-
[19]
Guerrette, Zhiquan Liu, Chris Snyder, Byoung-Joo Jung, Craig S
Jonathan J. Guerrette, Zhiquan Liu, Chris Snyder, Byoung-Joo Jung, Craig S. Schwartz, Junmei Ban, Steven Vahl, Yali Wu, Ivette Hernández Baños, Yonggang G. Yu, Soyoung Ha, Yannick Trémolet, Thomas Auligné, Clementine Gas, Benjamin Ménétrier, Anna Shlyaeva, Mark Miesch, Stephen...
2023
-
[20]
Martin, Andrew Tangborn, Shobha Kondragunta, and Daryl T
Bo Huang, Mariusz Pagowski, Samuel Trahan, Cory R. Martin, Andrew Tangborn, Shobha Kondragunta, and Daryl T. Kleist. JEDI - Based Three - Dimensional Ensemble - Variational Data Assimilation System for Global Aerosol Forecasting at NCEP . Journal of Advances in Modeling Earth ...
2023 doi
-
[21]
The prototype NOAA Aerosol Reanalysis version 1.0: description of the modeling system and its evaluation
Shih-Wei Wei, Mariusz Pagowski, Arlindo Da Silva, Cheng-Hsuan Lu, and Bo Huang. The prototype NOAA Aerosol Reanalysis version 1.0: description of the modeling system and its evaluation. Geoscientific Model Development, 17 0 (2): 0 795--813, January 2024. ISSN 1991-9603. doi:10...
2024 doi
-
[22]
N. E. Bowler, A. M. Clayton, M. Jardak, P. M. Jermey, A. C. Lorenc, M. A. Wlasak, D. M. Barker, G. W. Inverarity, and R. Swinbank. The effect of improved ensemble covariances on hybrid variational data assimilation. Quarterly Journal of the Royal Meteorological Society, 143 0 ...
2017 doi
-
[23]
Keller, K
Christoph A. Keller, K. Emma Knowland, Bryan N. Duncan, Junhua Liu, Daniel C. Anderson, Sampa Das, Robert A. Lucchesi, Elizabeth W. Lundgren, Julie M. Nicely, Eric Nielsen, Lesley E. Ott, Emily Saunders, Sarah A. Strode, Pamela A. Wales, Daniel J. Jacob, and Steven Pawson. Des...
2021 doi
-
[24]
Isaksen, Massimo Bonavita, Roberto Buizza, Mike Fisher, J
L. Isaksen, Massimo Bonavita, Roberto Buizza, Mike Fisher, J. Haseler, Martin Leutbecher, and Laure Raynaud. Ensemble of data assimilations at ECMWF , December 2010. URL https://www.ecmwf.int/node/10125. Issue: 636 Pages: 45 Publication Title: ECMWF Technical Memoranda
2010
-
[25]
Nowlan, Xiong Liu, James W
Caroline R. Nowlan, Xiong Liu, James W. Leitch, Kelly Chance, Gonzalo González Abad, Cheng Liu, Peter Zoogman, Joshua Cole, Thomas Delker, William Good, Frank Murcray, Lyle Ruppert, Daniel Soo, Melanie B. Follette-Cook, Scott J. Janz, Matthew G. Kowalewski, Christopher P. Loug...
2013
-
[26]
Nowlan, Gonzalo Gonzalez Abad, Xiong Liu, Huiqun Wang , and Kelly Chance
Caroline R. Nowlan, Gonzalo Gonzalez Abad, Xiong Liu, Huiqun Wang , and Kelly Chance. TEMPO Nitrogen Dioxide Retrieval Algorithm Theoretical Basis Document , 2025. URL https://www.earthdata.nasa.gov/apt/documents/tempo-nitrogen-dioxide-retrieval/v1.0. Publisher: NASA Algorithm...
2025
-
[27]
J. H. G. M. van Geffen, H. J. Eskes, K. F. Boersma, and J. P. Veefkind. TROPOMI ATBD of the total and tropospheric NO2 data products, July 2022. URL https://sentinel.esa.int/documents/247904/2476257/Sentinel-5P-TROPOMI-ATBD-NO2-data-products
2022
-
[28]
Veefkind, I
J.P. Veefkind, I. Aben, K. McMullan, H. Förster, J. De Vries, G. Otter, J. Claas, H.J. Eskes, J.F. De Haan, Q. Kleipool, M. Van Weele, O. Hasekamp, R. Hoogeveen, J. Landgraf, R. Snel, P. Tol, P. Ingmann, R. Voors, B. Kruizinga, R. Vink, H. Visser, and P.F. Levelt. TROPOMI on t...
2012
-
[29]
NO _ 2 column amounts from ground-based Pandora and MFDOAS spectrometers using the direct-sun DOAS technique: Intercomparisons and application to OMI validation
Jay Herman, Alexander Cede, Elena Spinei, George Mount, Maria Tzortziou, and Nader Abuhassan. NO _ 2 column amounts from ground-based Pandora and MFDOAS spectrometers using the direct-sun DOAS technique: Intercomparisons and application to OMI validation. Journal of Geophysica...
2009 doi
-
[30]
Jing Gao and Brian C. O’Neill. Mapping global urban land for the 21st century with data-driven simulations and Shared Socioeconomic Pathways . Nature Communications, 11 0 (1): 0 2302, May 2020. ISSN 2041-1723. doi:10.1038/s41467-020-15788-7. URL https://www.nature.com/articles...
2020 doi
-
[31]
AEROMMA : Atmospheric Emission and Reactions Observed from Megacities and Marine Aeroas
NOAA-CSL. AEROMMA : Atmospheric Emission and Reactions Observed from Megacities and Marine Aeroas . URL https://csl.noaa.gov/projects/aeromma/
-
[32]
STAQS : Synergistic TEMPO Air Quality Science
NASA. STAQS : Synergistic TEMPO Air Quality Science . URL https://www-air.larc.nasa.gov/cgi-bin/ArcView/staqs
-
[33]
Kowalewski and Scott J
Matthew G. Kowalewski and Scott J. Janz. Remote sensing capabilities of the GEO - CAPE airborne simulator. In Earth observing systems XIX , volume 9218, pages 496--507, San Diego, California, United States, September 2014. doi:10.1117/12.2062058. URL http://proceedings.spiedig...
2014 doi
-
[34]
Normalized Interpolated Convolution from an Adaptive Subgrid documentation, 2020
Benjamin Ménétrier. Normalized Interpolated Convolution from an Adaptive Subgrid documentation, 2020. URL https://github.com/benjaminmenetrier/nicas_doc/blob/master/nicas_doc.pdf
2020
-
[35]
Kleist and Kayo Ide
Daryl T. Kleist and Kayo Ide. An OSSE - Based Evaluation of Hybrid Variational – Ensemble Data Assimilation for the NCEP GFS . Part II : 4DEnVar and Hybrid Variants . Monthly Weather Review, 143 0 (2): 0 452--470, February 2015. ISSN 0027-0644, 1520-0493. doi:10.1175/MWR-D-13-...
2015 doi
-
[36]
Historical (1750–2014) anthropogenic emissions of reactive gases and aerosols from the Community Emissions Data System ( CEDS )
Rachel M Hoesly, Steven J Smith, Leyang Feng, Zbigniew Klimont, Greet Janssens-Maenhout, Tyler Pitkanen, Jonathan J Seibert, Linh Vu, Robert J Andres, Ryan M Bolt, Tami C Bond, Laura Dawidowski, Nazar Kholod, June-ichi Kurokawa, Meng Li, Liang Liu, Zifeng Lu, Maria Cecilia P M...
2014
-
[37]
C. A. Keller, M. S. Long, R. M. Yantosca, A. M. Da Silva, S. Pawson, and D. J. Jacob. HEMCO v1.0: a versatile, ESMF -compliant component for calculating emissions in atmospheric models. Geoscientific Model Development, 7 0 (4): 0 1409--1417, July 2014. ISSN 1991-9603. doi:10.5...
2014 doi
-
[38]
Jacob, Elizabeth W
Haipeng Lin, Daniel J. Jacob, Elizabeth W. Lundgren, Melissa P. Sulprizio, Christoph A. Keller, Thibaud M. Fritz, Sebastian D. Eastham, Louisa K. Emmons, Patrick C. Campbell, Barry Baker, Rick D. Saylor, and Raffaele Montuoro. Harmonized Emissions Component ( HEMCO ) 3.0 as a ...
2021
-
[39]
Oman, Susan E
Clara Orbe, Luke D. Oman, Susan E. Strahan, Darryn W. Waugh, Steven Pawson, Lawrence L. Takacs, and Andrea M. Molod. Large- Scale Atmospheric Transport in GEOS Replay Simulations . Journal of Advances in Modeling Earth Systems, 9 0 (7): 0 2545--2560, 2017. ISSN 1942-2466. doi:...
2017 doi
-
[40]
Emission optimisations first attempt based on the Ensemble of Data Assimilation for atmospheric composition, June 2019
Jérôme Barré, Sebastien Massart, Melanie Ades, Luke Jones, and Richard Engelen. Emission optimisations first attempt based on the Ensemble of Data Assimilation for atmospheric composition, June 2019. URL https://www.ecmwf.int/sites/default/files/elibrary/2019/19085-emission-op...
2019
-
[41]
Stanier, Megan Christiansen, Gabriele Pfister, R
Maryam Abdi-Oskouei, Behrooz Roozitalab, Charles O. Stanier, Megan Christiansen, Gabriele Pfister, R. Bradley Pierce, Brian C. McDonald, Zac Adelman, Mark Janseen, Angela F. Dickens, and Gregory R. Carmichael. The Impact of Volatile Chemical Products , Other VOCs , and NOx on ...
2022 doi
Reviewed August 7, 2026 · model on record in the stance chip above.
Discussion (0). Sign in to comment.