REVIEW 2 major objections 5 minor 23 references
Integrating tumor burden with survival outcome for treatment effect evaluation in oncology trials
T0 review · 2 major / 5 minor · reviewed 2026-08-07 · deepseek-v4-flash
Pith's one-line read One utility score captures tumor burden and survival effects.
desk verdict A promising composite endpoint undermined by a simulation that does not follow the fitted model; needs correction before the claims can be assessed. read the letter →
The pith
A machine-rendered reading of the paper's core claim, the machinery that carries it, and where it could break.
The reading
What carries the argument
The central object is the utility function $u_i(t)=m_i(t)\mathbf{1}(t\le T_i)+\Gamma\mathbf{1}(t>T_i)$, whose definite integral $U_i=\int_0^{L_i}u_i(t)\,dt$ forms the composite endpoint. The tumor burden trajectory $m_i(\psi)$ is modeled as a quadratic in scaled time $\psi_{ij}=t_{ij}/T_i$ with random effects, and the survival sub-model is exponential with hazard $\lambda_i=\exp(\gamma_A A_i+\gamma_X^\top X_i)$. Data augmentation draws censored event times $T_i$ from their posterior, allowing closed-form computation of $U_i$ as the sum of a tumor-burden AUC and a survival AUC $\Gamma(L_i-T_i)\mathbf{1}(T_i<L_i)$; Bayesian bootstrap weights estimate the variance for Wald tests.
What would settle it
Simulate trials where the true tumor burden trajectory is not quadratic in scaled time — for example, a steep early drop followed by a plateau — fit the proposed quadratic model, and check whether the total-AUC test keeps Type I error near the nominal level and the ATE estimate stays unbiased. If bias or error inflation appears, the estimand's validity under misspecification is refuted; the paper currently provides no such robustness check or real-data validation.
Extended reading notes
Core claim
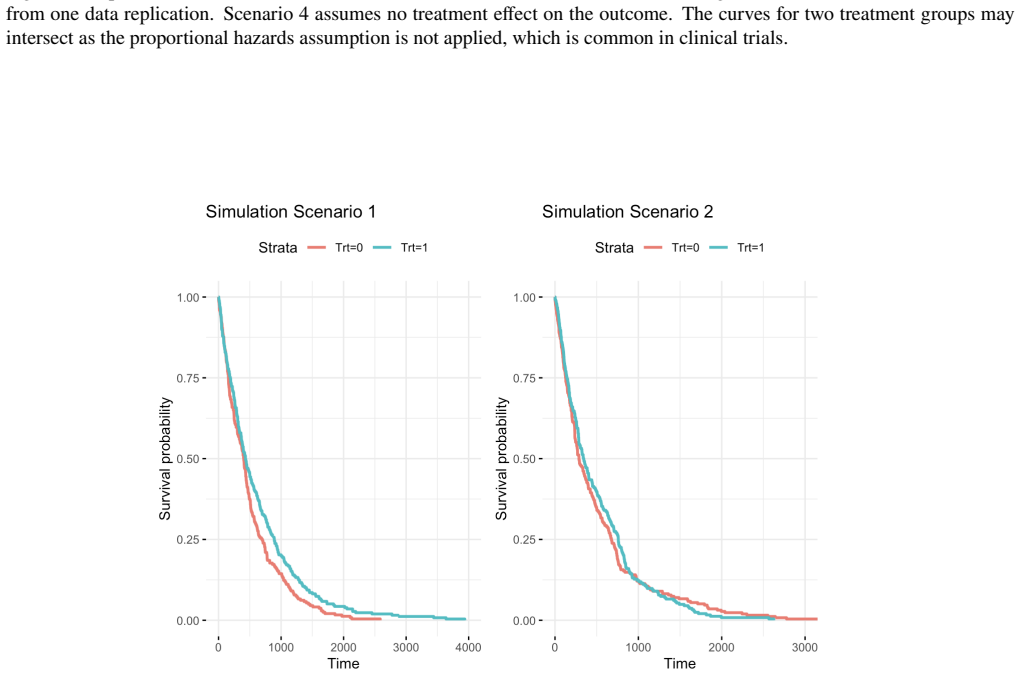
The paper's discovery is a new estimand and estimation procedure: define each patient's utility as the tumor burden trajectory before death or progression and a fixed penalty $\Gamma$ afterward, integrate it over the study window, and take the average treatment effect as the difference in these integrals between arms. The joint model factorizes the likelihood into an exponential survival sub-model and a longitudinal sub-model where tumor burden is quadratic in time scaled by the patient's event time, with censored event times imputed by data augmentation. The endpoint decomposes exactly into a tumor-burden AUC and a survival AUC equal to $\Gamma$ times the post-event time, linking the composite to restricted mean survival time. The authors show by simulation that Wald tests on the total AUC control Type I error and that the component tests behave as expected, apart from a propagation of survival effects into the tumor-burden test when only survival is affected.
Load-bearing premise
The method assumes each patient's true tumor burden follows a quadratic curve when plotted against time scaled by their true event time, and that censored event times can be imputed from this model; if the real trajectory is not quadratic, the estimated treatment effect is biased.
Editorial extensions
If this is right
- Early-phase oncology trials can summarize both tumor response and progression-free survival in one pre-specified estimand, reducing the need to choose between biomarker and survival endpoints.
- The decomposition into TBAUC and SAUC lets analysts attribute a treatment effect to tumor shrinkage, survival benefit, or both, which is helpful for go/no-go decisions.
- The closed-form integrals and posterior data augmentation keep computation tractable, so the method is feasible in the small samples typical of phase II studies.
- The estimand aligns with the ICH E9 (R1) composite-strategy framework, giving a regulatory path toward using it as a secondary or confirmatory endpoint.
Reading between the lines
- The paper's reliance on a quadratic-in-scaled-time trajectory is the main fragility; a natural stress test is to simulate from non-quadratic trajectories (e.g., a two-phase or spline curve) and check whether the total-AUC test keeps its Type I error and low bias.
- The Scenario 3 inflation in the tumor-burden test suggests the component tests are not independent when the joint factorization conditions on survival; users should interpret them as descriptive rather than as separate confirmatory tests.
- Sensitivity to the choice of $\Gamma$ is unexplored; for large $\Gamma$ the endpoint approaches a survival-only estimand, so reporting results across a clinically motivated range of $\Gamma$ would strengthen practical use.
- A real-data application with RECIST measurements would be the decisive next step, since simulations are generated under the same functional form the model assumes.
Editorial analysis
A structured set of objections, weighed in public.
Referee Report
Summary. The paper proposes a Bayesian utility-based composite endpoint for early-phase oncology trials. For each patient, a utility function u_i(t) equals a modeled tumor burden trajectory m_i(t) before the true event time T_i and a constant Gamma after T_i; the endpoint U_i is the integral of u_i over a follow-up window [0,L_i]. The joint model factorizes into an exponential survival sub-model and a longitudinal sub-model in which tumor burden is quadratic in scaled time psi_ij = t_ij/T_i, with censoring handled by data augmentation. The average treatment effect ATE = E[U|A=1] - E[U|A=0] is estimated from posterior draws, and Wald-type tests are proposed for the TBAUC, SAUC, and total AUC components. A simulation study with four scenarios is used to claim controlled Type I error rates for the proposed tests.
Significance. The proposed estimand is an interesting attempt to operationalize a composite endpoint in the spirit of ICH E9(R1), and the analytic integration for TBAUC in Eq. (16) is clean and computationally convenient. The use of the Bayesian bootstrap to account for posterior variance is also reasonable. However, the manuscript's central empirical claim rests on a simulation study that is internally inconsistent with the stated model, and the component-wise tests do not isolate the effects their labels imply. The paper would make a useful contribution if these issues were resolved, but in its current form the evidence for controlled Type I error is not valid.
major comments (2)
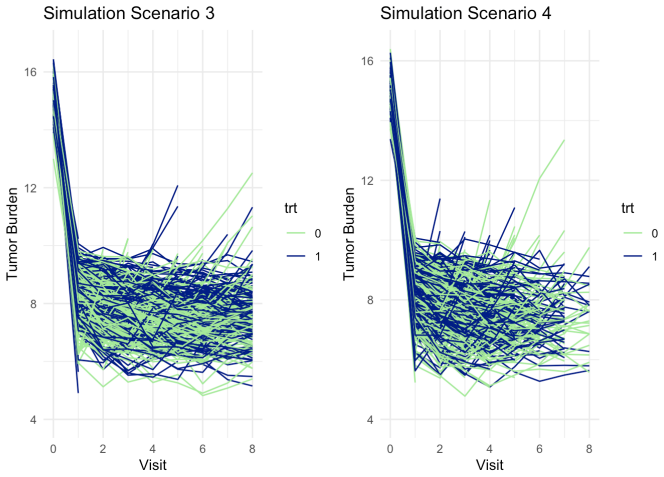
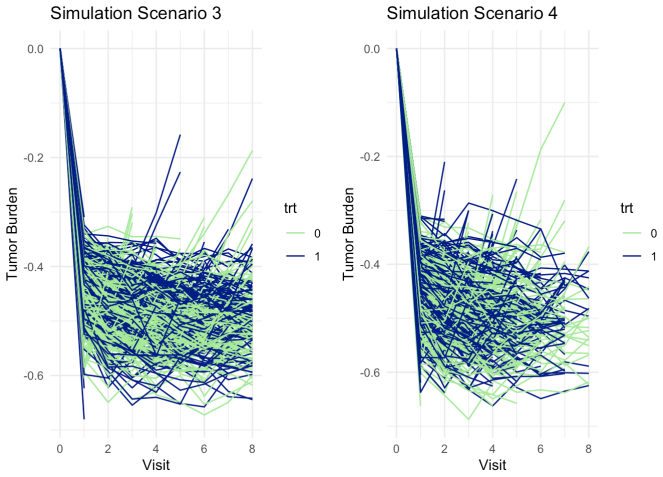
- [6.1.3, 4.2, Eq. (11)] Section 6.1.3 simulates Y_ij using psi_ij = t_ij/S_i with S_i = min(T_i,C_i), whereas the model in Section 4.2 and the likelihood in Eq. (11) use psi_ij = t_ij/T_i with T_i the true event time. For censored patients, S_i = C_i < T_i, so the generated trajectory is quadratic in t/C_i while the fitted model treats it as quadratic in t/T_i and imputes T_i > C_i. In addition, the baseline measurement Y_i0 is generated as N(15,0.5) independently of X_i and A_i, while Eq. (9) implies E[Y_i0 | X_i,A_i] = beta_X X_i + beta_A A_i, which is approximately 9 under the simulation settings. Thus the simulated data are not a draw from the fitted model even at baseline, and the rejection rates in Table 3 cannot be interpreted as frequentist operating characteristics of the proposed procedure. The simulation must be re-run with the longitudinal model used for inference, or the model must be changed to match the data generation, and the paper should clarify whether baseline measurements are included in the likelihood.
- [6.2, 6.3, Eq. (16), Table 3] In Scenario 3, the null hypothesis H_TB: theta_TB = 0 is false by construction even though beta_A = 0. The TBAUC estimand in Eq. (16) integrates the trajectory up to min(L,T_i) and scales time by T_i, so E[TBAUC|A] depends on the survival distribution through T_i. With gamma_A = -0.75, the treatment arm has a different T_i distribution, and therefore theta_TB is nonzero. The observed rejection rate of 0.062 is thus the power of the test against a true alternative, not a Type I error rate. More generally, the labels 'longitudinal AUC only' and 'survival AUC only' in Table 1 are misleading: TBAUC is not a pure longitudinal effect, and SAUC is not a pure survival effect, because the posterior distribution of censored T_i is influenced by the longitudinal model. The paper should either redefine these hypotheses in terms of the structural coefficients (beta_A, gamma_A) or clearly state that the tests are for composite estimands whose null values are not implied by the absence of a coefficient-level effect.
minor comments (5)
- [Table 1 and Section 6.3] Table 1 states the alternatives as H_A: theta > 0 for all three tests, but Section 6.3 describes the tests as one-sided left-tailed. With the sign convention that beneficial treatment reduces tumor burden and prolongs survival, the relevant alternative is theta < 0. Please reconcile the table and the text so that the reported rejection rates are interpretable.
- [Abstract and Section 6.3] The phrase 'relatively controlled Type I error rates' is vague; in Scenario 4 the one-sided rejection rates are 0.006, 0.020, and 0.010, which are far below the nominal 0.025. The authors should discuss whether this conservatism is a feature of the method and what its implications are for power.
- [Section 3] The statement that the survival AUC contribution is 'Gamma times one minus the restricted mean survival time' is only exact when L_i is a common constant; otherwise the relevant quantity is Gamma * E[(L_i - T_i) I(T_i < L_i)]. Please clarify this point.
- [Section 5.2] The variance estimators are defined as variances across posterior iterations of Bayesian bootstrap weighted averages, but the text does not explicitly state that a fresh Dirichlet(1_{n_a}) weight vector is drawn at each iteration q. Please make this explicit for reproducibility.
- [References and figure captions] The reference 'Group, I.E.W. et al.' should be replaced with the proper citation of the ICH E9(R1) addendum, and the figure captions describing 'administrative censoring' should be harmonized with Section 6.1.2, which generates exponential censoring times.
Circularity Check
Partial self-definitional circularity in the tumor-burden-AUC null hypothesis; simulation misspecification noted as separate validity threat.
-
self definitional
[Section 6.3, Table 3; Section 5.2, Table 1 (H_TB^0); Eq. (16)]
"In Scenario 3, where no treatment effect exists in the longitudinal model, we would expect the rejection rate for the one-sided test under the null hypothesis of no treatment effect on tumor burden AUC to be around 0.025. However, Table 3 shows a higher-than-expected rejection rate of 0.062 for the tumor burden AUC. This is due to the joint distribution of longitudinal and survival data being decomposed into a survival model and a longitudinal model conditional on survival data."
The 'tumor burden AUC' estimand θ_TB is defined via Eq. (16) as a between-arm contrast of E[∫_0^{min(L_i,T_i)} (β_X X_i + β_A A_i + b_1i t/T_i + b_2i t^2/T_i^2) dt]. The integration limit min(L_i,T_i) and the denominators T_i make θ_TB a function of the survival time T_i. Under Scenario 3's survival effect (γ_A=-0.75), the distribution of T_i differs by arm even though β_A=0, so θ_TB≠0 by construction. The paper's attribution of the 0.062 rejection to effect 'propagat[ing] into the longitudinal model' mislabels a definitional property of the estimand. The null hypothesis H_TB^0: θ_TB=0 is not a test of 'no treatment effect in the longitudinal model'; the rejection is forced by the estimand's self-defined dependence on survival.
full rationale
The core estimation strategy—a Bayesian joint model of longitudinal tumor burden and survival, with the utility endpoint U_i and ATE contrast—is not circular: U_i is an externally defined functional of the latent trajectory m_i(t) and event time T_i, and the posterior computation via Stan is a standard model-based estimator. There are no load-bearing self-citations or imported uniqueness theorems. However, one step in the simulation evidence is self-definitional: the Scenario 3 test of H_TB^0: θ_TB=0 is not a null test for the longitudinal treatment effect, because θ_TB (Eq. 16) includes T_i in the integration limit and integrand; the 0.062 rejection rate is a real effect of the estimand's definition, not a propagation artifact in the longitudinal sub-model. Additionally, a separate non-circular validity threat: Section 6.1.3 generates Y_ij with ψ_ij = t_ij/S_i (S_i=min(T_i,C_i)), while the likelihood in Eq. (11) and Eq. (8) use ψ_ij = t_ij/T_i with T_i the true event time; for censored subjects these differ, making the longitudinal sub-model misspecified in every replication. This undermines the simulation's Type I error claim but is an inconsistency, not a reduction of a prediction to its inputs. Overall, the central method has independent content, so the circularity score is moderate (4/10).
Assumptions & free parameters
free parameters (1)
- Gamma (post-event utility weight) =
0.5 in simulations
assumptions (5)
- domain assumption Time-to-event follows an exponential distribution with hazard exp(gamma_A A + gamma_X X)
- domain assumption Given observed covariate history, censoring and visit times are independent of true event time and future longitudinal measurements
- ad hoc to paper Longitudinal tumor burden trajectory is quadratic in scaled time psi=t/T_i with subject-specific random effects
- domain assumption Missing tumor burden measurements are missing at random
- domain assumption Parameters have independent priors, but the specific prior distributions are not stated
invented entities (1)
-
Utility-based composite endpoint U_i = integral of u_i(t) dt
Cite this review
Pith. "Pith review of Integrating tumor burden with survival outcome for treatment effect evaluation in oncology trials." pith.science (2026). https://pith.science/paper/4QXFGLA5
@misc{pith2026250607387,
  author       = {Pith},
  title        = {Pith review of: Integrating tumor burden with survival outcome for treatment effect evaluation in oncology trials},
  year         = {2026},
  howpublished = {\url{https://pith.science/paper/4QXFGLA5}},
  note         = {Machine review of arXiv:2506.07387}
}
read the original abstract
In early-phase cancer clinical trials, the limited availability of data presents significant challenges in developing a framework to efficiently quantify treatment effectiveness. To address this, we propose a novel utility-based Bayesian approach for assessing treatment effects in these trials, where data scarcity is a major concern. Our approach synthesizes tumor burden, a key biomarker for evaluating patient response to oncology treatments, and survival outcome, a widely used endpoint for assessing clinical benefits, by jointly modeling longitudinal and survival data. The proposed method, along with its novel estimand, aims to efficiently capture signals of treatment efficacy in early-phase studies and holds potential for development as an endpoint in Phase 3 confirmatory studies. We conduct simulations to investigate the frequentist characteristics of the proposed estimand in a simple setting, which demonstrate relatively controlled Type I error rates when testing the treatment effect on outcomes.
Figures


Figures from the paper (6 more)




Reference graph
Works this paper leans on
-
[1]
Betancourt, M. (2017). A conceptual introduction to Hamiltonian Monte Carlo . arXiv preprint arXiv:1701.02434
arXiv 2017
-
[2]
D., Lee, D., Goodrich, B., Betancourt, M., Brubaker, M
Carpenter, B., Gelman, A., Hoffman, M. D., Lee, D., Goodrich, B., Betancourt, M., Brubaker, M. A., Guo, J., Li, P., and Riddell, A. (2017). Stan: A probabilistic programming language . Journal of statistical software , 76
work page 2017
-
[3]
Collett, D. (2023). Modelling survival data in medical research . Chapman and Hall/CRC
work page 2023
-
[4]
Crowther, M. J., Abrams, K. R., and Lambert, P. C. (2013). Joint modeling of longitudinal and survival data . The Stata Journal , 13(1):165--184
work page 2013
-
[5]
Dejardin, D., Lesaffre, E., and Verbeke, G. (2010). Joint modeling of progression-free survival and death in advanced cancer clinical trials . Statistics in Medicine , 29(16):1724--1734
work page 2010
-
[6]
Driscoll, J. J. and Rixe, O. (2009). Overall survival: still the gold standard: why overall survival remains the definitive end point in cancer clinical trials . The Cancer Journal , 15(5):401--405
work page 2009
-
[7]
A., Therasse, P., Bogaerts, J., Schwartz, L
Eisenhauer, E. A., Therasse, P., Bogaerts, J., Schwartz, L. H., Sargent, D., Ford, R., Dancey, J., Arbuck, S., Gwyther, S., Mooney, M., et al. (2009). New response evaluation criteria in solid tumours: revised RECIST guideline (version 1.1) . European journal of cancer , 45(2):228--247
work page 2009
-
[8]
Group, I. E. W. et al. (2020). ICH E9 (R1): addendum on estimands and sensitivity analysis in clinical trials to the guideline on statistical principles for clinical trials
work page 2020
Show all 23 references
-
[9]
Hogan, J. W. and Laird, N. M. (1997). Mixture models for the joint distribution of repeated measures and event times . Statistics in medicine , 16(3):239--257
1997
-
[10]
Imbens, G. W. (2004). Nonparametric estimation of average treatment effects under exogeneity: A review . Review of Economics and statistics , 86(1):4--29
2004
-
[11]
Irwin, J. (1949). The standard error of an estimate of expectation of life, with special reference to expectation of tumourless life in experiments with mice . Epidemiology & Infection , 47(2):188--189
1949
-
[12]
C., and Zhang, Y
Jiang, L., Liu, X., Phillips, P. C., and Zhang, Y. (2024). Bootstrap inference for quantile treatment effects in randomized experiments with matched pairs . Review of Economics and Statistics , 106(2):542--556
2024
-
[13]
E., Crowther, M
Lawrence Gould, A., Boye, M. E., Crowther, M. J., Ibrahim, J. G., Quartey, G., Micallef, S., and Bois, F. Y. (2015). Joint modeling of survival and longitudinal non-survival data: current methods and issues. Report of the DIA Bayesian joint modeling working group . Statistics ...
2015
-
[14]
Neal, R. M. (2012). MCMC using Hamiltonian dynamics . arXiv preprint arXiv:1206.1901
2012 arXiv
-
[15]
and Rai, Y
Otsu, T. and Rai, Y. (2017). Bootstrap inference of matching estimators for average treatment effects . Journal of the American Statistical Association , 112(520):1720--1732
2017
-
[16]
Rizopoulos, D. (2012). Joint models for longitudinal and time-to-event data: With applications in R . CRC press
2012
-
[17]
and Parmar, M
Royston, P. and Parmar, M. K. (2013). Restricted mean survival time: an alternative to the hazard ratio for the design and analysis of randomized trials with a time-to-event outcome . BMC medical research methodology , 13:1--15
2013
-
[18]
Rubin, D. B. (1976). Inference and missing data . Biometrika , 63(3):581--592
1976
-
[19]
Rubin, D. B. (1981). The Bayesian bootstrap . The annals of statistics , pages 130--134
1981
-
[20]
Schoenfeld, D. A. (1983). Sample-size formula for the proportional-hazards regression model . Biometrics , pages 499--503
1983
-
[21]
Uno, H., Claggett, B., Tian, L., Inoue, E., Gallo, P., Miyata, T., Schrag, D., Takeuchi, M., Uyama, Y., Zhao, L., et al. (2014). Moving beyond the hazard ratio in quantifying the between-group difference in survival analysis . Journal of clinical Oncology , 32(22):2380
2014
-
[22]
K., Karakasis, K., and Oza, A
Wilson, M. K., Karakasis, K., and Oza, A. M. (2015). Outcomes and endpoints in trials of cancer treatment: the past, present, and future . The Lancet Oncology , 16(1):e32--e42
2015
-
[23]
H., Xiu, L., and Elsayed, Y
Zhuang, S. H., Xiu, L., and Elsayed, Y. A. (2009). Overall survival: a gold standard in search of a surrogate: the value of progression-free survival and time to progression as end points of drug efficacy . The Cancer Journal , 15(5):395--400
2009
Reviewed August 7, 2026 · model on record in the stance chip above.
Discussion (0). Sign in to comment.