REVIEW 4 major objections 8 minor 1 cited by
Galaxy Cluster Mass Estimation Through The Splashback Radius
T0 review · 4 major / 8 minor · reviewed 2026-08-07 · deepseek-v4-flash
Pith's one-line read The splashback radius of a galaxy cluster can be measured from its galaxy counts alone, and a new power-law relation turns that radius into a mass estimate with about 0.15 dex scatter.
desk verdict A useful new individual-cluster splashback radius measurement and Msp–Rsp calibration, but the mock is never used to check that the fitted feature actually recovers the true dark-matter splashback radius. read the letter →
The pith
A machine-rendered reading of the paper's core claim, the machinery that carries it, and where it could break.
The reading
What carries the argument
The load-bearing model is the trunc-NFW cumulative number profile: an analytical projected Navarro-Frenk-White (NFW) surface-density profile multiplied by a smooth exponential truncation function plus a two-halo term that accounts for the surrounding field. Each cluster's cumulative galaxy count $N(<R)$ is fit with this model via a Markov chain Monte Carlo sampler, and the splashback radius is read off as the minimum of the logarithmic slope of the surface density, converted to three dimensions by $r_{\rm sp} = \sqrt{\pi/2}\,R_{\rm sp}$. Splashback masses are then obtained by extending the tabulated $M_{200c}$ along the NFW profile out to $r_{\rm sp}$. This machinery lets the authors estimate both quantities for single clusters rather than stacked samples.
What would settle it
Compare the galaxy-traced splashback radii recovered by this pipeline with the true dark-matter splashback radii of the halos in the mock catalog; a systematic one-to-one disagreement would mean the observed $R_{\rm sp}/R_{200m}\approx 1$ and the fitted scaling relation are artifacts of galaxy-tracing bias rather than the physical boundary.
Extended reading notes
Core claim
The central empirical claim is that observed splashback radii, measured in projection, are consistently smaller than predicted by dark matter simulations, with $R_{\rm sp}/R_{200m} \approx 1$, in line with earlier work. The second claim is a new mass calibration: for the SDSS sample, $\log(M_{\rm sp}/10^{14}\,M_\odot) = \log A + B\log(R_{\rm sp}/{\rm Mpc}) + C\log(1+z)$ with $A=1.48\pm0.21$, $B=1.77\pm0.12$, $C=2.31\pm1.41$ and a dispersion of about $0.15$ dex, consistent with mock results at $1\sigma$. The fitted slope is significantly below the $B=3$ expected if clusters had a constant density at $R_{\rm sp}$, which the authors interpret as the splashback radius tracing a physical, accretion-dependent boundary rather than a fixed overdensity. They also report significant redshift evolution, while cautioning that the low-redshift sample limits its confirmation.
Load-bearing premise
The method assumes that the minimum in the logarithmic slope of the galaxy surface number density profile, inferred from the trunc-NFW model, marks the true dark-matter splashback radius of each individual cluster.
Editorial extensions
If this is right
- Cluster masses can be estimated from a single observable radius with about $0.15$ dex scatter, competitive with mass-richness and mass-luminosity relations.
- The persistent $R_{\rm sp}/R_{200m} \approx 1$ observed here means galaxy-tracing in projection falls short of cold-dark-matter simulation predictions; the physical cause (projection, dynamical friction, or accretion-rate effects) remains an open problem.
- Splashback radius measurements are insensitive to center definition and magnitude limit across the ranges tested, so the method transfers to other galaxy surveys without per-survey recalibration.
- The fitted slope $B\approx 1.77$ shows the splashback boundary does not enclose a constant mean density; mass calibrations must include this physical behavior rather than assuming $B=3$.
- The claimed redshift evolution ($C=2.31\pm1.41$) points toward hierarchical assembly, but the low-redshift sample is too narrow to confirm it; higher-redshift data would test this directly.
Reading between the lines
- If the galaxy-traced splashback radius is biased relative to the true dark-matter splashback radius, the fitted scaling relation would calibrate that biased radius; a direct test is to run the same pipeline on a mock whose true $r_{\rm sp}$ is known.
- The near-$B\approx 2$ slope hints that projection of an aspherical, accretion-dependent boundary shapes the observed relation; a three-dimensional deprojected or stacked-lensing version might recover a steeper slope.
- With photometric redshifts, the same cumulative-profile method could give mass estimates for thousands of clusters in upcoming wide surveys, since the paper finds membership-interval variations change $R_{\rm sp}$ by only about 5%.
- A clean test of the redshift term would apply the same fit to clusters at $z\gtrsim 0.3$, where the $(1+z)^C$ dependence becomes distinguishable from the intrinsic scatter.
Editorial analysis
A structured set of objections, weighed in public.
Referee Report
Summary. The paper uses a sample of 60 SDSS galaxy clusters with weak-lensing mass estimates and a 30-cluster mock catalog to measure individual splashback radii by fitting cumulative galaxy number profiles with truncated NFW and truncated Sersic models. The splashback radius is identified as the minimum of the logarithmic slope of the projected surface density, and the splashback mass is estimated by integrating the same fitted model anchored to catalog M200c values. The authors report that Rsp/R200m is close to unity, robust to center definition, magnitude limit, galaxy color, and velocity cuts, and they propose a new Msp-Rsp scaling relation with about 0.15 dex scatter. The central empirical claims are the observed 2D splashback radius being smaller than dark-matter simulation predictions (Rsp/R200m ~ 1) and the scaling relation in Eq. (24).
Significance. If the splashback identification is valid, the paper offers a practical route to individual cluster splashback radii from cumulative counts and a mass proxy that could be applied to large photometric surveys. The systematic exploration of center definitions, magnitude limits, galaxy colors, and velocity cuts is useful, and the use of a mock catalog as a control is a good idea. The model selection with chi-squared, AIC, and BIC is careful, and the authors are explicit about several limitations. However, the two headline results rest on assumptions that are not validated with the mock data, and the 2D/3D treatment of the splashback radius may affect the discrepancy claim.
major comments (4)
- [Section 3.1, Eq. (12); Figures 6-12] The paper defines r_sp = sqrt(pi/2) R_sp, so R_sp is a projected (2D) radius while r_sp is the corresponding 3D radius. Yet the ratio R_sp/R_200m is compared with dark-matter simulation predictions that in the cited literature refer to the 3D splashback radius. Applying Eq. (12) to the reported median R_sp/R_200m ~ 1 gives r_sp/R_200m ~ 1.25, which is compatible with the simulation expectation and removes the claimed discrepancy. The authors should clarify which definition is used in each comparison and re-derive the headline conclusion using r_sp/R_200m or, alternatively, project the simulation predictions consistently.
- [Section 2.2 and Section 3.1] The mock sample is never used to test the load-bearing assumption that the minimum of d ln Sigma / d ln R recovered from the trunc-NFW fit corresponds to the true splashback radius of the simulated halos. The mock is used only to show similarity of normalized profiles and of the R_sp/R_200m distributions, but because the mock pipeline shares the same galaxy-tracing and projection assumptions with the SDSS pipeline, this agreement is not an independent validation. The authors should compute true 3D splashback radii from the dark-matter distribution of the mock halos and compare them with the recovered r_sp, quantifying bias and scatter as a function of mass, redshift, and galaxy selection.
- [Section 3.2, Eq. (17); Section 4.4] The M_sp-R_sp relation is partly built in by construction: M_sp is computed as M(<r_sp) using the same trunc-NFW fit that provides R_sp, anchored to the same M200c catalog. The strong correlation and the stated 0.15 dex scatter therefore do not by themselves establish an independent scaling relation. The authors should demonstrate that the relation survives when R_sp and M_sp are derived from independent fits or when an external mass calibration is used, and should report the correlation between the fitted parameters and the propagated covariance.
- [Section 3.1.1, Table 2; Section 3.1.2] The informative priors for individual fits (tau = 4 +/- 0.8, gamma = 1.7 +/- 0.4) are taken from the stacked fits of the same SDSS and Mock samples. Because the stacked and individual fits use overlapping data, the posterior distributions of R_sp are not fully independent of the stacking results. The authors should either motivate the priors from independent literature alone or test the sensitivity of R_sp and M_sp to the prior widths and central values.
minor comments (8)
- [Abstract; Section 4.4] The abstract states that the M_sp-R_sp relation shows significant redshift evolution, but the fitted coefficient is C = 2.31 +/- 1.41 and the authors themselves note that setting C = 0 does not alter the other parameters significantly; the wording should be softened accordingly.
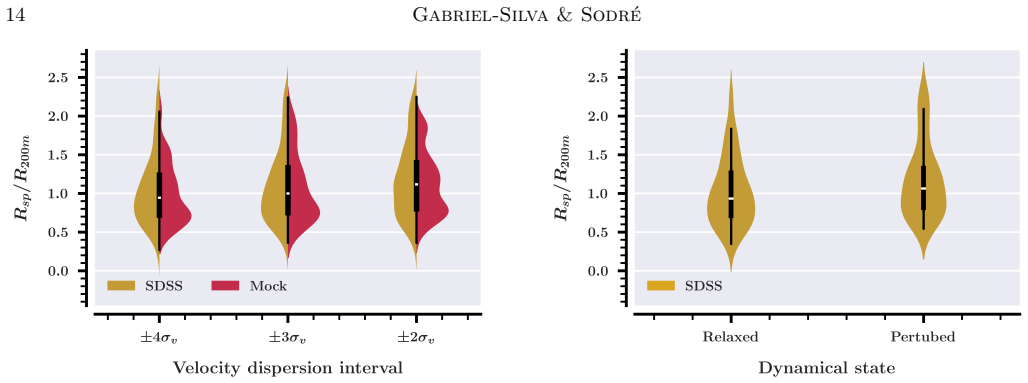
- [Section 4.2.4] The 5% trend in R_sp/R_200m with the width of the recession-velocity interval is discussed as possibly physical, but no quantitative interloper test or correction is applied; the mock catalog could be used to measure the effect directly.
- [Figure 3] The conclusion that the SDSS and Mock normalized cumulative profiles agree is based on visual inspection; a two-sample test such as a Kolmogorov-Smirnov statistic would make the comparison quantitative.
- [Section 3.1.1] Stacked profiles are smoothed with a Savitzky-Golay filter while individual profiles are not; the authors should justify this difference or test whether the smoothing affects the recovered splashback radii.
- [Table 4] In several bins the non-truncated Sersic model outperforms the non-truncated NFW model; the text attributes this to stochastic fluctuations without a formal test, so a brief explanation of why these cases are not considered evidence for the Sersic form would be useful.
- [Eq. (12)] The origin of the sqrt(pi/2) conversion factor should be given explicitly, either as a short derivation or with a precise citation to the relevant equations in More et al. (2016), since this factor is used in all mass estimates.
- [Section 4.2.1] The center-comparison analysis uses only the 52 clusters with X-ray centers; the paper should state explicitly whether the remaining 8 clusters are excluded from that comparison and whether this changes any conclusions.
- [Throughout] There are minor typographical errors, including "ackowledges" in the Acknowledgements and "quantites" in Section 4.1; the units h70^-1 Mpc and 10^14 h70^-1 M_sun in Table 5 should be defined in the table caption.
Circularity Check
The Rsp/R200m comparison is not circular, but the Msp-Rsp scaling relation is partially built into the same trunc-NFW fit that defines Rsp.
-
self definitional
[Section 3.2 (Eqs. 14-17) and Section 3.1.2 (Rsp definition); result used in Eq. 24 (Section 4.4)]
"We estimate the splashback radius by selecting the minimum in the logarithmic slope of the surface density within a range of ±0.5Rt (Sec. 3.1.2). ... By utilizing the fitted parameters rs, Rt, and τ, together with the tabulated M200c, we can estimate the mass at any radius, assuming the cluster follows an NFW profile. For instance, in the splashback radius: Msp ≡ M(< rsp). (Sec. 3.2, Eqs. 14-17)"
Both Rsp and Msp are outputs of the same trunc-NFW fit. Rsp is defined as the minimum of dlnΣ/dlnR of the fitted surface-density model, i.e., a function of the fitted parameters (rs, Rt, τ). Msp is then computed as the enclosed mass of that same fitted NFW+truncation profile, evaluated at rsp = sqrt(pi/2) Rsp (Eq. 12). Consequently, the strong Msp-Rsp correlation reported in Eq. 24 is partly generated by the estimator itself: the relation largely recovers the assumed profile shape rather than an independent association between two separately measured quantities. The residual scatter (about 0.15 dex) still contains the external M200c errors and per-cluster fit variation, so the circularity is partial, but the slope B ≈ 1.77 is not an independent empirical discovery.
full rationale
The paper's headline result, Rsp/R200m ≈ 1, is not circular: Rsp is obtained from the fitted minimum of the logarithmic slope of the galaxy cumulative number profile, while R200m is derived from external weak-lensing M200c measurements via a literature mass-concentration relation, and the dark-matter-only simulation expectation is an external benchmark. The unvalidated assumption that the galaxy-tracing minimum coincides with the true matter splashback radius is a correctness/validation concern, not a definitional circularity; likewise, the fact that the mock sample is not used to check recovered Rsp against true halo splashback radii is an evidentiary gap, not a self-referential reduction. The one substantive circular element is the Msp-Rsp scaling relation: Msp is defined as the enclosed mass of the same trunc-NFW profile whose parameters define Rsp, so the strong correlation and slope in Eq. 24 are partially built into the construction of the two quantities. The informative priors for individual fits come from stacked fits of the same SDSS and Mock samples, but they are broad and literature-anchored (τ, γ priors), so they do not by themselves force the splashback radii. On balance, the central Rsp/R200m comparison stands independently, while the mass-radius relation carries a moderate degree of self-reference.
Assumptions & free parameters
free parameters (5)
- trunc-NFW profile parameters (rho_s, r_s, R_t, tau, rho_m, gamma) per cluster =
Not tabulated per cluster; priors in Table 2
- rout (two-halo term outer radius) =
1.5 Mpc (fixed)
- Msp-Rsp scaling relation parameters (A, B, C) =
A=1.48±0.21, B=1.77±0.12, C=2.31±1.41 (SDSS); A=1.56±0.33, B=1.62±0.18, C=2.10±2.06 (Mock)
- Prior means and widths for tau and gamma =
tau=4±0.8, gamma=1.7±0.4
- 2D-3D conversion factor sqrt(pi/2) =
1.253
assumptions (7)
- domain assumption The galaxy number density profile traces the total matter density profile sufficiently well that the logarithmic slope minimum of the galaxy profile marks the splashback radius of the dark matter halo.
- domain assumption The surface density model with a smooth truncation exp[-(R/Rt)^tau] (Diemer & Kravtsov 2014) adequately describes the projected density of real clusters.
- domain assumption The 3D splashback radius relates to the 2D projected radius as rsp = sqrt(pi/2) Rsp.
- domain assumption The NFW profile with truncation, normalized to the weak-lensing M200c, can be extrapolated to estimate Msp.
- domain assumption The weak-lensing masses from Sereno (2015) and Herbonnet et al. (2020) are on a consistent mass scale and their uncertainties are Gaussian and independent.
- domain assumption The mass-concentration relation from Diemer & Joyce (2019) is valid for these clusters when converting M200c to M200m.
- standard math Spherical symmetry and a Poisson likelihood for counts in annular bins are appropriate for the cumulative profiles.
Cite this review
Pith. "Pith review of Galaxy Cluster Mass Estimation Through The Splashback Radius." pith.science (2026). https://pith.science/paper/3A46RITI
@misc{pith2026250607425,
  author       = {Pith},
  title        = {Pith review of: Galaxy Cluster Mass Estimation Through The Splashback Radius},
  year         = {2026},
  howpublished = {\url{https://pith.science/paper/3A46RITI}},
  note         = {Machine review of arXiv:2506.07425}
}
abstract
We present an analysis of the splashback radius ($R_{\text{sp}}$) and the associated splashback mass ($M_{\text{sp}}$) for a sample of galaxy clusters using SDSS spectroscopic data and mock simulations. $R_{\text{sp}}$ marks a physical boundary between the virialized core and the outer infall regions of clusters, providing a robust measure of cluster mass accretion history without being affected by pseudo-evolution. We model the cumulative galaxy number profile of clusters, testing different halo density models and considering the impact of cluster properties, such as center definitions, magnitude limits, galaxy colors, and field contamination, on the estimation of splashback features. Our results show that observed splashback radii, measured in projection (2D), are consistently smaller than predicted by dark matter simulations, with $R_\text{sp}/R_{200m} \approx 1$, supporting previous discrepancies in the literature. We also explore the relationship between $M_{\text{sp}}$ and $R_{\text{sp}}$, proposing a new scaling relation for future cosmological studies, as $R_{\text{sp}}$ is easily observable. Our findings indicate that splashback masses strongly correlate with radii, with a dispersion of $\approx 0.15$ dex, competitive with other mass-observable relations. However, the fitted relation diverges from the constant density expectations of galaxy clusters around $R_\text{sp}$. Additionally, the $M_{\text{sp}} \textendash R_{\text{sp}}$ relation shows significant redshift evolution, though the predominantly low-redshift range of our sample limits our ability to confirm this trend conclusively. The approach developed here may play a key role in cluster characterization and cosmology in the era of large galaxy surveys.
Figures


Figures from the paper (8 more)




Forward citations
Cited by 1 Pith paper
-
The role of filaments in the large-scale conformity signal
Filamentary regions of the cosmic web are the primary contributors to the residual large-scale conformity signal of low-mass central galaxies in both SAG and TNG300.
Reference graph
Works this paper leans on
-
[1]
, " * write output.state after.block = add.period write newline
ENTRY address archivePrefix author booktitle chapter doi edition editor eprint howpublished institution journal key month number organization pages publisher school series title misctitle type volume year version url label extra.label sort.label short.list INTEGERS output.state before.all mid.sentence after.sentence after.block FUNCTION init.state.consts ...
-
[2]
write newline
" write newline "" before.all 'output.state := FUNCTION format.url url empty "" new.block "" url * "" * if FUNCTION format.eprint eprint empty "" archivePrefix empty "" archivePrefix "arXiv" = new.block " " eprint * " " * new.block " " eprint * " " * if if if FUNCTION format.doi doi empty "" " " doi * " " * if FUNCTION format.pid doi empty eprint empty ur...
-
[3]
thebibliography [1] 20pt to REFERENCES 6pt =0pt -12pt 10pt plus 3pt =0pt =0pt =1pt plus 1pt =0pt =0pt -12pt =13pt plus 1pt =20pt =13pt plus 1pt \@M =10000 =-1.0em =0pt =0pt 0pt =0pt =1.0em @enumiv\@empty 10000 10000 `\.\@m \@noitemerr \@latex@warning Empty `thebibliography' environment \@ifnextchar \@reference \@latexerr Missing key on reference command E...
arXiv 2021
-
[4]
Ade, P. A. R., Aghanim, N., Armitage-Caplan, C., et al. 2014, Astronomy & Astrophysics, 571, A16, 10.1051/0004-6361/201321591
-
[5]
Adhikari, S., Dalal, N., & Chamberlain, R. T. 2014, Journal of Cosmology and Astroparticle Physics, 2014, 019–019, 10.1088/1475-7516/2014/11/019
-
[6]
2016, Journal of Cosmology and Astroparticle Physics, 2016, 022, 10.1088/1475-7516/2016/07/022
Adhikari, S., Dalal, N., & Clampitt, J. 2016, Journal of Cosmology and Astroparticle Physics, 2016, 022, 10.1088/1475-7516/2016/07/022
-
[7]
2018, Journal of Cosmology and Astroparticle Physics, 2018, 033, 10.1088/1475-7516/2018/11/033
Adhikari, S., Sakstein, J., Jain, B., Dalal, N., & Li, B. 2018, Journal of Cosmology and Astroparticle Physics, 2018, 033, 10.1088/1475-7516/2018/11/033
-
[8]
2021, The Astrophysical Journal, 923, 37, 10.3847/1538-4357/ac0bbc
Adhikari, S., hyeon Shin, T., Jain, B., et al. 2021, The Astrophysical Journal, 923, 37, 10.3847/1538-4357/ac0bbc
Show all 110 references
-
[9]
1974, IEEE Transactions on Automatic Control, 19, 716, 10.1109/TAC.1974.1100705
Akaike, H. 1974, IEEE Transactions on Automatic Control, 19, 716, 10.1109/TAC.1974.1100705
1974
-
[10]
W., Evrard, A
Allen, S. W., Evrard, A. E., & Mantz, A. B. 2011, Annual Review of Astronomy and Astrophysics, 49, 409, https://doi.org/10.1146/annurev-astro-081710-102514
2011 doi
-
[11]
W., et al
Allen , S. W., et al. 2004, Monthly Notices of the Royal Astronomical Society, 353, 457
2004
-
[12]
C., Sodré, Laerte, J., Overzier, R
Araya-Araya, P., Vicentin, M. C., Sodré, Laerte, J., Overzier, R. A., & Cuevas, H. 2021, Monthly Notices of the Royal Astronomical Society, 504, 5054, 10.1093/mnras/stab1133
2021 doi
-
[13]
2005, Astronomy & Astrophysics, 441, 893
Arnaud , M., et al. 2005, Astronomy & Astrophysics, 441, 893
2005
-
[14]
P., Tollerud , E
Astropy Collaboration , Robitaille , T. P., Tollerud , E. J., et al. 2013, , 558, A33, 10.1051/0004-6361/201322068
2013 doi
-
[15]
M., Sip o cz , B
Astropy Collaboration , Price-Whelan , A. M., Sip o cz , B. M., et al. 2018, , 156, 123, 10.3847/1538-3881/aabc4f
2018 doi
-
[16]
M., Lim , P
Astropy Collaboration , Price-Whelan , A. M., Lim , P. L., et al. 2022, , 935, 167, 10.3847/1538-4357/ac7c74
2022 doi
-
[17]
V., Carrasco, E
Astudillo, S. V., Carrasco, E. R., Castellón, J. L. N., Zenteno, A., & Cuevas, H. 2024, The effect of dynamical states on galaxy clusters populations. I. Classification of dynamical states. 2408.02519
2024 arXiv
-
[18]
2017, The Astrophysical Journal, 841, 18, 10.3847/1538-4357/aa6ff0
Baxter, E., Chang, C., Jain, B., et al. 2017, The Astrophysical Journal, 841, 18, 10.3847/1538-4357/aa6ff0
2017 doi
-
[19]
S., & Csabai, I
Beck, R., Dobos, L., Budavári, T., Szalay, A. S., & Csabai, I. 2016, Monthly Notices of the Royal Astronomical Society, 460, 1371, 10.1093/mnras/stw1009
2016 doi
-
[20]
S., Wechsler, R
Behroozi, P. S., Wechsler, R. H., Lu, Y., et al. 2014, The Astrophysical Journal, 787, 156, 10.1088/0004-637x/787/2/156
2014 doi
-
[21]
1985, Astrophysical Journal Supplement Series, 58, 39
Bertschinger , E. 1985, Astrophysical Journal Supplement Series, 58, 39
1985
-
[22]
T., & Rogers, J
Boggs, P. T., & Rogers, J. E. 1990, Contemporary Mathematics, 112, 186
1990
-
[23]
2006, Publications of the Astronomical Society of the Pacific, 118, 517, 10.1086/500691
Boselli, A., & Gavazzi, G. 2006, Publications of the Astronomical Society of the Pacific, 118, 517, 10.1086/500691
2006 doi
-
[24]
R., et al
Carlberg , G. R., et al. 1997, The Astrophysical Journal, 478, 462
1997
-
[25]
1943, Dynamical Friction
Chandrasekhar, S. 1943, Dynamical Friction. I. General Considerations: the Coefficient of Dynamical Friction
1943
-
[26]
2018, The Astrophysical Journal, 864, 83, 10.3847/1538-4357/aad5e7
Chang, C., Baxter, E., Jain, B., et al. 2018, The Astrophysical Journal, 864, 83, 10.3847/1538-4357/aad5e7
2018 doi
- [29]
-
[30]
2019, Phys
Contigiani, O., Vardanyan, V., & Silvestri, A. 2019, Phys. Rev. D, 99, 064030, 10.1103/PhysRevD.99.064030
2019 doi
-
[31]
S., Laerte Sodré, J., Kneib, J.-P., & Campusano, L
Cypriano, E. S., Laerte Sodré, J., Kneib, J.-P., & Campusano, L. E. 2004, The Astrophysical Journal, 613, 95, 10.1086/422896
2004 doi
-
[33]
Davis, M., & Peebles, P. J. E. 1983, Astrophysical Journal, 267, 465, 10.1086/160884
1983 doi
-
[34]
1999, Monthly Notices of the Royal Astronomical Society, 309, 610, 10.1046/j.1365-8711.1999.02864.x
Diaferio, A. 1999, Monthly Notices of the Royal Astronomical Society, 309, 610, 10.1046/j.1365-8711.1999.02864.x
1999
-
[35]
2018, The Astrophysical Journal Supplement Series, 239, 35, 10.3847/1538-4365/aaee8c
Diemer, B. 2018, The Astrophysical Journal Supplement Series, 239, 35, 10.3847/1538-4365/aaee8c
2018 doi
-
[36]
2020, The Astrophysical Journal, 903, 87, 10.3847/1538-4357/abbf52
---. 2020, The Astrophysical Journal, 903, 87, 10.3847/1538-4357/abbf52
2020 doi
-
[37]
2022, Monthly Notices of the Royal Astronomical Society, 519, 3292, 10.1093/mnras/stac3778
---. 2022, Monthly Notices of the Royal Astronomical Society, 519, 3292, 10.1093/mnras/stac3778
2022 doi
-
[38]
2019, The Astrophysical Journal, 871, 168, 10.3847/1538-4357/aafad6
Diemer, B., & Joyce, M. 2019, The Astrophysical Journal, 871, 168, 10.3847/1538-4357/aafad6
2019 doi
-
[39]
Diemer, B., & Kravtsov, A. V. 2014, The Astrophysical Journal, 789, 1, 10.1088/0004-637x/789/1/1
2014 doi
-
[40]
Diemer, B., More, S., & Kravtsov, A. V. 2013, The Astrophysical Journal, 766, 25, 10.1088/0004-637x/766/1/25
2013 doi
-
[41]
Dietrich, J. P. , Biviano, A. , Popesso, P. , et al. 2009, A&A, 499, 669, 10.1051/0004-6361/200811433
2009 doi
-
[42]
Dressler, A., & Shectman, S. A. 1988, Astronomical Journal, 95, 985
1988
-
[43]
, Gastaldello, F
Ettori, S. , Gastaldello, F. , Leccardi, A. , et al. 2011, A&A, 526, C1, 10.1051/0004-6361/201015271e
2011 doi
-
[45]
A., & Goldreich , P
Fillmore , J. A., & Goldreich , P. 1984, , 281, 1
1984
-
[46]
W., Lang, D., & Goodman, J
Foreman-Mackey, D., Hogg, D. W., Lang, D., & Goodman, J. 2013, Publications of the Astronomical Society of the Pacific, 125, 306, 10.1086/670067
2013 doi
-
[47]
, Adami, C
Gavazzi, R. , Adami, C. , Durret, F. , et al. 2009, A&A, 498, L33, 10.1051/0004-6361/200911841
2009 doi
-
[48]
F., et al
Giocoli, C., Palmucci, L., Lesci, G. F., et al. 2024, A&A, 687, A79, 10.1051/0004-6361/202449561
2024 doi
-
[49]
J., Rodriguez, F., García Lambas, D., et al
Gonzalez, E. J., Rodriguez, F., García Lambas, D., et al. 2016, Monthly Notices of the Royal Astronomical Society, 465, 1348, 10.1093/mnras/stw2803
2016 doi
-
[50]
E., & Gott, J
Gunn, J. E., & Gott, J. R. 1972, Astrophysical Journal, 176, 1, 10.1086/151605
1972 doi
-
[51]
T., et al
Haggar, R., Amoura, Y., Mpetha, C. T., et al. 2024, The Astrophysical Journal, 972, 28, 10.3847/1538-4357/ad5cee
2024 doi
-
[52]
2001, The Astrophysical Journal, 553, 545
Haiman , Z., et al. 2001, The Astrophysical Journal, 553, 545
2001
-
[53]
R., Millman, K
Harris, C. R., Millman, K. J., van der Walt, S. J., et al. 2020, Nature, 585, 357, 10.1038/s41586-020-2649-2
2020 doi
-
[54]
Henriques, B. M. B., White, S. D. M., Thomas, P. A., et al. 2015, Monthly Notices of the Royal Astronomical Society, 451, 2663, 10.1093/mnras/stv705
2015 doi
-
[55]
2020, Monthly Notices of the Royal Astronomical Society, 497, 4684, 10.1093/mnras/staa2303
Herbonnet, R., Sifón, C., Hoekstra, H., et al. 2020, Monthly Notices of the Royal Astronomical Society, 497, 4684, 10.1093/mnras/staa2303
2020 doi
-
[56]
2001--, SciPy : Open source scientific tools for Python
Jones, E., Oliphant, T., Peterson, P., et al. 2001--, SciPy : Open source scientific tools for Python . http://www.scipy.org/
2001
-
[57]
G., & Kopylov, A
Kopylova, F. G., & Kopylov, A. I. 2022, Astrophysical Bulletin, 77, 347–360
2022
-
[58]
V., & Borgani, S
Kravtsov, A. V., & Borgani, S. 2012, Annual Review of Astronomy and Astrophysics, 50, 353, https://doi.org/10.1146/annurev-astro-081811-125502
2012 doi
-
[59]
M., Annis, J., Hardin, F
Kubo, J. M., Annis, J., Hardin, F. M., et al. 2009, The Astrophysical Journal, 702, L110, 10.1088/0004-637X/702/2/L110
2009 doi
-
[60]
1993, Monthly Notices of the Royal Astronomical Society, 262, 627, 10.1093/mnras/262.3.627
Lacey, C., & Cole, S. 1993, Monthly Notices of the Royal Astronomical Society, 262, 627, 10.1093/mnras/262.3.627
1993 doi
-
[61]
Lebeau, T., Ettori, S., Aghanim, N., & Sorce, J. G. 2024, A&A, 689, A19, 10.1051/0004-6361/202450146
2024 doi
-
[62]
2022, Astronomy and Computing, 38, 100510, https://doi.org/10.1016/j.ascom.2021.100510
Lima, E., Sodré, L., Bom, C., et al. 2022, Astronomy and Computing, 38, 100510, https://doi.org/10.1016/j.ascom.2021.100510
2022
-
[63]
Lopes, P. A. A., Trevisan, M., Laganá, T. F., et al. 2018, Monthly Notices of the Royal Astronomical Society, 478, 5473, 10.1093/mnras/sty1374
2018 doi
-
[64]
W., & Ebeling, H
Mann, A. W., & Ebeling, H. 2012, Monthly Notices of the Royal Astronomical Society, 420, 2120, 10.1111/j.1365-2966.2011.20170.x
2012
-
[65]
F., Ludlow, A., & Jenkins, A
Merritt, D., Navarro, J. F., Ludlow, A., & Jenkins, A. 2005, The Astrophysical Journal, 624, L85, 10.1086/430636
2005 doi
-
[66]
More, S., Diemer, B., & Kravtsov, A. V. 2015, The Astrophysical Journal, 810, 36, 10.1088/0004-637x/810/1/36
2015 doi
-
[67]
2016, The Astrophysical Journal, 825, 39, 10.3847/0004-637x/825/1/39
More, S., Miyatake, H., Takada, M., et al. 2016, The Astrophysical Journal, 825, 39, 10.3847/0004-637x/825/1/39
2016 doi
-
[68]
L., McGee, S
Mulroy, S. L., McGee, S. L., Gillman, S., et al. 2017, Monthly Notices of the Royal Astronomical Society, 472, 3246
2017
-
[69]
2018, The Astrophysical Journal, 854, 120, 10.3847/1538-4357/aaaab8
Murata, R., Nishimichi, T., Takada, M., et al. 2018, The Astrophysical Journal, 854, 120, 10.3847/1538-4357/aaaab8
2018 doi
-
[70]
2020, Publications of the Astronomical Society of Japan, 72, 64, 10.1093/pasj/psaa041
Murata, R., Sunayama, T., Oguri, M., et al. 2020, Publications of the Astronomical Society of Japan, 72, 64, 10.1093/pasj/psaa041
2020 doi
-
[71]
F., Frenk, C
Navarro, J. F., Frenk, C. S., & White, S. D. M. 1996, The Astrophysical Journal, 462, 563, 10.1086/177173
1996 doi
-
[72]
Okabe, N., Takada, M., Umetsu, K., Futamase, T., & Smith, G. P. 2010, Publications of the Astronomical Society of Japan, 62, 811, 10.1093/pasj/62.3.811
2010 doi
-
[73]
2008, Publications of the Astronomical Society of Japan, 60, 345, 10.1093/pasj/60.2.345
Okabe, N., & Umetsu, K. 2008, Publications of the Astronomical Society of Japan, 60, 345, 10.1093/pasj/60.2.345
2008 doi
-
[74]
M., Borrow, J., O'Neil, S., & Vogelsberger, M
O'Shea, T. M., Borrow, J., O'Neil, S., & Vogelsberger, M. 2024, Dynamical friction and measurements of the splashback radius in galaxy clusters. 2405.18468
2024
-
[75]
J., Vogelsberger, M., & Diemer, B
O’Neil, S., Barnes, D. J., Vogelsberger, M., & Diemer, B. 2021, Monthly Notices of the Royal Astronomical Society, 504, 4649, 10.1093/mnras/stab1221
2021 doi
-
[76]
2022, Monthly Notices of the Royal Astronomical Society, 513, 835, 10.1093/mnras/stac850
O’Neil, S., Borrow, J., Vogelsberger, M., & Diemer, B. 2022, Monthly Notices of the Royal Astronomical Society, 513, 835, 10.1093/mnras/stac850
2022 doi
-
[77]
2024, Monthly Notices of the Royal Astronomical Society, 530, 3310, 10.1093/mnras/stae990
O’Neil, S., Borrow, J., Vogelsberger, M., Zhao, H., & Wang, B. 2024, Monthly Notices of the Royal Astronomical Society, 530, 3310, 10.1093/mnras/stae990
2024 doi
-
[78]
2007, The Astrophysical Journal, 667, 26, 10.1086/520945
Pedersen, K., & Dahle, H. 2007, The Astrophysical Journal, 667, 26, 10.1086/520945
2007 doi
-
[79]
Peebles, P. J. E. 1980, The Large-Scale Structure of the Universe (Princeton University Press). http://www.jstor.org/stable/j.ctvxrpz4n
1980
-
[80]
, Arnaud, M
Pointecouteau, E. , Arnaud, M. , & Pratt, G. W. 2005, A&A, 435, 1, 10.1051/0004-6361:20042569
2005 doi
-
[81]
2007, A&A, 464, 451, 10.1051/0004-6361:20054708
Popesso, P., Biviano, A., Böhringer, H., & Romaniello, M. 2007, A&A, 464, 451, 10.1051/0004-6361:20054708
2007 doi
-
[82]
2005, A&A, 433, 431, 10.1051/0004-6361:20041915
Popesso, P., Biviano, A., Böhringer, H., Romaniello, M., & Voges, W. 2005, A&A, 433, 431, 10.1051/0004-6361:20041915
2005 doi
-
[83]
W., et al
Pratt , G. W., et al. 2019, Space Science Reviews, 215, 25
2019
-
[84]
2023, Monthly Notices of the Royal Astronomical Society, 522, 4181, 10.1093/mnras/stad1239
Rana, D., More, S., Miyatake, H., et al. 2023, Monthly Notices of the Royal Astronomical Society, 522, 4181, 10.1093/mnras/stad1239
2023 doi
-
[85]
2021, The Astrophysical Journal, 917, 98, 10.3847/1538-4357/ac0c14
Ryu, S., & Lee, J. 2021, The Astrophysical Journal, 917, 98, 10.3847/1538-4357/ac0c14
2021 doi
-
[86]
Sanderson, A. J. R., Edge, A. C., & Smith, G. P. 2009, Monthly Notices of the Royal Astronomical Society, 398, 1698, 10.1111/j.1365-2966.2009.15214.x
2009
-
[87]
1978, The Annals of Statistics, 6, 461 , 10.1214/aos/1176344136
Schwarz, G. 1978, The Annals of Statistics, 6, 461 , 10.1214/aos/1176344136
1978
-
[88]
2015, Monthly Notices of the Royal Astronomical Society, 450, 3665, 10.1093/mnras/stu2505
Sereno, M. 2015, Monthly Notices of the Royal Astronomical Society, 450, 3665, 10.1093/mnras/stu2505
2015 doi
-
[89]
2016, The Astrophysical Journal, 833, 241, 10.3847/1538-4357/833/2/241
Shi, F., Yang, X., Wang, H., et al. 2016, The Astrophysical Journal, 833, 241, 10.3847/1538-4357/833/2/241
2016 doi
-
[90]
2016, Monthly Notices of the Royal Astronomical Society, 459, 3711, 10.1093/mnras/stw925
Shi, X. 2016, Monthly Notices of the Royal Astronomical Society, 459, 3711, 10.1093/mnras/stw925
2016 doi
-
[91]
J., et al
Shin, T., Adhikari, S., Baxter, E. J., et al. 2019, Monthly Notices of the Royal Astronomical Society, 487, 2900, 10.1093/mnras/stz1434
2019 doi
-
[92]
2021, Monthly Notices of the Royal Astronomical Society, 507, 5758, 10.1093/mnras/stab2505
Shin, T., Jain, B., Adhikari, S., et al. 2021, Monthly Notices of the Royal Astronomical Society, 507, 5758, 10.1093/mnras/stab2505
2021 doi
-
[93]
2016, Monthly Notices of the Royal Astronomical Society, 466, 3103, 10.1093/mnras/stw3250
Simet, M., McClintock, T., Mandelbaum, R., et al. 2016, Monthly Notices of the Royal Astronomical Society, 466, 3103, 10.1093/mnras/stw3250
2016 doi
-
[95]
Springel, V., White, S. D. M., Jenkins, A., et al. 2005, Nature, 435, 629–636, 10.1038/nature03597
2005 doi
-
[96]
R., et al
Strateva, I., Željko Ivezić, Knapp, G. R., et al. 2001, The Astronomical Journal, 122, 1861, 10.1086/323301
2001 doi
-
[97]
A., Weinberg, D
Strauss, M. A., Weinberg, D. H., Lupton, R. H., et al. 2002, The Astronomical Journal, 124, 1810–1824, 10.1086/342343
2002 doi
-
[98]
A., & Zeldovich, Y
Sunyaev, R. A., & Zeldovich, Y. B. 1972, Comments on Astrophysics and Space Physics, 4, 173
1972
-
[99]
Sérsic, J. L. 1963, Boletín de la Asociación Argentina de Astronomía, 6, 41
1963
-
[100]
T., Schaye, J., et al
Towler, I., Kay, S. T., Schaye, J., et al. 2024, Monthly Notices of the Royal Astronomical Society, 529, 2017, 10.1093/mnras/stae654
2024 doi
-
[101]
Tully, R. B. 2015, The Astronomical Journal, 149, 54, 10.1088/0004-6256/149/2/54
2015 doi
-
[102]
2017, The Astrophysical Journal, 836, 231, 10.3847/1538-4357/aa5c90
Umetsu, K., & Diemer, B. 2017, The Astrophysical Journal, 836, 231, 10.3847/1538-4357/aa5c90
2017 doi
-
[103]
2020, The Astronomy and Astrophysics Review, 28, 7
Umetsu , K., et al. 2020, The Astronomy and Astrophysics Review, 28, 7
2020
-
[104]
2020, Monthly Notices of the Royal Astronomical Society, 499, 2303, 10.1093/mnras/staa3035
Vallés-Pérez, D., Planelles, S., & Quilis, V. 2020, Monthly Notices of the Royal Astronomical Society, 499, 2303, 10.1093/mnras/staa3035
2020 doi
-
[105]
C., Lewis, G
van den Bosch, F. C., Lewis, G. F., Lake, G., & Stadel, J. 1999, The Astrophysical Journal, 515, 50, 10.1086/307023
1999 doi
-
[106]
2009, The Astrophysical Journal, 692, 1060
Vikhlinin , A., et al. 2009, The Astrophysical Journal, 692, 1060
2009
-
[107]
2014, Monthly Notices of the Royal Astronomical Society, 439, 611, 10.1093/mnras/stt2481
Wang, L., Yang, X., Shen, S., et al. 2014, Monthly Notices of the Royal Astronomical Society, 439, 611, 10.1093/mnras/stt2481
2014 doi
-
[108]
J., & Dolence, J
Wang, Y., Brunner, R. J., & Dolence, J. C. 2013, Monthly Notices of the Royal Astronomical Society, 432, 1961, 10.1093/mnras/stt450
2013 doi
-
[109]
R., Tinker, J
Wetzel, A. R., Tinker, J. L., Conroy, C., & Bosch, F. C. v. d. 2014, Monthly Notices of the Royal Astronomical Society, 439, 2687, 10.1093/mnras/stu122
2014 doi
-
[110]
Wojtak, R., & Łokas, E. L. 2010, Monthly Notices of the Royal Astronomical Society, 408, 2442, 10.1111/j.1365-2966.2010.17297.x
2010
-
[111]
2024, The Astrophysical Journal, 971, 157, 10.3847/1538-4357/ad57c7
Xu, W., Shan, H., Li, R., et al. 2024, The Astrophysical Journal, 971, 157, 10.3847/1538-4357/ad57c7
2024 doi
-
[112]
2020, Monthly Notices of the Royal Astronomical Society, 495, 705, 10.1093/mnras/staa1157
Zenteno, A., Hernández-Lang, D., Klein, M., et al. 2020, Monthly Notices of the Royal Astronomical Society, 495, 705, 10.1093/mnras/staa1157
2020 doi
-
[113]
2019, The Astrophysical Journal, 874, 184, 10.3847/1538-4357/ab08e8
Zürcher, D., & More, S. 2019, The Astrophysical Journal, 874, 184, 10.3847/1538-4357/ab08e8
2019 doi
-
[114]
L., & Mamon, G
Łokas, E. L., & Mamon, G. A. 2001, Monthly Notices of the Royal Astronomical Society, 321, 155, 10.1046/j.1365-8711.2001.04007.x
2001
-
[115]
M., Tyson, J
Željko Ivezić, Kahn, S. M., Tyson, J. A., et al. 2019, The Astrophysical Journal, 873, 111, 10.3847/1538-4357/ab042c
2019 doi
Reviewed August 7, 2026 · model on record in the stance chip above.
Discussion (0). Sign in to comment.