REVIEW 5 major objections 6 minor 41 references
Balanced Area Deprivation Index (bADI): Enhancing social determinants of health indices to strengthen their association with healthcare clinical outcomes, utilization and costs
T0 review · 5 major / 6 minor · reviewed 2026-08-07 · deepseek-v4-flash
Pith's one-line read The balanced ADI, built by Z-score standardizing the 17 census variables before principal factor extraction, tracks clinical outcomes, life expectancy, utilization, and Medicare costs more closely than the standard ADI while sharply…
desk verdict A practical, well-executed evaluation of a housing-balanced ADI variant whose main comparison hinges on an unverified reproduction of the original ADI, plus some overreaching language. read the letter →
The pith
A machine-rendered reading of the paper's core claim, the machinery that carries it, and where it could break.
The reading
What carries the argument
The central mechanism is a single standardization step inserted at the front of the ADI construction pipeline. The original ADI multiplies unstandardized dollar-denominated variables, such as median home value, median gross rent, and median monthly mortgage, by their factor weights, so these housing variables dominate the composite; bADI instead standardizes all 17 variables with Z-scores before applying the principal factor extraction, then rescales the resulting index to a mean of 100 and a standard deviation of 20. To build the index on the same block groups as the official ADI, the paper imputes missing census values with a geographically nested k-nearest-neighbors procedure using five neighbors and applies filtering rules for small populations and group quarters. The standardization is what rebalances the contribution of education, employment, housing, resource access, and income, which is why the housing correlations drop and the outcome correlations rise.
What would settle it
A direct check is to take a sample of census block groups, run the paper's filtering and five-neighbor imputation, compute the resulting ADI national percentiles, and compare them to published ADI values for the same block groups; any systematic mismatch would mean the two indices are not computed on the same populations, and the paper's headline comparisons would be biased.
Extended reading notes
Core claim
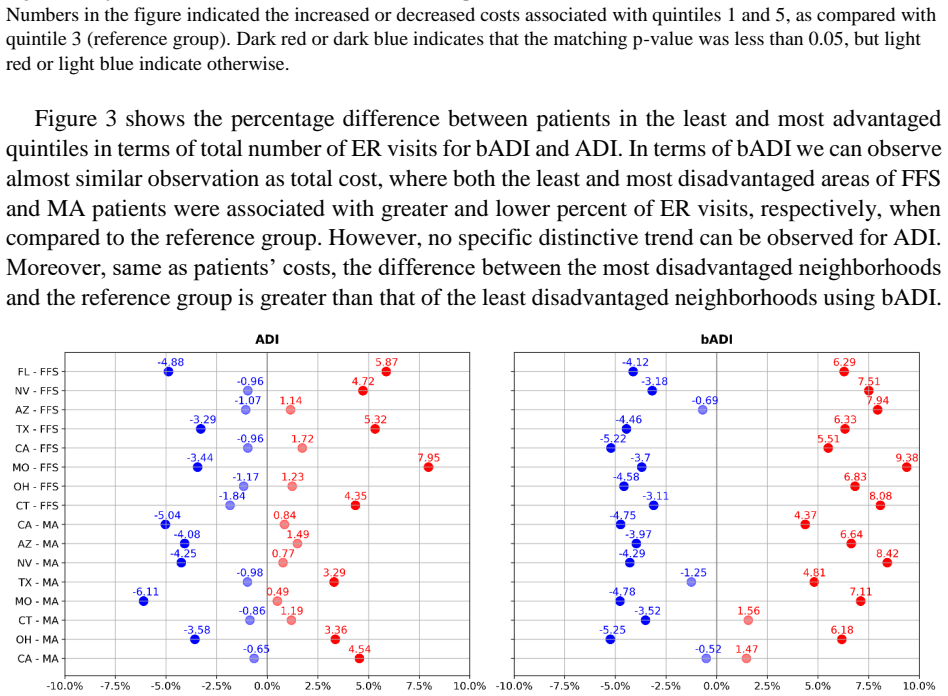
The central discovery is that the ADI's bias toward housing values is a construction artifact, not a property of the underlying data. By converting the 17 input variables to Z-scores before the principal factor extraction, the resulting balanced ADI lowers the median county-level correlation with housing value from 0.90 for the ADI to 0.58, raises the correlation with life expectancy from 0.51 to 0.64, and strengthens the association with most of the 36 county-level health outcome indicators. In a patient-level analysis of one million Medicare fee-for-service and Medicare Advantage beneficiaries, bADI quintiles show that the least-disadvantaged neighborhoods have higher total costs and emergency room visits than the middle quintile, while the most-disadvantaged neighborhoods have lower costs and emergency room visits; the ADI's quintile pattern is flatter and less consistent. The paper concludes that bADI gives accountable care organizations a more accurate tool for budget-neutral resource redistribution.
Load-bearing premise
The load-bearing assumption is that the paper's method for filling in missing census data—using the five nearest neighboring block groups—exactly reproduces the unpublished preprocessing that produced the official ADI values; if it does not, the ADI and bADI are scored on different populations and every comparison in the paper is biased.
Editorial extensions
If this is right
- In expensive metropolitan areas like New York, Boston, and San Francisco, bADI would move many neighborhoods out of the 'advantaged' bottom quintiles where the ADI currently places them, changing which communities are flagged for support.
- If Medicare adopted bADI for accountable care organization benchmarks and equity payments, financial adjustments would shift from less-disadvantaged to more-disadvantaged neighborhoods, because bADI's cost gradient runs opposite to the ADI's.
- The stronger correlations with life expectancy and with most of the 36 clinical outcomes suggest bADI would remain or become a better general-purpose social determinants of health index for population health surveillance, not just for payment.
- The consistent bADI pattern across Medicare fee-for-service and Medicare Advantage patients and across nine states gives payers a more reliable signal for utilization forecasting than the ADI's flatter pattern.
Reading between the lines
- The same Z-score-before-factor-extraction fix could plausibly improve other area-level indices such as the Social Vulnerability Index and Social Deprivation Index, since they share the same dollar-unit imbalance; testing that would require only re-running their published constructions with standardized inputs.
- Because bADI changes the classification of specific neighborhoods, recomputing the 2023 accountable care organization payments under bADI and measuring which organizations gain or lose would provide a concrete, policy-facing test of whether the index change matters in practice.
- The bADI result also suggests a testable mechanism for the observed cost pattern: if housing prices are driving ADI misclassification, then areas with housing price shocks, such as rapidly gentrifying neighborhoods, should show the largest divergence between ADI and bADI cost predictions.
Editorial analysis
A structured set of objections, weighed in public.
Referee Report
Summary. The paper proposes a modified Area Deprivation Index, termed bADI, constructed by Z-score standardizing the 17 ADI variables before principal factor extraction. The authors compare bADI against their own re-computed ADI, as well as the SDI and SVI, using three sets of analyses: (1) correlations with median housing value across US counties and the 20 most expensive metropolitan areas; (2) correlations with 36 county- and tract-level clinical outcomes from PLACES plus USALEEP life expectancy; and (3) patient-level adjusted generalized linear models for total costs and ER visits among roughly one million Medicare FFS and MA beneficiaries across nine states. The paper reports that bADI reduces the dominance of housing values and yields stronger correlations with most clinical outcomes and life expectancy than ADI, and that bADI reveals a more nuanced cost pattern where the most disadvantaged quintile has lower costs than the reference quintile. The authors suggest bADI could be used by CMS ACO programs for equity-based, budget-neutral resource redistribution.
Significance. If the findings are substantiated, the bADI would provide a simple, transparent modification to a policy-relevant index and could be directly useful for CMS's ACO REACH and MSSP equity adjustments, as well as for other payers. The study's strengths include its large patient-level Medicare sample, the use of external clinical outcome benchmarks (PLACES, USALEEP), and the inclusion of multiple SDoH indices for comparison. However, the current manuscript does not provide the evidence needed to support its central claims: the ADI reproduction is not independently verifiable, the comparative claims lack inferential statistics, and the language of prediction goes beyond the associative analyses actually performed. The paper's central idea is plausible and the analyses are potentially re-runnable, but the manuscript in its present form overstates the certainty of its conclusions.
major comments (5)
- [§3.1] The claim that the kNN k=5 imputation and Table A3 filtering reproduce Kind et al.'s ADI scores 'identically' is unsupported because no code, factor weights, or quantitative agreement metrics (e.g., correlation of national percentiles, proportion of exact block-group matches, or agreement of state deciles) are reported. Since every head-to-head comparison uses this self-computed ADI as the baseline, any systematic divergence from the official Neighborhood Atlas ADI could bias the conclusions in either direction. Please release the construction code and report explicit validation statistics against the published ADI national percentiles and state deciles, and specify how the factor analysis was conducted (number of factors retained, rotation, and the exact scoring procedure).
- [§4.2, Tables 2-4] The comparisons of correlation coefficients are presented as point estimates with no confidence intervals or significance tests. For example, Table 4 reports bADI vs ADI correlations of 0.47 vs 0.39 for high cholesterol and Table 3 reports equal correlations of 0.62 for San Jose; without uncertainty estimates these differences cannot be distinguished from sampling noise. Given that the core claims are comparative, please provide bootstrap or analytic confidence intervals for each correlation and formal tests for differences between correlated correlation coefficients (or a paired test across counties/outcomes), and for Table 2 report a test of whether the distribution of county-level correlations is shifted lower for bADI.
- [Abstract, §4.3, §5] The manuscript repeatedly describes the index as 'predicting' healthcare use and costs (e.g., 'more accurately predicted healthcare use and costs', 'the bADI provided more nuanced insights'), but the analysis in §4.3 is an adjusted cross-sectional GLM of associations, not a prediction model. No train/test split, out-of-sample evaluation, or predictive performance metrics (e.g., RMSE, discrimination, calibration) are reported. Please either estimate actual prediction models with appropriate validation, or consistently characterize the results as associations.
- [§4.3, Figures 2-3] The GLM results are displayed only as figures with light/dark colors indicating whether p<0.05; no point estimates, standard errors, or confidence intervals are given for the cost and ER visit ratios. The central new finding is the quintile pattern (Q1 higher and Q5 lower than Q3 for bADI), but the magnitude and precision of these effects are not reported. Please provide tables with exponentiated coefficients and 95% confidence intervals for all states and programs, and clarify whether the models account for clustering at the block-group or state level given the geographic structure of the data.
- [Table 4, §4.2] The comparison of correlations across outcomes with different expected directions is not handled consistently. For preventive care measures such as dental visits, mammography, and checkups, a negative (or lower) correlation with deprivation is the clinically expected direction, so reporting signed correlations without explicit discussion of the expected sign makes 'stronger correlation' ambiguous. In addition, the exceptions (heart disease, cancer, annual checkups) are noted only in passing; a formal test of whether bADI improves correlations across the 36 outcomes (e.g., a sign test or paired test on Fisher-transformed correlations) is needed to support the overall claim.
minor comments (6)
- [§3.1] The text states that 'k=5 yielded results identical to those reported in Kind et al.' but does not report how many block groups were filtered out by Table A3, how many missing values were imputed, or the fraction of block groups with no neighbors in the same tract/county. Please provide these descriptive details.
- [§3.2, Table 2] The manuscript should clarify whether the correlations with housing value are computed on log-transformed or raw housing values, since the ADI's housing variables enter in dollar units; a log transformation could materially change the correlations.
- [Table 1] The layout of Table 1 is confusing because the FFS and MA columns are interleaved without clear column headers. Please reformat with explicit headers for 'Medicare Program', 'State', 'Total patients', 'Male (%)', and 'Average age'.
- [§4.3] There is a typo: 'for FFS and MS patients' should be 'for FFS and MA patients'.
- [Figures 2-3] The color-only distinction between p<0.05 and non-significant results is not accessible to color-blind readers; please add hatching, asterisks, or numeric labels.
- [§5] The claim that the results support 'budget-neutral redistributions of resources' is a policy recommendation that does not follow directly from the cross-sectional analyses; please soften or explicitly describe the additional assumptions needed.
Circularity Check
No circularity: bADI is constructed purely from ACS variables and benchmarked against external outcomes.
full rationale
The derivation of bADI is self-contained: Section 3.1 defines it by Z-score standardizing the same 17 ACS variables used by ADI and then applying principal factor extraction; no healthcare outcome, cost, or utilization value enters the index construction. The clinical, life-expectancy, and financial benchmarks (PLACES, USALEEP, OLDW) are external to the index construction, so the reported stronger correlations are not fitted outputs of the construction procedure. The housing-correlation experiments measure a property that the standardization was designed to reduce, but the paper presents this as an evaluation check ('ensur[e] that bADI resolved the main issue with ADI') rather than as a prediction; the correlation magnitudes still depend on the estimated factor structure and are not equal to the input by construction. No load-bearing self-citation is used: the methodological antecedents (Singh 2003, Kind et al. 2014, Zhang et al. 2020) are external published works, not the authors' own prior results. The manuscript itself flags the one legitimate reproducibility concern in Section 3.1 — that Kind et al.'s preprocessing is 'not publicly documented' and was reproduced via kNN imputation with k=5 — but this is a validity issue about the ADI comparator, not circularity in bADI's derivation, because bADI's construction does not depend on the ADI values against which it is compared. The central claim therefore retains independent empirical content.
Assumptions & free parameters
free parameters (1)
- k in kNN imputation =
5
assumptions (5)
- domain assumption The 17 ACS variables from Singh and Kind constitute a valid measure of neighborhood socioeconomic deprivation.
- domain assumption Reducing the correlation of the index with housing value yields a better SDoH index.
- domain assumption PLACES and USALEEP outcome estimates are valid external benchmarks for health outcomes.
- ad hoc to paper The kNN imputation with k=5 reproduces the unpublished Kind et al. ADI preprocessing exactly.
- domain assumption Higher correlation with clinical outcomes implies better predictive validity for resource allocation.
invented entities (1)
-
bADI (balanced Area Deprivation Index)
independent evidence
Cite this review
Pith. "Pith review of Balanced Area Deprivation Index (bADI): Enhancing social determinants of health indices to strengthen their association with healthcare clinical outcomes, utilization and costs." pith.science (2026). https://pith.science/paper/PLYKQKL7
@misc{pith2026250608131,
  author       = {Pith},
  title        = {Pith review of: Balanced Area Deprivation Index (bADI): Enhancing social determinants of health indices to strengthen their association with healthcare clinical outcomes, utilization and costs},
  year         = {2026},
  howpublished = {\url{https://pith.science/paper/PLYKQKL7}},
  note         = {Machine review of arXiv:2506.08131}
}
read the original abstract
Background: As value-based care expands across the U.S. healthcare system, reducing health disparities has become a priority. Social determinants of health (SDoH) indices, like the widely used Area Deprivation Index (ADI), guide efforts to manage patient health and costs. However, the ADI's reliance on housing-related variables (e.g., median home value) may reduce its effectiveness, especially in high-cost regions, by masking inequalities and poor health outcomes. Methods: To overcome these limitations, we developed the balanced ADI (bADI), a new SDoH index that reduces dependence on housing metrics through standardized construction. We evaluated the bADI using data from millions of Medicare Fee-for-Service and Medicare Advantage beneficiaries. Correlation analyses measured its association with clinical outcomes, life expectancy, healthcare use, and cost, and compared results to the ADI. Results: The bADI showed stronger correlations with clinical outcomes and life expectancy than the ADI. It was less influenced by housing costs in expensive regions and more accurately predicted healthcare use and costs. While ADI-based research suggested both the most and least disadvantaged groups had higher healthcare costs, the bADI revealed a more nuanced pattern, showing more accurate cost differences across groups. Conclusions: The bADI offers stronger predictive power for healthcare outcomes and spending, making it a valuable tool for accountable care organizations. By reallocating resources from less to more disadvantaged areas, ACOs could use the bADI to promote equity and cost-effective care within population health initiatives.
Figures

Reference graph
Works this paper leans on
-
[1]
Introduction Recently, both the health care community and government agencies have begun to increase their focus on policies and programs which address inequities in the healthcare system. As a result, there is a strong need for comprehensive, accurate, and easily accessible measures of SDoH to guide resource allocation (1). In line with these changes, th...
work page 2022
-
[2]
Background 2.1. Area deprivation index Socioeconomic disadvantage refers to the challenges patients may face in their neighborhoods due to factors suc h as low income, limited education, and substandard living conditions (15). Assessing an individual’s socioeconomic status can be a resource-intensive and often impractical task (16,17). As an alternative, ...
-
[3]
Methods 3.1. Social barrier index To develop bADI we extracted the same 17 variables proposed in Singh (4) and adapted in Kind et al. (7) from the American Community Survey (ACS) data (29), which provides five year estimates of income, education, employment, health insurance cov erage, and housing costs and conditions for residents of the United States (3...
work page 2022
-
[4]
Results 4.1 Association of bADI with housing value Figure 1 and Table 2 examine the association of ADI and bADI with house value across over 3,200 census counties. As seen, aligned with the literature (1,3), ADI places a heavy emphasis on housing correlation, but bADI mitigates this issue. The raw Pearson correlations of ADI and bADI to the housing value ...
work page 2022
-
[5]
Discussion The research had three primary objectives. First, we addressed the ADI index’s strong dependency with house value by standardizing the construction factors. Second, we performed an extensive evaluation to ensure that the new bADI index demonstrates significant association with previously observed clinical outcomes in the literature. Third, for ...
-
[6]
Conclusion This study aimed to develop an SDoH index that places balanced emphasis on education, employment, housing, resource access, and income. The findings indicate that this enhanced ADI index is strongly associated with patients' clinical outcomes. Additionally, we provide detailed national evidence demonstrating a strong relationship between the in...
-
[7]
Author Statements Ethical approval. Ethical approval was not necessary for this study since it did not involve human or animal subjects or any unanonymized data. The OLDW is a real -world database that contains only de-identified information. Availability of data and materials . The ACS datasets gen erated bADI during the current study are available in th...
-
[8]
Area Deprivation Index Predicts Readmission Risk at an Urban Teaching Hospital
Hu J, Kind AJH, Nerenz D. Area Deprivation Index Predicts Readmission Risk at an Urban Teaching Hospital. Am J Med Qual. 2018 Sep 1;33(5):493–501
work page 2018
Show all 41 references
-
[9]
The Neighborhood Atlas Area Deprivation Index For Measuring Socioeconomic Status: An Overemphasis On Home Value
Hannan EL, Wu Y, Cozzens K, Anderson B. The Neighborhood Atlas Area Deprivation Index For Measuring Socioeconomic Status: An Overemphasis On Home Value. Health Aff. 2023 May 1;42(5):702 –9
2023
-
[10]
The Area Deprivation Index Is The Most Scientifically Validated Social Exposome Tool Available For Policies Advancing Health Equity
Powell WR, Sheehy AM, Kind AJH. The Area Deprivation Index Is The Most Scientifically Validated Social Exposome Tool Available For Policies Advancing Health Equity. Heal Aff Forefr. 2023
2023
-
[11]
ACO Benchmarks Based On Area Deprivation Index Mask Inequities
Azar KMJ, Alexander M, Smits K, Tio A, DeGhetaldi L. ACO Benchmarks Based On Area Deprivation Index Mask Inequities. Heal Aff Forefr. 2023
2023
-
[12]
Area Deprivation and Widening Inequalities in US Mortality, 1969 –1998
Singh GK. Area Deprivation and Widening Inequalities in US Mortality, 1969 –1998. Am J Public Health. 2003 Oct 10;93(7):1137–43
1969
-
[13]
Measuring disadvantage: A systematic comparison of United States small-area disadvantage indices
Lou S, Giorgi S, Liu T, Eichstaedt JC, Curtis B. Measuring disadvantage: A systematic comparison of United States small-area disadvantage indices. Health Place. 2023 Mar 1;80:102997
2023
-
[14]
Reflections accompanying a report on addressing social drivers of health: evaluating area-level indices
Sheingold S, Zuckerman R, Alberto C, Samson L, Lee E, Aysola V. Reflections accompanying a report on addressing social drivers of health: evaluating area-level indices. 2022
2022
-
[15]
Neighborhood socioeconomic disadvantage and 30-day rehospitalization: A retrospective cohort study
Kind AJH, Jencks S, Brock J, Yu M, Bartels C, Ehlenbach W, et al. Neighborhood socioeconomic disadvantage and 30-day rehospitalization: A retrospective cohort study. Ann Intern Med. 2014 Dec 2;161(11):765–74
2014
-
[16]
Peer Reviewed: Integrating Social Determinants of Health With Treatment and Prevention: A New Tool to Assess Local Area Deprivation
Maroko AR, Doan TM, Arno PS, Hubel M, Yi S, Viola D. Peer Reviewed: Integrating Social Determinants of Health With Treatment and Prevention: A New Tool to Assess Local Area Deprivation. Prev Chronic Dis. 2016;13(9)
2016
-
[17]
The Relationship Between Neighborhood Disadvantage and Kidney Disease Progression in the Chronic Kidney Disease in Children (CKiD) Cohort
Boynton SA, Matheson MB, Ng DK, Hidalgo G, Warady BA, Furth SL, et al. The Relationship Between Neighborhood Disadvantage and Kidney Disease Progression in the Chronic Kidney Disease in Children (CKiD) Cohort. Am J Kidney Dis. 2022 Aug 1;80(2):207–14
2022
-
[18]
The Area Deprivation Index Corresponds Effectively With Other Measures of Objective Socioeconomic Status in Adults With Chronic Low Back Pain
Jackson P, Jablonski R, Goodin BR, Long DL, Penn TM, Sims AM, et al. The Area Deprivation Index Corresponds Effectively With Other Measures of Objective Socioeconomic Status in Adults With Chronic Low Back Pain. J Nurs Meas. 2022 Sep 9;30(3):433
2022
-
[19]
Association of Socioeconomic Disadvantage With Long-term Mortality After Myocardial Infarction: The Mass General Brigham YOUNG- MI Registry
Berman AN, Biery DW, Ginder C, Singh A, Baek J, Wadhera RK, et al. Association of Socioeconomic Disadvantage With Long-term Mortality After Myocardial Infarction: The Mass General Brigham YOUNG- MI Registry. JAMA Cardiol. 2021 Aug 1;6(8):880–8
2021
-
[20]
Measuring the Effect of Social Determinants on Patient Outcomes: A Systematic Literature Review
Knighton AJ, Stephenson B, Savitz LA. Measuring the Effect of Social Determinants on Patient Outcomes: A Systematic Literature Review. J Health Care Poor Underserved. 2018 Feb 1;29(1):81–106
2018
-
[21]
Introduction of an Area Deprivation Index Measuring Patient Socioeconomic Status in an Integrated Health System: Implications for Population Health
Knighton AJ, Savitz L, Belnap T, Stephenson B, VanDerslice J. Introduction of an Area Deprivation Index Measuring Patient Socioeconomic Status in an Integrated Health System: Implications for Population Health. EGEMS (Washington, DC). 2016 Aug 11;4(3):9
2016
-
[22]
Re-examination of Neighbourhood Atlas Area Deprivation Index for Risk - Adjusting PCI Outcomes
Hannan EL, Wu Y, Cozzens K. Re-examination of Neighbourhood Atlas Area Deprivation Index for Risk - Adjusting PCI Outcomes. Can J Cardiol. 2023 Sep 1;39(9):1228
2023
-
[23]
Measurement of socioeconomic status in health disparities research
Shavers VL. Measurement of socioeconomic status in health disparities research. J Natl Med Assoc. 2007 Sep;99(9):1013
2007
-
[24]
Factor analysis model evaluation through likelihood cross -validation
Knafl GJ, Grey M. Factor analysis model evaluation through likelihood cross -validation. Stat Methods Med Res. 2007 Apr 1;16(2):77–102
2007
-
[25]
The ADI -3: a revised neighborhood risk index of the social determinants of health over time and place
Berg KA, Dalton JE, Gunzler DD, Coulton CJ, Freedman DA, Krieger NI, et al. The ADI -3: a revised neighborhood risk index of the social determinants of health over time and place. Heal Serv Outcome s Res Methodol. 2021 Dec 1;21(4):486–509
2021
-
[26]
Why Are Some People Healthy and Others Not?: The determinants of health of populations
Evans RG, Barer ML, Marmor TR. Why Are Some People Healthy and Others Not?: The determinants of health of populations. Why are some People Healthy and Others Not?: The Determinants of Health of Populations. De Gruyter; 1994. 1–380 p
1994
-
[27]
A Novel Approach to Developing Disease and Outcome−Specific Social Risk Indices
Korvink M, Gunn LH, Molina G, Hackner D, Martin J. A Novel Approach to Developing Disease and Outcome−Specific Social Risk Indices. Am J Prev Med. 2023 Oct 1;65(4):727 –34
2023
-
[28]
The Impact of Disability and Social Determinants of Health on Condition-Specific Readmissions beyond Medicare Risk Adjustments: A Cohort Study
Meddings J, Reichert H, Smith SN, Iwashyna TJ, Langa KM, Hofer TP, et al. The Impact of Disability and Social Determinants of Health on Condition-Specific Readmissions beyond Medicare Risk Adjustments: A Cohort Study. J Gen Intern Med. 2017 Jan 1;32(1):71–80
2017
-
[29]
Landscape of Area-Level Deprivation Measures and Other Approaches to Account for Social Risk and Social Determinants of Health in Health Care Payments
RAND Health Care. Landscape of Area-Level Deprivation Measures and Other Approaches to Account for Social Risk and Social Determinants of Health in Health Care Payments. Office of the Assistant Secretary for Planning and Evaluation (ASPE) at the US Department of Health & Human...
2022
-
[30]
ACO REACH And Advancing Equity Through Value-Based Payment, Part 1
Bleser WK, Tchuisseu YP, Shen H, Thoumi A, Amin C, Kaye DR, et al. ACO REACH And Advancing Equity Through Value-Based Payment, Part 1. Heal Aff Forefr. 2022
2022
-
[31]
Making Neighborhood-Disadvantage Metrics Accessible — The Neighborhood Atlas
Kind AJH, Buckingham WR. Making Neighborhood-Disadvantage Metrics Accessible — The Neighborhood Atlas. N Engl J Med. 2018 Jun 6;378(26):2456
2018
-
[32]
OptumLabs Data Warehouse (OLDW) [Internet]
OptumLabs. OptumLabs Data Warehouse (OLDW) [Internet]. Available from: https://www.optumlabs.com/work/improving-quality/quality-measures-reporting/public-report- resources.html#data
-
[33]
Determining the feasibility of an index of the social determinants of health using data from public sources
Wang A, Kho AN, Black B, French DD. Determining the feasibility of an index of the social determinants of health using data from public sources. Informatics Heal Soc Care. 2021 Jun 2;46(2):205 –17
2021
-
[34]
Quantification of Neighborhood-Level Social Determinants of Health in the Continental United States
Kolak M, Bhatt J, Park YH, Padrón NA, Molefe A. Quantification of Neighborhood-Level Social Determinants of Health in the Continental United States. JAMA Netw Open. 2020 Jan 3;3(1):e1919928 – e1919928
2020
-
[35]
Artificially Intelligent Social Risk Adjustment: Development and Pilot Testing in Ohio
Lines LM, Long MC, Humphrey JL, Nguyen CT, Scanlon S, Berzin OKG, et al. Artificially Intelligent Social Risk Adjustment: Development and Pilot Testing in Ohio. 2022 Sep 29
2022
-
[36]
Association between Residential Neighborhood Social Conditions and Health Care Utilization and Costs
Zhang Y, Ancker JS, Hall J, Khullar D, Wu Y, Kaushal R. Association between Residential Neighborhood Social Conditions and Health Care Utilization and Costs. Med Care. 2020 Jul 1;58(7):586 –93
2020
-
[37]
Census Bureau
U.S. Census Bureau. American Community Survey Data [Internet]. Available from: https://www.census.gov/programs-surveys/acs/data.html
-
[38]
Income Inequality and Child Maltreatment in the United States
Eckenrode J, Smith EG, McCarthy ME, Dineen M. Income Inequality and Child Maltreatment in the United States. Pediatrics. 2014 Mar 1;133(3):454–61
2014
-
[39]
Missing value estimat ion methods for DNA microarrays
Troyanskaya O, Cantor M, Sherlock G, Brown P, Hastie T, Tibshirani R, et al. Missing value estimat ion methods for DNA microarrays. Bioinformatics. 2001 Jun 1;17(6):520 –5
2001
-
[41]
Significance testing of the spearman rank correlation coefficient
Zar JH. Significance testing of the spearman rank correlation coefficient. J Am Stat Assoc. 1972;67(339):578–80. Appendix Table A1. Comparison of ADI, SVI and SDI. Feature / Index ADI SVI SDI Developer University of Wisconsin – Health Innovation Program Centers for Disease Con...
1972
-
[2023]
Dark red or dark blue indicates that the matching p-value was less than 0.05, but light red or light blue indicate otherwise
Numbers in the figure indicated the percent increased or decreased number of ER visits associated with quintiles 1 and 5, as compared with quintile 3 (reference group). Dark red or dark blue indicates that the matching p-value was less than 0.05, but light red or light blue in...
Reviewed August 7, 2026 · model on record in the stance chip above.
Discussion (0). Sign in to comment.