REVIEW 3 major objections 6 minor 38 references
Integrated Galaxy Light from Stacking $10^5$ Random Pointings in the Dark Energy Survey Data
T0 review · 3 major / 6 minor · reviewed 2026-08-07 · deepseek-v4-flash
Pith's one-line read Galaxy background light measured by stacking 100,000 sky patches
desk verdict The stacking idea is interesting, but the R-dependent curve they fit is largely a normalization artefact, so the reported IGL values are probably biased high. read the letter →
The pith
A machine-rendered reading of the paper's core claim, the machinery that carries it, and where it could break.
The reading
What carries the argument
The central mechanism is the stacked-image difference: the weighted average of images with stars masked minus the weighted average of images with both stars and galaxies masked, computed over roughly 100,000 cutouts per band. Because every stack is the same set of images with different pixels masked, foregrounds, sky background, and instrumental noise cancel in the difference. Source extraction and classification into stars, galaxies, and unclassified objects are done with SourceExtractor on co-added detection images, and circular masks with six dilation radii (5 to 15 pixels) generate the family of masked stacks. Equation (8), a Sersic-inspired curve that asymptotes to $I_e$, is the object that converts finite-mask measurements into a total IGL estimate.
What would settle it
Run the same stacking and masking pipeline on a deep reference field such as the COSMOS or CANDELS area, where the true IGL is known from galaxy counts to fainter limits; if the fitted $I_e$ does not reproduce the reference value, the functional-form extrapolation is incorrect. For the $Y$-band specifically, extending the mask radius to 20-30 pixels with deeper co-adds would show whether the measured brightness continues climbing toward the fitted asymptote or has already converged.
Extended reading notes
Core claim
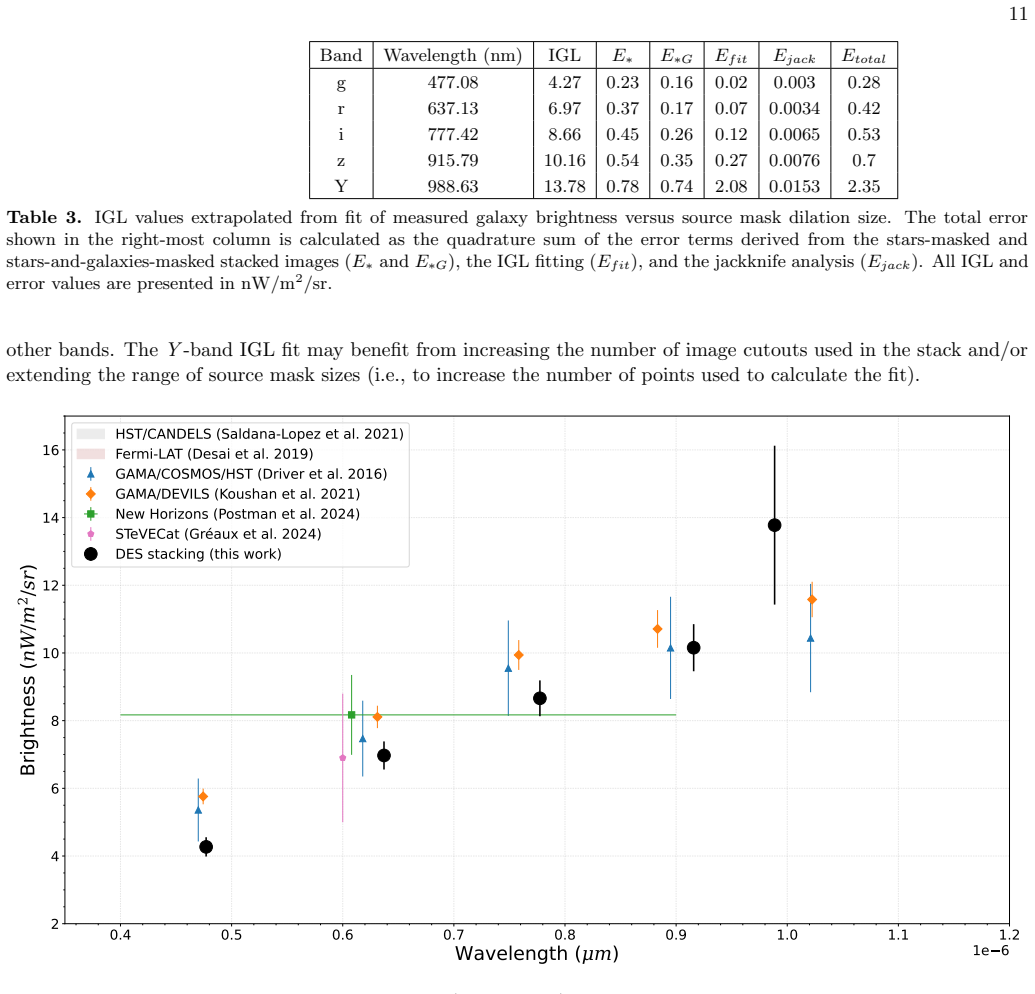
On the paper's own terms, the central discovery is that the difference in brightness between a stack of random sky positions with stars masked and a stack with both stars and galaxies masked yields a clean measurement of galaxy light, $I_G(R)$, and that this quantity rises with mask radius toward an asymptotic value that represents the total integrated galaxy light. The authors fit the measured $I_G(R)$ at mask radii of 5 to 15 pixels with an empirically adopted Sersic-inspired function, $I_G(R) = I_e\left[1-\exp\left(-7.669\left[(R/R_e)^{1/n}-1\right]\right)\right]$, and take the fitted $I_e$ as the IGL. They report $g=4.27\pm0.28$, $r=6.97\pm0.42$, $i=8.66\pm0.53$, $z=10.16\pm0.7$, and $Y=13.78\pm2.35$ nW/m$^2$/sr. These measurements require no foreground estimation or removal, and they agree with IGL values derived from galaxy counts and gamma-ray absorption, with the $Y$-band value lying higher than previous estimates.
Load-bearing premise
The assumption that the adopted Sersic-inspired function correctly describes how the measured galaxy brightness grows with mask radius beyond the probed range of 5 to 15 pixels is what carries the extrapolation from finite masks to a total IGL value.
Editorial extensions
If this is right
- The IGL can be measured from the ground without modeling zodiacal light, diffuse galactic light, or atmospheric emission, because these are common to all stacks and cancel in the difference.
- The technique yields values consistent with galaxy-count and gamma-ray IGL estimates, supporting the conclusion that resolved galaxies make up essentially the entire cosmic optical background.
- Because the method is insensitive to diffuse light by construction, it cleanly separates the source-attributable component of the background from any truly diffuse signal.
- The same stacking pipeline can be applied to other wide-field surveys, including Sloan Digital Sky Survey, WISE, Pan-STARRS, and future Rubin, Euclid, and Roman data, to extend IGL measurements to other wavelengths and sky regions.
- The derived star light and unclassified-source light fractions (roughly two-thirds and about one percent of total brightness) provide a consistency check on source classification.
Reading between the lines
- Applied to wide-field archival data from other surveys, the same difference-of-stacks technique could produce IGL measurements over much of the sky with small cosmic variance, turning many ground-based datasets into IGL probes.
- If the $Y$-band excess is real, it may indicate light in the outer envelopes of galaxies that shallower number-count surveys miss, which would deepen the tension with galaxy-count IGL at near-infrared wavelengths; if it is a fit artifact, it will vanish when deeper $Y$-band stacks or larger mask radii are used.
- The negative background measured in the all-sources-masked stacks implies that the DES background is overestimated, and the method's ability to cancel this in the difference is a direct test of the claim that no foreground estimation is needed: any foreground that differs between the two stacks would leak into the IGL.
Editorial analysis
A structured set of objections, weighed in public.
Referee Report
Summary. Moore et al. present a stacking-based measurement of the integrated galaxy light (IGL). They extract roughly 98,713 random 1x1 arcminute cutouts from DES DR2 in g, r, i, z, and Y, identify sources with SExtractor, classify them as stars, galaxies, or 'other', and build circular masks of radius 5, 7, 9, 11, 13, and 15 pixels. They co-add four mask variants and define the galaxy brightness I_G(R) as the difference between the stars-masked and the stars-plus-galaxies-masked stacked images. They then fit an empirically adopted Sersic-inspired function, Eq. (8), to I_G(R) as a function of mask radius and extrapolate to infinite radius to obtain IGL values of g=4.27±0.28, r=6.97±0.42, i=8.66±0.53, z=10.16±0.70, and Y=13.78±2.35 nW/m2/sr. The paper's central claim is that these values require no foreground estimation or removal and agree with previous IGL estimates from galaxy number counts and gamma-ray observations.
Significance. If the method is valid, it is a valuable complement to number-count IGL measurements: it uses a very large number of random pointings, covers a wide area with low cosmic variance, and avoids explicit modeling of zodiacal light, diffuse Galactic light, and atmospheric emission by taking differences of stacks built from the same images. The paper also includes jackknife tests and compares with several independent data sets. However, the central numerical results rest entirely on interpreting I_G(R) as the cumulative galaxy light within a mask radius and on extrapolating an unvalidated functional form far beyond the measured range, particularly in the Y band. The paper does not provide image simulations or a forward model connecting the measured aperture differences to the galaxy light profile, and the adopted fitting function is internally inconsistent with the Sersic form it claims to be inspired by. The idea has merit, but the reported IGL values are not established by the analysis as presented.
major comments (3)
- [Sec. 4.3, Eq. (3), Table 1] The quantity I_G(R) defined by Eq. (3) is not the cumulative galaxy light within mask radius R, so fitting Eq. (8) to it does not directly measure an IGL. The stacked images are weighted averages over different sets of unmasked pixels: the stars-masked stack averages over N_1 pixels, while the stars-plus-galaxies-masked stack averages over N_1 - m(R) pixels, where m(R) is the area of the galaxy masks. For a single galaxy of total flux F and enclosed flux F(<R), the difference of the two aperture-averaged brightnesses is approximately [F(<R) - (m/N) F]/(N - m), not F(<R). The R-dependence of I_G therefore contains a mask-area normalization term in addition to the galaxy light profile. Table 1 shows that the 'Total Brightness' column, which is derived from the same unmasked stack, increases from 17.92 to 18.18 nW/m2/sr as R goes from 5 to 15 pixels, demonstrating that the mean-brightness normalization in the pipeline is R-dependent. The authors do not derive the relation between Eq. (3) and the true cumulative light profile. Until this is done, or the pipeline is validated with image simulations, the fitted I_e values in Table 2 cannot be identified with the integrated galaxy light.
- [Sec. 4.3, Eq. (8), Fig. 7, Table 2] Equation (8) is introduced as 'inspired by the Sersic profile' but it is not a Sersic cumulative profile: the constant 7.669 is the Sersic b_n appropriate for n=4, while n is a free parameter fitted to values between 14.8 and 77.6. More importantly, no derivation, no comparison to alternative profile families, and no systematic error for the adopted functional form are provided. The extrapolation is particularly severe in the Y band, where the measured points end at 9.35 nW/m2/sr at R=15 and the fitted I_e is 13.78 nW/m2/sr, implying that about 32% of the signal lies beyond the largest measured mask radius, and the fitted n=77.6±31.7 is essentially unconstrained. The E_fit error in Table 3 only reflects the statistical uncertainty of the fit to the chosen function. A mock-injection test, or at least a battery of alternative profile families, is needed to establish that the extrapolated I_e values are robust and unbiased.
- [Secs. 3.2 and 4.1, Eq. (3)] Equation (3) assumes that the only difference between the stars-masked and stars-plus-galaxies-masked stacks is galaxy light. In practice, galaxy masks are circular apertures that can overlap stars and 'other' sources; any star or other-source light inside a galaxy mask is removed in the second stack but not in the first, so it is attributed to I_G. Given that the stars column in Table 1 is roughly two-thirds of the total brightness, even a small overlap fraction could bias the galaxy signal. The authors should quantify the overlap of the three mask sets and demonstrate that its contribution to I_G is negligible, or construct disjoint masks before taking the difference.
minor comments (6)
- [Abstract and Sec. 5] The abstract states that all measurements are in agreement with previous IGL values, while Section 5 says the Y-band value is significantly higher than previously reported values; please reconcile this inconsistency.
- [Fig. 2] The axis tick labels appear to be missing minus signs on the negative values; the current labels are visually confusing.
- [Sec. 3.3] The text says 'all of the stacked images in which all detected sources are masked have all negative pixel values,' but Figure 5 shows distributions with negative means rather than all pixels negative; please rephrase.
- [Eq. (5)] The surface-brightness conversion is written with 'counts/sec' rather than 'counts/sec/pixel' before dividing by the pixel area; please clarify the units in the equation.
- [Table 1 caption] Please specify whether 'normalized by the average brightness of the image with all sources masked' means subtraction or division, and explain why this normalization is applied only to the total-brightness column.
- [Table 2] The R_e values are reported in pixels; giving the values in arcseconds as well would make the physical scale of the fitted profiles easier to assess.
Circularity Check
No circularity found: the IGL values are fitted to direct stacked-image differences, not derived from prior IGL inputs or self-citations.
full rationale
The derivation chain is self-contained. The measured quantities I_G(R) are computed from direct aperture photometry of stacked images with and without galaxy masks (Eq. 3), using the same set of 98,713 cutouts. The central IGL values are obtained by fitting the empirical function in Eq. 8 to the six I_G(R) points per band; the fitted parameters I_e, R_e, and n are all free and are not constrained by any prior IGL measurement. No literature value, external model, or self-citation is used as an input to the fit. The agreement with previously reported IGL values is presented only as a post-hoc comparison, which is an external benchmark rather than a circular validation. The paper does not invoke a uniqueness theorem or import an ansatz from prior work by the same authors; Eq. 8 is introduced in this paper as an 'empirically adopted function.' The main caveat is that the fitted I_e values depend on the assumed functional form and on extrapolation beyond the largest mask radius, but this is a model-dependence/correctness concern, not circular reasoning. In particular, the skeptic's claim that I_G(R) is merely a masked-pixel normalization artifact is not supported by the paper's equations: I_G(R) is the difference between two weighted means with different unmasked-pixel sets, so it depends on how much galaxy light is removed by the larger masks. The paper therefore measures its target quantity from independent image data rather than reducing to its own inputs by construction.
Assumptions & free parameters
free parameters (6)
- Source classification line: mag = -6 log(FLUX_RADIUS) + 24.2 =
slope -6, intercept 24.2
- Faint magnitude cut for galaxy classification =
25.5 mag
- Minimum log(FLUX_RADIUS) cut =
-0.325
- Sersic-inspired fit parameters R_e and n per band =
g: 0.0767 px, 14.81; r: 0.00868 px, 24.71; i: 0.00346 px, 28.77; z: 0.00108 px, 38.07; Y: 0.000337 px, 77.58
- I_e (extrapolated IGL amplitude) =
4.27, 6.97, 8.66, 10.16, 13.78 nW/m2/sr
- Mean E(B-V) =
0.024
assumptions (6)
- domain assumption DES DR2 coadd images are already background-subtracted with a uniform zero point of 30.0 mag.
- domain assumption Foregrounds (zodiacal light, diffuse Galactic light, airglow) and instrumental noise are common to all stacks and cancel exactly in the differences.
- ad hoc to paper The empirical function in Eq. 8, inspired by the Sersic profile, describes how measured galaxy light depends on mask radius for radii beyond 15 pixels.
- domain assumption Sources classified as galaxies are the dominant contributors to the IGL, and the unclassified 'other' sources can be neglected in the IGL estimate.
- domain assumption The mean brightness within a 25 arcsecond circular aperture of the stacked random positions estimates the mean IGL per steradian without cosmic variance bias.
- domain assumption The global mean E(B-V) correction applies to the stack average.
Cite this review
Pith. "Pith review of Integrated Galaxy Light from Stacking $10^5$ Random Pointings in the Dark Energy Survey Data." pith.science (2026). https://pith.science/paper/CSV2ZSTK
@misc{pith2026250608162,
  author       = {Pith},
  title        = {Pith review of: Integrated Galaxy Light from Stacking $10^5$ Random Pointings in the Dark Energy Survey Data},
  year         = {2026},
  howpublished = {\url{https://pith.science/paper/CSV2ZSTK}},
  note         = {Machine review of arXiv:2506.08162}
}
abstract
We present a new technique for measuring the integrated galaxy light (IGL) with stacked image data from the Dark Energy Survey (DES). We extract $1\times1$ arcminute cutouts from nearly 100,000 randomly selected positions in the g, r, i, z, and Y bands from the DES data release 2 (DR2) maps. We generate source catalogs and masks for each cutout and the images are subsequently stacked to generate deep images of the sky both with and without sources. The IGL is then calculated by taking the difference in average brightness between stacks that contain galaxies and stacks in which galaxies have been masked. We find IGL values of $g = 4.27 \pm 0.28, r = 6.97 \pm 0.42, i = 8.66 \pm 0.53, z = 10.16 \pm 0.7,$ and $Y = 13.78 \pm 2.35$ nW/m$^2$/sr. These measurements, which require no foreground estimation or removal, are in agreement with previously reported IGL values derived from galaxy number counts and other methods. This stacking technique reduces the sensitivity to diffuse local backgrounds but is not sensitive to large-scale diffuse extragalactic background light.
Figures


Figures from the paper (6 more)


Reference graph
Works this paper leans on
-
[1]
Abbott, T. M. C., Abdalla, F. B., Allam, S., et al. 2018, ApJS, 239, 18, doi: 10.3847/1538-4365/aae9f0
-
[2]
Acciari, V. A., Ansoldi, S., Antonelli, L. A., et al. 2019, MNRAS, 486, 4233, doi: 10.1093/mnras/stz943
-
[3]
Aharonian, F., Akhperjanian, A. G., Bazer-Bachi, A. R., et al. 2006, Nature, 440, 1018, doi: 10.1038/nature04680
-
[4]
2019, arXiv e-prints, arXiv:1902.05569, doi: 10.48550/arXiv.1902.05569
Akeson, R., Armus, L., Bachelet, E., et al. 2019, arXiv e-prints, arXiv:1902.05569, doi: 10.48550/arXiv.1902.05569
-
[5]
Bernstein, R. A. 2007, ApJ, 666, 663, doi: 10.1086/519824
doi:10.1086/519824 2007
-
[6]
2002, in Astronomical Society of the Pacific Conference Series, Vol
Bertin, E., Mellier, Y., Radovich, M., et al. 2002, in Astronomical Society of the Pacific Conference Series, Vol. 281, Astronomical Data Analysis Software and Systems XI, ed. D. A. Bohlender, D. Durand, & T. H. Handley, 228
2002
-
[7]
1996, A&AS, 117, 393, doi: 10.1051/aas:1996164
Bertin, E., & Arnouts, S. 1996, A&AS, 117, 393, doi: 10.1051/aas:1996164
-
[8]
Biteau, J., & Williams, D. A. 2015, ApJ, 812, 60, doi: 10.1088/0004-637X/812/1/60
Show all 38 references
-
[9]
2022, astropy/photutils: 1.5.0, 1.5.0, Zenodo, doi: 10.5281/zenodo.6825092
Bradley, L., Sip˝ ocz, B., Robitaille, T., et al. 2022, astropy/photutils: 1.5.0, 1.5.0, Zenodo, doi: 10.5281/zenodo.6825092
2022 doi
-
[10]
A., O’Brien, R., et al
Carleton, T., Windhorst, R. A., O’Brien, R., et al. 2022, AJ, 164, 170, doi: 10.3847/1538-3881/ac8d02
2022 doi
- [11]
-
[12]
Cooray, A. 2016, R. Soc. Open Sci., 3, 150555, doi: 10.1098/rsos.150555 DES Collaboration. 2021, A&AS, 255, 20, doi: 10.3847/1538-4365/ac00b3
2016 doi
-
[13]
2019, ApJL, 874, L7, doi: 10.3847/2041-8213/ab0c10 Dor´ e, O., Bock, J., Ashby, M., et al
Desai, A., Helgason, K., Ajello, M., et al. 2019, ApJL, 874, L7, doi: 10.3847/2041-8213/ab0c10 Dor´ e, O., Bock, J., Ashby, M., et al. 2014, arXiv e-prints, arXiv:1412.4872, doi: 10.48550/arXiv.1412.4872
- [14]
-
[15]
P., & Robotham, A
Driver, S. P., & Robotham, A. S. G. 2010, MNRAS, 407, 2131, doi: 10.1111/j.1365-2966.2010.17028.x
2010
-
[16]
P., Andrews, S
Driver, S. P., Andrews, S. K., Davies, L. J., et al. 2016, ApJ, 827, 108, doi: 10.3847/0004-637X/827/2/108
2016 doi
-
[17]
Dwek, E., & Arendt, R. G. 1998, ApJL, 508, L9, doi: 10.1086/311714
1998 doi
-
[18]
2013, Astroparticle Physics, 43, 112, doi: 10.1016/j.astropartphys.2012.09.003 Euclid Collaboration, Mellier, Y., Abdurro’uf, et al
Dwek, E., & Krennrich, F. 2013, Astroparticle Physics, 43, 112, doi: 10.1016/j.astropartphys.2012.09.003 Euclid Collaboration, Mellier, Y., Abdurro’uf, et al. 2024, arXiv e-prints, arXiv:2405.13491, doi: 10.48550/arXiv.2405.13491
2013 doi
-
[19]
T., Honscheid, K., et al
Flaugher, B., Diehl, H. T., Honscheid, K., et al. 2015, ApJ, 150, 150, doi: 10.1088/0004-6256/150/5/150 Gr´ eaux, L., Biteau, J., & Nievas Rosillo, M. 2024, ApJL, 975, L18, doi: 10.3847/2041-8213/ad85c9
2015 doi
-
[20]
G., & Dwek, E
Hauser, M. G., & Dwek, E. 2001, ARA&A, 39, 249, doi: 10.1146/annurev.astro.39.1.249 13
2001 doi
-
[21]
G., Arendt, R
Hauser, M. G., Arendt, R. G., Kelsall, T., et al. 1998, ApJ, 508, 25, doi: 10.1086/306379 Ivezi´ c,ˇZ., Kahn, S. M., Tyson, J. A., et al. 2019, ApJ, 873, 111, doi: 10.3847/1538-4357/ab042c
1998 doi
-
[22]
M., et al
Jennewein, D. M., et al. 2023, in The Sol Supercomputer at Arizona State University, PEARC ’23 (Association for Computing Machinery), 296–301, doi: 10.1145/3569951.3597573
2023
-
[23]
P., Bellstedt, S., et al
Koushan, S., Driver, S. P., Bellstedt, S., et al. 2021, MNRAS, 503, 2033, doi: 10.1093/mnras/stab540
2021 doi
-
[24]
M., Carleton, T., Cohen, S
Kramer, D. M., Carleton, T., Cohen, S. H., et al. 2022, ApJ, 940, L15, doi: 10.3847/2041-8213/ac9cca
2022 doi
-
[25]
R., Postman, M., & Weaver, H
Lauer, T. R., Postman, M., & Weaver, H. A. 2021, ApJ, 906, 77, doi: 10.3847/1538-4357/abc881
2021 doi
-
[26]
2011, ApJ, 736, 119, doi: 10.1088/0004-637X/736/2/119
Matsuoka, Y., Ienaka, N., Kawara, K., & Oyabu, S. 2011, ApJ, 736, 119, doi: 10.1088/0004-637X/736/2/119
2011 doi
-
[27]
Matsuura, S., Arai, T., & Bock, J. J. 2017, ApJ, 839, 7, doi: 10.3847/1538-4357/aa6843
2017 doi
-
[28]
2017, MNRAS, 470, 2133, doi: 10.1093/mnras/stx1295
Mattila, K., Lehtinen, K., V¨ ais¨ anen, P., von Appen-Schnur, G., & Leinert, C. 2017, MNRAS, 470, 2133, doi: 10.1093/mnras/stx1295
2017 doi
-
[29]
2021, ApJ, 913, 88, doi: 10.3847/1538-4357/abf2b4
Meinke, J., B¨ ockmann, K., Cohen, S., et al. 2021, ApJ, 913, 88, doi: 10.3847/1538-4357/abf2b4
2021 doi
-
[30]
2023, ApJ, 954, 119, doi: 10.3847/1538-4357/acdcf4
Meinke, J., Cohen, S., Moore, J., et al. 2023, ApJ, 954, 119, doi: 10.3847/1538-4357/acdcf4
2023 doi
-
[31]
A., Menanteau, F., et al
Morganson, E., Gruendl, R. A., Menanteau, F., et al. 2018, PASP, 130, 074501, doi: 10.1088/1538-3873/aab4ef O’Brien, R., Carleton, T., Windhorst, R. A., et al. 2023, AJ, 165, 237, doi: 10.3847/1538-3881/acccee Planck Collaboration, Aghanim, N., Akrami, Y., et al. 2020, A&A, 64...
2018 doi
-
[32]
R., Parker, J
Postman, M., Lauer, T. R., Parker, J. W., et al. 2024, ApJ, 972, 95, doi: 10.3847/1538-4357/ad5ffc
2024 doi
-
[33]
G., et al
Saldana-Lopez, A., Dom ´ ınguez, A., P´ erez-Gonz´ alez, P. G., et al. 2021, MNRAS, 507, 5144, doi: 10.1093/mnras/stab2393
2021 doi
-
[34]
J., Finkbeiner, D
Schlegel, D. J., Finkbeiner, D. P., & Davis, M. 1998, ApJ, 500, 525, doi: 10.1086/305772
1998 doi
-
[35]
Symons, T., Zemcov, M., Cooray, A., Lisse, C., & Poppe, A. R. 2023, ApJ, 945, 45, doi: 10.3847/1538-4357/acaa37
2023 doi
-
[36]
L., Eisenhardt, P
Wright, E. L., Eisenhardt, P. R. M., Mainzer, A. K., et al. 2010, AJ, 140, 1868, doi: 10.1088/0004-6256/140/6/1868
2010 doi
-
[37]
G., Adelman, J., Anderson, John E., J., et al
York, D. G., Adelman, J., Anderson, John E., J., et al. 2000, AJ, 120, 1579, doi: 10.1086/301513
2000 doi
-
[38]
2017, Nat
Zemcov, M., Immel, P., & Nguyen, C. 2017, Nat. Comm., 8, doi: 10.1038/ncomms15003
2017 doi
Reviewed August 7, 2026 · model on record in the stance chip above.
Discussion (0). Sign in to comment.