REVIEW 4 major objections 5 minor 60 references
A cosmology weakly dependent measurement of 2D Baryon Acoustic Oscillations scale from the Southern Photometric Local Universe Survey
T0 review · 4 major / 5 minor · reviewed 2026-08-07 · deepseek-v4-flash
Pith's one-line read The paper claims a 3.22-sigma detection of the transversal baryon acoustic oscillation scale at $\theta_{\mathrm{BAO}} = 21.81^\circ \pm 0.85^\circ$ and $z_{\rm eff}=0.075$ using S-PLUS blue galaxies, which translates to $D_A = 242.13 \pm…
desk verdict A genuinely new low-redshift angular BAO point, but the 23% projection correction is unvalidated in mocks and Eq. (9) looks internally inconsistent; solid after major revision, not as is. read the letter →
The pith
A machine-rendered reading of the paper's core claim, the machinery that carries it, and where it could break.
The reading
What carries the argument
The load-bearing object is the two-point angular correlation function, computed with the Landy-Szalay estimator from 1,000 resampled data catalogues; each resampling draws new redshifts from each galaxy's photometric-redshift probability distribution, so photometric errors are propagated into the clustering signal. The BAO bump is fitted with a parametric model, a power law plus a Gaussian, whose centroid $\theta_{\mathrm{FIT}}$ is converted to the cosmological scale by the projection-effect shift $\Delta\theta = 0.23$, a correction computed from a fiducial cosmology for a redshift shell of width $\Delta z = 0.07$. Uncertainties come from the covariance matrix of 1,000 log-normal mock catalogues. This chain — sampling, angular correlation, parametric fit, projection shift — is what carries the final measurement.
What would settle it
Recomputing the angular correlation function for the same galaxies with spectroscopic redshifts would settle the claim: a BAO peak at the raw 17.73 degrees rather than the corrected 21.81 degrees, or a projection shift that varies by more than 0.85 degrees across plausible cosmologies, would falsify the measurement.
Extended reading notes
Core claim
On the paper's own terms, the discovery is the appearance of a BAO bump in the angular correlation function of S-PLUS blue galaxies in the redshift shell $0.03 \le z \le 0.1$. The fitted centroid is $\theta_{\mathrm{FIT}} = 17.73^\circ \pm 0.69^\circ$, and after applying a 23\% projection-effect shift ($\Delta\theta = 0.23$) the authors obtain the transversal BAO scale $\theta_{\mathrm{BAO}} = 21.81^\circ \pm 0.85^\circ$ at $z_{\rm eff}=0.075$. They compute the statistical significance as $3.22\sigma$ using a $\chi^2$ dilation test, and they report consistency checks with 1,000 log-normal mocks and with randomized angular positions. Assuming the Planck sound horizon $r_s = 99.08 \pm 0.18\,\mathrm{Mpc}/h$, this corresponds to $D_A = 242.13 \pm 9.45\,\mathrm{Mpc}/h$, which the paper presents as the first robust detection of the transversal BAO scale at the lowest redshift, using narrow-plus-wide photometry.
Load-bearing premise
The load-bearing premise is that the fitted 17.73-degree peak is the BAO bump and that the 23% projection correction computed from the fiducial cosmology shifts it to exactly 21.81 degrees, with no uncertainty attached to that correction.
Editorial extensions
If this is right
- The measured $D_A(z=0.075)$ adds a low-redshift anchor to the BAO distance-redshift relation, where spectroscopic BAO constraints are sparse.
- The PDF-resampling technique shows that photometric surveys with narrow-band filters can extract BAO information at low redshift without spectroscopy.
- If the detection holds at higher significance, it provides a geometric check on the local distance ladder and on late-time dark energy models.
- The same pipeline can be applied to future S-PLUS data releases or other multi-band surveys to test whether the signal persists with more sky coverage.
Reading between the lines
- The 23% projection correction is the main model-dependent step; propagating the full 0.228–0.235 range through the distance estimate would likely increase the error budget beyond the quoted 9.45 Mpc/h.
- If confirmed by an independent low-redshift tracer, such as emission-line galaxies or galaxy groups, the result would strengthen the case that photometric BAO can serve as a cosmological probe at $z < 0.1$.
- A direct comparison with a spectroscopic sample in the same footprint would calibrate the projection shift empirically and remove the largest systematic; this is a testable next step.
- The modest 3.22-sigma significance means the claimed first detection invites confirmation; combining S-PLUS with other southern photometric surveys could push the detection past 5 sigma.
Editorial analysis
A structured set of objections, weighed in public.
Referee Report
Summary. This paper reports a measurement of the transverse Baryon Acoustic Oscillation angular scale using 5,977 blue galaxies from the S-PLUS iDR5 survey in the redshift range 0.03 ≤ z ≤ 0.1. The authors generate 1,000 resampled photometric-redshift catalogues from per-galaxy PDFs, compute the angular two-point correlation function with the Landy-Szalay estimator, and build a covariance matrix from 1,000 log-normal mocks. Fitting the parametric model of Eq. (8) to the mean 2PACF yields θ_FIT = 17.73° ± 0.69°; after applying a projection-effect shift Δθ = 0.23 the authors obtain θ_BAO = 21.81° ± 0.85° at z_eff = 0.075 with a claimed 3.22σ significance, and convert this to D_A = 242.13 ± 9.45 Mpc/h assuming a Planck sound horizon.
Significance. If correct, this is a genuinely novel measurement: a low-redshift (z ≈ 0.075), photometric-only, transversally oriented BAO detection, and the paper's treatment of photo-z uncertainties through PDF resampling and its mock-based covariance pipeline are useful methodological elements. The random-position robustness test in Appendix A is a valuable internal check. However, the central value and significance are strongly affected by three issues—the algebraic definition of the projection shift, the missing mock-based validation of the fitted bump, and the mismatch between mock and data number densities—so the detection claim is not yet established.
major comments (4)
- [Section III E2, Eq. (9)] Equation (9) defines Δθ = (θ_E^0 − θ_E^δ)/θ_E^0 and then uses θ_BAO = (1+Δθ) θ_FIT. With that definition, the correct recovery from the measured (projected) scale is θ_BAO = θ_FIT/(1−Δθ). Using Δθ = 0.23, the printed formula gives 17.73° × 1.23 = 21.81°, while the inversion of the printed definition gives 17.73°/0.77 ≈ 23.0°, a difference larger than the quoted 0.85° uncertainty. Please state which convention was actually used and recompute the central value and D_A accordingly.
- [Section III C and Table I] The covariance matrix and the significance are computed from 1,000 log-normal mocks generated with N_g/m = 6,000,000 galaxies, whereas the analyzed data sample contains only 5,977 galaxies. If these mocks are not thinned to the data's number density and selection function, their shot-noise contribution to the 2PACF is far smaller than that of the data, so the covariance and the resulting θ_FIT error and 3.22σ significance are likely underestimated. The mocks should be resampled to match the data, or the effect of the density mismatch should be explicitly quantified.
- [Section IV and Section III E2] The paper never reports the expected θ_FIT from the 1,000 mocks that are generated with the same survey settings and cosmology. The bottom panel of Fig. 6 shows the mock 2PACFs, but the mean best-fit θ_FIT from these mocks (or the model quantity θ_E^δ) is not given. Without a quantitative comparison of the mock-inferred bump position with the data's 17.73°, the application of the 23% shift cannot be validated; it could promote any local excess in the data to the claimed BAO scale. Please provide the mean and scatter of the mocks' fitted θ_FIT and compare them with the data fit.
- [Section IV, Eq. (13)] The quoted uncertainty on θ_BAO (0.85°) is just the θ_FIT error scaled by 1.23; no systematic uncertainty is assigned to Δθ itself, despite the paper reporting a spread of 0.228–0.235 across DESI cosmologies. This range translates into an additional systematic of roughly 0.1–0.2° on θ_BAO, which should be included in the error budget. In addition, the photo-z sampling method of Section IIID is not explicitly incorporated into the final uncertainty beyond the visual scatter in Fig. 6.
minor comments (5)
- [Abstract and Section V] The wording "first robust detection of the transversal BAO scale at the lowest-redshift in the Universe" is strong; given the large model-dependent projection correction, this claim should be softened or explicitly justified with supporting evidence.
- [Section IV, Fig. 7] The best-fit parameters for Eq. (8) are only displayed in the frame of Fig. 7; they should be listed in the text or in a table to allow reproduction.
- [Section II A and reference [13]] The text refers to "De Bom et al. 2024" but the reference list gives "Bom C, Cortesi A, Ribeiro U, et al"; this should be harmonized.
- [Section IV, Fig. 8] The description of the significance test is one sentence and lacks the Δχ² definition and the choice of scale-dilation range; please add the necessary details or a reference to an explicit equation.
- [Section II C, Table I] Table I lists N_g/m = 6,000,000 while the data set contains 5,977 galaxies; if this is not a typo, the text should explain why the mocks use a much higher number density than the observed sample.
Circularity Check
No significant circularity: the angular BAO scale is measured from S-PLUS data and the projection shift is computed from external fiducial cosmologies rather than fitted to the target result.
full rationale
The derivation chain is not circular. The fitted peak theta_FIT=17.73 deg comes from applying Eq. (8) to the mean 2PACF of the 1000 photo-z-sampled S-PLUS catalogs; the covariance is obtained from log-normal mocks, but the central value is not regressed onto the mock input. The projection shift Delta_theta=0.23 is computed from the theoretical 2PCF and angular correlation (Eqs. 1-5 via CCL) using a fiducial cosmology and checked against two DESI cosmologies (0.228, 0.235); it is not fitted to S-PLUS data, so the final theta_BAO=21.81 deg is not forced to equal an input scale by construction. The angular-diameter distance uses the Planck sound horizon as an external standard ruler. The 3.22 sigma significance is a Delta-chi^2 comparison of the Gaussian-plus-power-law model to the power-law-only model, not a restatement of the fitted peak. Self-citations (e.g., de Carvalho et al. 2018, 2020, 2021; Avila et al. 2024) are methodological precedents and earlier measurements; none is invoked as a uniqueness theorem or as the sole evidence for the detection, and the projection correction is recomputed here rather than imported. The main legitimate concerns are validation and calibration, not circularity: the paper does not report the mean fitted peak from its own 1000 mocks, which would directly test whether 17.73 deg is the projected BAO bump, and Eq. (9) defines Delta_theta=(theta_E^0-delta_E^delta)/theta_E^0 while using theta_BAO=(1+Delta_theta)theta_FIT, which is algebraically inconsistent with the stated definition. These issues affect robustness and correctness but do not make the measurement self-referential.
Assumptions & free parameters
free parameters (4)
- theta_FIT (Gaussian peak position in model fit) =
17.73 +/- 0.69 deg
- Gaussian amplitude C and width sigma_FIT =
Not reported in text; shown in Fig. 7
- Power-law background parameters A, B, gamma =
Not reported in text
- Redshift bin limits =
0.03 to 0.1
assumptions (5)
- domain assumption Fiducial Planck-like cosmology used to compute the projection shift and generate mocks.
- domain assumption Log-normal mocks accurately represent the covariance of the S-PLUS blue galaxy sample.
- standard math The parametric model of Eq. (8) describes the angular correlation function.
- domain assumption S-PLUS photometric redshift PDFs are correct.
- domain assumption The projection effect shift is cosmology-independent at the level claimed.
Cite this review
Pith. "Pith review of A cosmology weakly dependent measurement of 2D Baryon Acoustic Oscillations scale from the Southern Photometric Local Universe Survey." pith.science (2026). https://pith.science/paper/HLBIAEHX
@misc{pith2026250608288,
  author       = {Pith},
  title        = {Pith review of: A cosmology weakly dependent measurement of 2D Baryon Acoustic Oscillations scale from the Southern Photometric Local Universe Survey},
  year         = {2026},
  howpublished = {\url{https://pith.science/paper/HLBIAEHX}},
  note         = {Machine review of arXiv:2506.08288}
}
abstract
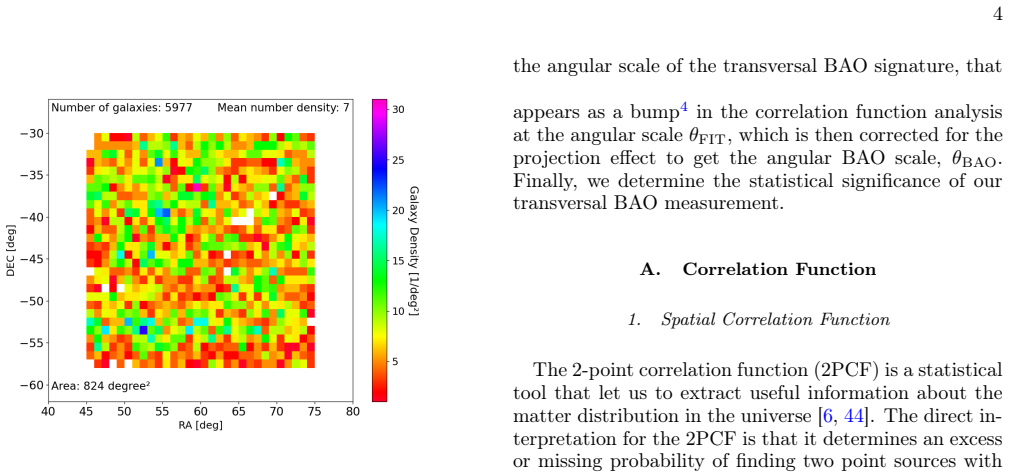
Baryon Acoustic Oscillations (BAO) provide a robust standard ruler for observational cosmology, enabling precise constraints on the expansion history of the Universe. We present a weakly model-dependent measurement of the BAO angular scale in the low-redshift Universe using the blue galaxies from the Southern Photometric Local Universe Survey (S-PLUS). Our analysis is based on the 2-point angular correlation function applied to a selected photometric sample of $5977$ galaxies with redshifts $0.03 \leq z \leq 0.1$. To account for photometric redshift uncertainties, we implement a resampling technique using the probability distribution function of each galaxy. Angular correlations are computed using the Landy-Szalay estimator; the uncertainties are quantified using a set of $1000$ log-normal mock catalogues. Our 2-point angular correlation analyses reveal a prominent BAO signal that after a shift correction, due to the projection effect caused by the finite thickness of the redshift bin, provides the transversal BAO measurement: $\theta_{BAO} = 21.81^{\circ} \pm 0.85^{\circ}$, at $z_{eff} = 0.075$, detected with a statistical significance of $3.22 \sigma$. In addition, we performed consistency tests that support the robustness of our result. Our measurement constitutes the first robust detection of the transversal BAO scale: at the lowest-redshift in the Universe and using multi-band (narrow+wide) photometry data from the S-PLUS.
Figures


Figures from the paper (7 more)


Reference graph
Works this paper leans on
-
[1]
Spatial Correlation Function The 2-point correlation function (2PCF) is a statistical tool that let us to extract useful information about the matter distribution in the universe [6, 44]. The direct in- terpretation for the 2PCF is that it determines an excess or missing probability of finding two point sources with a distancerand can be derived from the ...
-
[2]
Angular correlation Function The 2-point angular correlation function (2PACF), ω(θ), study the angular separation between pairs of cos- mic objects in a given redshift bin. It can be derived in a similar approach as the one used in the spatial correla- tion function, but with the data projected in the celestial sphere. Therefore, we use the angular power ...
-
[3]
Parametric Model To calculate the transversal BAO scale we used a para- metricmodelproposedbySánchezetal[51](seealso[25]) that assumes a power law to describe the general shape of the correlation function plus a Gaussian function to fit the BAO bump ω(θ) =A+Bθ γ +Ce −(θ−θFIT)2/2σ2 FIT ,(8) whereA,B,γ,C,θ FIT, andσ FIT are free parameters. The first three ...
-
[4]
Projection Effect TheBAOangularscalemeasurementwouldbedirectly obtained from the 2PACF for data in case of an infinitesi- mal thin redshift bin,∆z→0, because in such a case the projection effect would be negligible. However, this is not possible because we need a redshift bin large enough to have a significant amount of galaxies for analyses there. Distan...
work page 2021
-
[5]
Abbott TMC, Aguena M, Allam S, et al (2022) Dark Energy Survey Year 3 results: A 2.7% mea- surement of baryon acoustic oscillation distance scale at redshift 0.835. Phys. Rev. D105(4):043512. doi:10.1103/PhysRevD.105.043512, https://arxiv.org/abs/arXiv:2107.04646 [astro-ph.CO]
arXiv 2022
-
[6]
Abdul-Karim M, Aguilar J, Ahlen S, et al (2025) Desi dr2 results ii: Measurements of baryon acous- tic oscillations and cosmological constraints. arXiv e-prints URLhttps://arxiv.org/abs/2503.14738, https://arxiv.org/abs/arXiv:2503.14738 [astro-ph.CO]
arXiv 2025
-
[7]
Agrawal A, Makiya R, Chiang CT, et al (2017) Generating log-normal mock catalog of galax- ies in redshift space. J. Cosmology Astropart. Phys.2017(10):003. doi:10.1088/1475-7516/2017/10/003, https://arxiv.org/abs/arXiv:1706.09195 [astro-ph.CO]
arXiv 2017
-
[8]
Astronomy & Astrophysics 623:A76
Ansari R, Choyer A, Habibi F, et al (2019) Impact of photometric redshifts on the galaxy power spectrum and 11 bao scale in the lsst survey. Astronomy & Astrophysics 623:A76
work page 2019
Show all 60 references
-
[9]
MNRAS488(1):1481–1487
Avila F, Novaes CP, Bernui A, et al (2019) The angular scale of homogeneity in the lo- cal Universe with the SDSS blue galaxies. MNRAS488(1):1481–1487. doi:10.1093/mnras/stz1765, https://arxiv.org/abs/arXiv:1906.10744 [astro-ph.CO]
2019 arXiv
-
[10]
MNRAS509(2):2994–3003
Avila F, Bernui A, Nunes RC, et al (2022) The homo- geneity scale and the growth rate of cosmic structures. MNRAS509(2):2994–3003. doi:10.1093/mnras/stab3122, https://arxiv.org/abs/arXiv:2111.08541 [astro-ph.CO]
2022 arXiv
-
[11]
MNRAS529(4):4980–4992
Avila F, de Carvalho E, Bernui A, et al (2024) Baryon acoustic scale at z ef f = 0.166 with the SDSS blue galaxies. MNRAS529(4):4980–4992. doi:10.1093/mnras/stae867, https://arxiv.org/abs/arXiv:2404.00747 [astro-ph.CO]
2024 arXiv
-
[12]
MNRAS393(4):1324–
Bamford SP, Nichol RC, Baldry IK, et al (2009) Galaxy Zoo: the dependence of morphology and colour on environment*. MNRAS393(4):1324–
2009
-
[13]
Bom C, Cortesi A, Ribeiro U, et al (2024) An extended catalogue of galaxy morphology using deep learning in southern photometric local universe survey data release
2024
-
[14]
In: Ruiz-Lapuente P (ed) Dark Energy: Observational andTheoreticalApproaches.CambridgeUniversityPress Cambridge, p 246, doi:10.48550/arXiv.0910.5224
Bassett B, Hlozek R (2010) Baryon acoustic oscillations. In: Ruiz-Lapuente P (ed) Dark Energy: Observational andTheoreticalApproaches.CambridgeUniversityPress Cambridge, p 246, doi:10.48550/arXiv.0910.5224
-
[15]
MNRAS416(4):3017–
Beutler F, Blake C, Colless M, et al (2011) The 6dF Galaxy Survey: baryon acoustic oscillations and the local Hubble constant. MNRAS416(4):3017–
2011
-
[16]
Physical Review D 93(2):023,530
Carvalho G, Bernui A, Benetti M, et al (2016) Baryon acoustic oscillations from the sdss dr10 galaxies angular correlation function. Physical Review D 93(2):023,530
2016
-
[17]
MNRAS418(3):1707–
Blake C, Kazin EA, Beutler F, et al (2011) The WiggleZ Dark Energy Survey: map- ping the distance-redshift relation with baryon acoustic oscillations. MNRAS418(3):1707–
2011
-
[18]
apjs 242(1):2
Chisari NE, Alonso D, Krause E, et al (2019) Core Cosmology Library: Precision Cosmological Predictions for LSST. apjs 242(1):2. doi:10.3847/1538-4365/ab1658, https://arxiv.org/abs/arXiv:1812.05995 [astro-ph.CO]
2019 arXiv
-
[19]
MNRAS485(2):2806–2824
Blot L, Crocce M, Sefusatti E, et al (2019) Compar- ing approximate methods for mock catalogues and covariance matrices II: power spectrum multipoles. MNRAS485(2):2806–2824. doi:10.1093/mnras/stz507, https://arxiv.org/abs/arXiv:1806.09497 [astro-ph.CO]
2019 arXiv
-
[20]
MNRAS362(2):505–534
Cole S, Percival WJ, Peacock JA, et al (2005) The 2dF Galaxy Redshift Survey: power-spectrum anal- ysis of the final data set and cosmological impli- cations. MNRAS362(2):505–534. doi:10.1111/j.1365- 2966.2005.09318.x, https://arxiv.org/abs/arXiv:astro- ph/0501174 [astro-ph]
2005
-
[21]
Monthly Notices of the Royal Astronomical Society 528(3):4188–4208
-
[22]
Highlights of Spanish Astrophysics VI pp 161–166
Carnero-Rosell A, Sánchez E, Garcıa-Bellido J, et al (2011) Tracing the sound horizon scale with photometric redshift surveys. Highlights of Spanish Astrophysics VI pp 161–166
2011
-
[23]
MNRAS481(2):2371–2383
Carter P, Beutler F, Percival WJ, et al (2018) Low redshift baryon acoustic oscillation measurement from the reconstructed 6-degree field galaxy survey. MNRAS481(2):2371–2383. doi:10.1093/mnras/sty2405, https://arxiv.org/abs/arXiv:1803.01746 [astro-ph.CO]
2018 arXiv
-
[24]
de Carvalho E, Bernui A, Carvalho GC, et al (2018) Angular Baryon Acoustic Oscillation measure at z=2.225 from the SDSS quasar survey. J. Cosmology Astropart. Phys.04(4):064. doi:10.1088/1475-7516/2018/04/064, https://arxiv.org/abs/arXiv:1709.00113 [astro-ph.CO]
2018 arXiv
-
[25]
Monthly Notices of the Royal Astronomical Society 477(3):3892–3909
Chaves-Montero J, Angulo RE, Hernández-Monteagudo C (2018) The effect of photometric redshift uncertain- ties on galaxy clustering and baryonic acoustic oscilla- tions. Monthly Notices of the Royal Astronomical Society 477(3):3892–3909
2018
-
[26]
MNRAS492(3):4469–4476
de Carvalho E, Bernui A, Xavier HS, et al (2020) Baryon acoustic oscillations signature in the three-point angular correlation function from the SDSS-DR12 quasar survey. MNRAS492(3):4469–4476. doi:10.1093/mnras/staa119, https://arxiv.org/abs/arXiv:2002.01109 [astro-ph.CO]
2020 arXiv
-
[27]
MNRAS482(4):4883–4905
Colavincenzo M, Sefusatti E, Monaco P, et al (2019) Comparing approximate methods for mock cat- alogues and covariance matrices - III: bispectrum. MNRAS482(4):4883–4905. doi:10.1093/mnras/sty2964, https://arxiv.org/abs/arXiv:1806.09499 [astro-ph.CO]
2019 arXiv
-
[28]
arXiv e-prints arXiv:2504.01669
Di Valentino E, Levi Said J, Riess A, et al (2025) The CosmoVerse White Paper: Addressing ob- servational tensions in cosmology with system- atics and fundamental physics. arXiv e-prints arXiv:2504.01669. doi:10.48550/arXiv.2504.01669, https://arxiv.org/abs/arXiv:2504.01669 [a...
-
[29]
MNRAS248:1–13
Coles P, Jones B (1991) A lognormal model for the cosmological mass distribution. MNRAS248:1–13. doi: 10.1093/mnras/248.1.1
1991 doi
-
[30]
Monthly Notices of the Royal Astronomical Society 482(2):2807–2822
Crocce M, Ross A, Sevilla-Noarbe I, et al (2019) Dark energy survey year 1 results: galaxy sample for bao mea- surement. Monthly Notices of the Royal Astronomical Society 482(2):2807–2822
2019
-
[32]
ApJ426:23
Feldman HA, Kaiser N, Peacock JA (1994) Power- Spectrum Analysis of Three-dimensional Red- shift Surveys. ApJ426:23. doi:10.1086/174036, https://arxiv.org/abs/arXiv:astro-ph/9304022 [astro- ph]
1994 arXiv
-
[33]
In: Journal of Physics Conference Series, Journal of Physics Conference Series, vol 1558
de Carvalho E, Bernui A, Carvalho JC (2020) The pro- jection effect on the measurement of the angular BAO scale. In: Journal of Physics Conference Series, Journal of Physics Conference Series, vol 1558. IOP, p 012004, doi:10.1088/1742-6596/1558/1/012004
2020 doi
-
[34]
MNRAS527(3):7400–7413
Franco C, Avila F, Bernui A (2024) Prob- ing cosmic isotropy in the Local Universe. MNRAS527(3):7400–7413. doi:10.1093/mnras/stad3616, https://arxiv.org/abs/arXiv:2312.03152 [astro-ph.CO]
2024 arXiv
-
[35]
A&A649:A20
de Carvalho E, Bernui A, Avila F, et al (2021) BAO angular scale at zef f= 0.11 with the SDSS blue galax- ies. A&A649:A20. doi:10.1051/0004-6361/202039936, https://arxiv.org/abs/arXiv:2103.14121 [astro-ph.CO]
2021 arXiv
-
[36]
MNRAS376(4):1425–1444
Gerke BF, Newman JA, Faber SM, et al (2007) The DEEP2 galaxy redshift survey: the evo- lution of the blue fraction in groups and the field. MNRAS376(4):1425–1444. doi:10.1111/j.1365- 2966.2007.11374.x, https://arxiv.org/abs/arXiv:astro- ph/0608569 [astro-ph]
2007
-
[37]
MNRAS526(3):3219–3229
Dias BL, Avila F, Bernui A (2023) Prob- ing cosmic homogeneity in the Local Universe. MNRAS526(3):3219–3229. doi:10.1093/mnras/stad2980, https://arxiv.org/abs/arXiv:2310.04594 [astro-ph.CO]
2023 arXiv
-
[38]
Dressler A, Oemler AJr., Couch WJ, et al (1997) Evolu- tion since Z = 0.5 of the Morphology-Density Relation for ClustersofGalaxies.ApJ490:577–+.doi:10.1086/304890, https://arxiv.org/abs/arXiv:astro-ph/9707232
1997 arXiv
-
[39]
ApJ633(2):560–574
Eisenstein DJ, Zehavi I, Hogg DW, et al (2005) Detection of the Baryon Acoustic Peak in the Large- Scale Correlation Function of SDSS Luminous Red Galaxies. ApJ633(2):560–574. doi:10.1086/466512, 12 https://arxiv.org/abs/arXiv:astro-ph/0501171 [astro- ph]
2005 arXiv
-
[40]
Astrophysical Journal, Part 1 (ISSN 0004-637X), vol 412, no 1, p 64-71 412:64–71
Landy SD, Szalay AS (1993) Bias and variance of angu- lar correlation functions. Astrophysical Journal, Part 1 (ISSN 0004-637X), vol 412, no 1, p 64-71 412:64–71
1993
-
[41]
arXiv preprint arXiv:250104960
Ferreira PS, Reis RR (2025) Influence of photometric galaxies redshift distribution in bao estimation. arXiv preprint arXiv:250104960
2025
-
[42]
Lintott CJ, Schawinski K, Slosar A, et al (2008) Galaxy Zoo: morphologies derived from visual inspection of galaxies from the Sloan Digital Sky Survey*. Monthly Notices of the Royal Astronomical Society 389(3):1179– 1189.doi:10.1111/j.1365-2966.2008.13689.x, URLhttps: //doi.or...
2008
-
[43]
arXiv e- prints arXiv:2502.02574
Franco C, Avila F, Bernui A (2025) Probing large-scale structures with the 2-point function and the power spec- trum: insights into cosmic clustering evolution. arXiv e- prints arXiv:2502.02574. doi:10.48550/arXiv.2502.02574, https://arxiv.org/abs/arXiv:2502.02574 [astro-ph.CO]
2025 doi
-
[44]
Marques GA, Bernui A (2020) Tomographic analyses of the CMB lensing and galaxy clustering to probe the linear structure growth. J. Cosmology Astropart. Phys.05(5):052. doi:10.1088/1475-7516/2020/05/052, https://arxiv.org/abs/arXiv:1908.04854 [astro-ph.CO]
2020 arXiv
-
[45]
Monthly Notices of the Royal Astronomical Society 526(4):5374–5385
Ishikawa K, Sunayama T, Nishizawa AJ, et al (2023) Robustness of baryon acoustic oscillations measurements with photometric redshift uncertainties. Monthly Notices of the Royal Astronomical Society 526(4):5374–5385
2023
-
[46]
Monthly Notices of the Royal Astronomical Society 352(1):338–352
Jarvis M, Bernstein G, Jain B (2004) The skewness of the aperture mass statistic. Monthly Notices of the Royal Astronomical Society 352(1):338–352
2004
-
[47]
A&A631:A73
Keihänen E, Kurki-Suonio H, Lindholm V, et al (2019) Estimating the galaxy two-point corre- lation function using a split random catalog. A&A631:A73. doi:10.1051/0004-6361/201935828, https://arxiv.org/abs/arXiv:1905.01133 [astro-ph.CO]
2019 arXiv
-
[48]
ApJ162:815
Peebles PJE, Yu JT (1970) Primeval Adiabatic Per- turbation in an Expanding Universe. ApJ162:815. doi: 10.1086/150713
1970 doi
-
[49]
Lima EVR, Sodré Jr L, Bom C, et al (2022) Photometric redshifts for the s-plus survey: Is machine learning up to the task? Astronomy and Computing 38:100,510
2022
-
[50]
MNRAS437(2):1109–1126
Ross AJ, Samushia L, Burden A, et al (2014) The cluster- ing of galaxies in the SDSS-III DR10 Baryon Oscillation Spectroscopic Survey: no detectable colour depen- dence of distance scale or growth rate measurements. MNRAS437(2):1109–1126. doi:10.1093/mnras/stt1895, https://arx...
2014 arXiv
-
[51]
Correlation function
Lippich M, Sánchez AG, Colavincenzo M, et al (2019) Comparing approximate methods for mock catalogues and covariance matrices - I. Correlation function. MNRAS482(2):1786–1806. doi:10.1093/mnras/sty2757, https://arxiv.org/abs/arXiv:1806.09477 [astro-ph.CO]
2019 arXiv
-
[52]
Ap&SS7(1):3–19
Sunyaev RA, Zeldovich YB (1970) Small-Scale Fluc- tuations of Relic Radiation. Ap&SS7(1):3–19. doi: 10.1007/BF00653471
1970 doi
-
[53]
MNRAS489(1):241–267
Mendes de Oliveira C, Ribeiro T, Schoenell W, et al (2019) The Southern Photometric Local Universe Survey (S-PLUS): improved SEDs, mor- phologies, and redshifts with 12 optical filters. MNRAS489(1):241–267. doi:10.1093/mnras/stz1985, https://arxiv.org/abs/arXiv:1907.01567 [ast...
2019 arXiv
-
[54]
An unbiased estimate of the growth rate of structure at 〈z〉= 0.85 using the clustering of luminous blue galax- ies
Mohammad FG, Granett BR, Guzzo L, et al (2018) The VIMOS Public Extragalactic Redshift Survey (VIPERS). An unbiased estimate of the growth rate of structure at 〈z〉= 0.85 using the clustering of luminous blue galax- ies. A&A610:A59. doi:10.1051/0004-6361/201731685, https://arxi...
2018 arXiv
-
[55]
Monthly No- tices of the Royal Astronomical Society 507(4):5847–5868
Nakazono L, Mendes de Oliveira C, Hirata NST, et al (2021) On the discovery of stars, quasars, and galaxies in the southern hemisphere with s-plus dr2. Monthly No- tices of the Royal Astronomical Society 507(4):5847–5868
2021
-
[57]
Planck Collaboration, Aghanim N, Akrami Y, et al (2018) Planck 2018 results. VI. Cosmological parameters. ArXiv e-prints https://arxiv.org/abs/arXiv:1807.06209
2018 arXiv
-
[59]
MNRAS411(1):277–
Sánchez E, Carnero A, García-Bellido J, et al (2011) Tracing the sound horizon scale with pho- tometric redshift surveys. MNRAS411(1):277–
2011
-
[62]
MNRAS432(3):1961–1979
Wang Y, Brunner RJ, Dolence JC (2013) The SDSS galaxy angular two-point correlation function. MNRAS432(3):1961–1979. doi:10.1093/mnras/stt450, https://arxiv.org/abs/arXiv:1303.2432 [astro-ph.CO]
2013 arXiv
-
[63]
ApJ630(1):1–27
Zehavi I, Zheng Z, Weinberg DH, et al (2005) The Luminosity and Color Dependence of the Galaxy Cor- relation Function. ApJ630(1):1–27. doi:10.1086/431891, https://arxiv.org/abs/arXiv:astro-ph/0408569 [astro- ph]
2005 arXiv
-
[288]
doi:10.1111/j.1365-2966.2010.17679.x, https://arxiv.org/abs/arXiv:1006.3226 [astro-ph.CO]
2010
-
[1724]
doi:10.1111/j.1365-2966.2011.19592.x, https://arxiv.org/abs/arXiv:1108.2635 [astro-ph.CO]
2011
Reviewed August 7, 2026 · model on record in the stance chip above.
Discussion (0). Sign in to comment.