REVIEW 2 major objections 4 minor 52 references
Deriving physical parameters of unresolved star clusters. VIII. Limits of aperture photometry for star cluster studies
T0 review · 2 major / 4 minor · reviewed 2026-08-07 · deepseek-v4-flash
Pith's one-line read To get reliable physical parameters of unresolved star clusters from integrated light, colour indices must be measured with an aperture larger than the cluster's half-light radius, and for clusters around 10 Myr old the parameters cannot…
desk verdict A solid simulation study of aperture-photometry limits; the headline R50 rule is real but the abstract overstates it—the data suggest ~2*R50 and the parameter-recovery tests don't directly test per-cluster R50. read the letter →
The pith
A machine-rendered reading of the paper's core claim, the machinery that carries it, and where it could break.
The reading
What carries the argument
The machinery is a grid of stochastically sampled 3D cluster models: stellar masses are drawn from the Kroupa initial mass function, positions follow an Elson-Fall-Freeman (EFF) density profile, a power-law profile commonly used for young clusters, and magnitudes come from the PARSEC-COLIBRI stellar-evolution isochrone set at solar metallicity and zero extinction. Each cluster is projected onto the sky from 100 directions and rendered in six passbands matching an HST survey of M 31. The measurement procedure under test is adaptive aperture photometry, in which a small colour aperture is centred on the cluster to exclude bright field or evolved stars and its colours are transferred to the total flux via an aperture correction; the key control parameter is the ratio of the colour-aperture radius to the half-light radius, $R_C/R_{50}$.
What would settle it
Re-run the parameter-recovery tests in a blind setup where the fitting grid is built from an independent stellar-evolution isochrone set and a different initial-mass-function prescription; if ~10 Myr clusters are recovered with scatter well below ~0.2 dex in log age, or if small apertures below the half-light radius no longer bias ages and masses by ~0.2 dex, the claimed limits are an artefact of using the same simulation recipe on both sides of the test.
Extended reading notes
Core claim
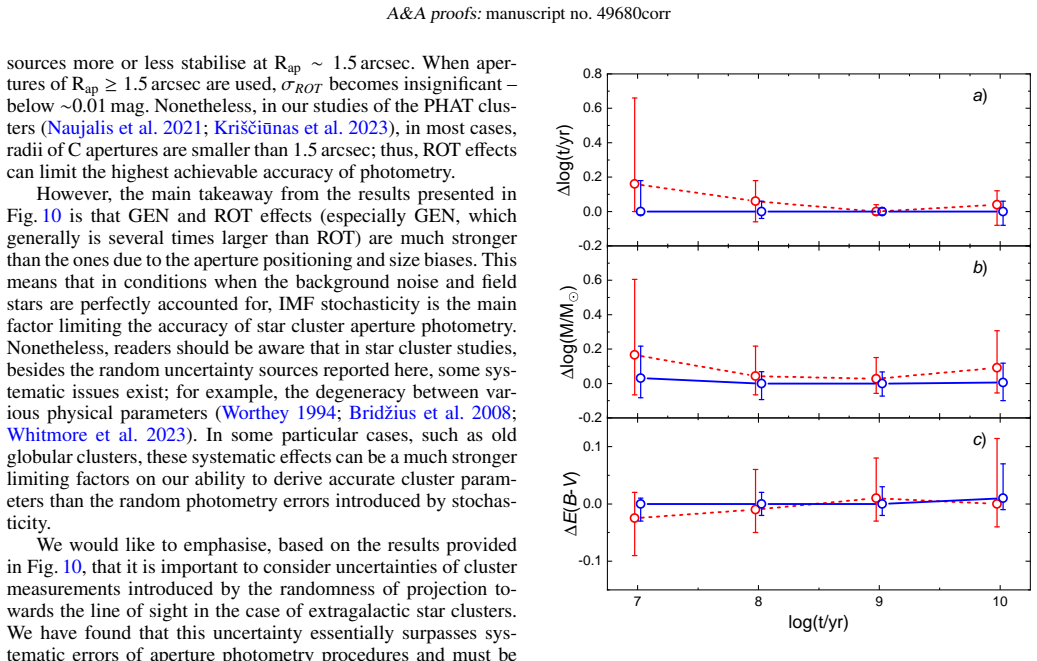
The paper's central claim is that, under idealised background-free conditions, the dominant limit on aperture-photometry parameters of unresolved star clusters is the stochastic sampling of the stellar initial mass function together with the cluster's orientation on the sky. Clusters of the same mass and age split into two photometrically distinct classes depending on whether at least one post-main-sequence star is present; the class with such stars is redder, brighter, and much more scattered in colour-colour and colour-magnitude space. Measuring colours through apertures smaller than roughly the half-light radius shifts recovered ages and masses by about +0.2 dex, so reliable parameter derivation requires colour apertures larger than the half-light radius, preferably near twice it. Even with large apertures, clusters near 10 Myr remain problematic, with age scatter around 0.2 dex and mass scatter around 0.3 dex, because the brightest stars are few and stochastically placed. The random projection direction alone contributes up to 0.1 mag of colour-index uncertainty for typical clusters at M 31 distance measured with apertures of 1.5 arcsec or smaller.
Load-bearing premise
The load-bearing premise is that the simulated clusters used both to make the images and to fit the parameters match real M 31 clusters closely enough; if real clusters differ in stellar composition, binarity, dust, or structure, the reported best-achievable limits would be too optimistic.
Editorial extensions
If this is right
- Cluster catalogues built from integrated colours should adopt colour apertures larger than the half-light radius, and ideally near twice it; small-aperture photometry should be flagged as biased.
- Ages and masses of clusters younger than roughly 30 Myr derived from aperture photometry should be cross-checked with colour-magnitude diagram fitting wherever the clusters are resolved.
- The projection-orientation term, up to 0.1 mag in colours and about 10-20% in half-light radii, belongs in the error budget of extragalactic cluster photometry.
- The adaptive aperture method passes a key test: there is no systematic colour bias between small colour apertures and large total apertures, so excluding bright field and evolved stars does not distort median colours.
- Non-stochastic simple-stellar-population models are inadequate for young low-mass clusters; stochastic population models are required to interpret their integrated light.
Reading between the lines
- Extending beyond the paper's tests, the same 100-projection simulation design could quantify how much binaries, mass segregation, or internal extinction gradients enlarge the orientation term, none of which are in the grid.
- Because the reported limits come from fitting a grid built with the same stellar-evolution and IMF prescriptions used to generate the clusters, a natural extension is to repeat the recovery tests with an independent isochrone set; the paper's limits would likely widen if the models disagree.
- The 0.1 mag orientation floor implies that single-projection simulations used to train photometric classifiers or infer star-formation histories carry an irreducible scatter that should be propagated into any machine-learning or Bayesian analysis.
- A direct observational test would be to compare clusters of similar mass and age but different apparent elongations in a resolved M 31 cluster sample: the paper predicts their colour scatter should match the orientation term.
Editorial analysis
A structured set of objections, weighed in public.
Referee Report
Summary. The paper constructs a large grid of three-dimensional stochastic star cluster models spanning the parameter space of M 31 clusters (masses log(M/M_sun)=2.0-4.0, ages log(t/yr)=7.0-10.0, EFF profiles with core radii 0.05-0.8 arcsec and gamma 2.2-7.0). Each cluster is projected from 100 viewing directions and simulated as PHAT-style HST images in six passbands, yielding 3e7 images. The authors apply aperture photometry, including the adaptive aperture procedure of Naujalis et al. (2021), measure flux growth curves and structural parameters, quantify uncertainties from aperture placement, projection, and stochastic IMF/spatial sampling, and run parameter-recovery tests against a large stochastic model grid. The main claims are that (i) there are no significant systematic colour gradients between total and colour apertures, (ii) reliable cluster parameters require colour measurements in apertures larger than the half-light radius, (iii) parameter determination is problematic for ~10 Myr clusters regardless of aperture, (iv) projection randomness can contribute up to ~0.1 mag of colour uncertainty, and (v) these are best-case limits because the simulations contain no sky background, field stars, or differential extinction.
Significance. The simulation campaign is large and carefully described, and separating the projection effect (ROT) from stochastic IMF/sampling effects (GEN) is a useful contribution to the aperture-photometry error budget. The authors are commendably explicit that their numbers are idealised limits obtained without sky background. However, the parameter-recovery accuracy estimates are self-consistency tests: the test clusters and the fitting grid are produced by the same code and the same physical assumptions. The headline aperture-size recommendation is also not directly tested by the fixed-aperture recovery experiment. If these two gaps are addressed, either by rephrasing the claims or by adding targeted tests, the paper will be a valuable reference for studies of unresolved clusters in the local Universe.
major comments (2)
- [Sec. 4.3 and Sec. 5] The parameter-recovery limits in Fig. 11 are computed by fitting simulated clusters against a model grid generated with the same stochastic simulation code and the same assumptions (Kroupa IMF, PARSEC-COLIBRI isochrones, EFF profiles, solar metallicity, zero background). The reported 'best achievable limits' are therefore self-consistency estimates of the forward model, not bounds on what aperture photometry can achieve for real clusters: any mismatch between the adopted model ingredients and a real cluster population is a systematic error that is absent by construction. The paper explicitly acknowledges the absence of sky background, but it does not acknowledge this grid-circularity. I recommend either calling these 'limits under the assumed model' or adding a validation test in which the recovery grid uses different stellar-population assumptions (e.g., a different IMF or a different isochrone set) to gauge the model-mismatch term.
- [Sec. 4.3, Fig. 11, and Sec. 4.1] The headline recommendation that colour indices must be measured with an aperture radius larger than the cluster's half-light radius is not directly tested by the parameter-recovery experiment. That experiment uses fixed apertures of 0.5, 1.0, 2.0, and 7.0 arcsec on clusters with core radii of 0.1 or 0.4 arcsec and gamma of 2.2, 2.8, or 7.0, and then merges the 1.0, 2.0, and 7.0 arcsec results after finding no dependence on rc and gamma. For the most extended models (e.g., rc=0.4 arcsec, gamma=2.2), the half-light radius is likely comparable to or larger than 1.0 arcsec, so the merged 'reliable' dataset includes apertures smaller than R50. The cleaner evidence in Figs. 8-9 is that the scatter in Delta(CI)_TC drops sharply near ~2*R50, not at R50, and the text itself recommends 'preferably ~2*R50'. The abstract and Section 5 should either implement a per-cluster scaling test (e.g., comparing recovery at Rap=R50, 1.5*R50, and 2*R50) or soften the rule to 'preferably at least about 2*R50' and state that the fixed-aperture recovery test only brackets this criterion.
minor comments (4)
- [Abstract and Sec. 4.1] The abstract says the aperture must be 'larger than the cluster's half-light radius', while Section 4.1 says 'larger than R50, preferably ~2*R50'; these formulations should be harmonised.
- [Sec. 4.3, Fig. 11] The merging of the Rap=1.0, 2.0, and 7.0 arcsec data is justified by the absence of a dependence on rc and gamma, but the test grid includes only two core radii and three gamma values; reporting the R50 range of the 1920 test clusters would help the reader judge how far the fixed apertures are from the recommended R50 scaling.
- [Sec. 2, Eqs. (3)-(4)] The notation F^{-1}(Xi(m)=rnd_m) is nonstandard; it would be clearer to write m_j = Xi^{-1}(rnd_m) and to define Xi explicitly as the cumulative distribution function used for inversion.
- [Sec. 4.2 and Abstract] The statement that projection effects cause colour uncertainties 'up to 0.1 mag' should specify that this is an upper envelope seen for the most adverse low-mass/young-age combinations in Fig. 10, not a representative value for typical clusters.
Circularity Check
No significant circularity: the aperture-photometry limits are emergent Monte Carlo statistics, and the self-citations that introduce the method are independently tested rather than load-bearing.
full rationale
The paper's central claims are derived from a Monte Carlo simulation pipeline: 3D cluster realizations are generated from stated physical assumptions (Kroupa IMF, PARSEC-COLIBRI isochrones, EFF profiles), projected from 100 directions, rendered into PHAT-like images, and measured with aperture photometry. The resulting photometric scatter and parameter-recovery accuracies are emergent statistics, not fitted parameters renamed as predictions. The parameter-determination test in Sect. 4.3 feeds simulated clusters into a stochastic model grid, but the test clusters and the grid nodes are independent stochastic realizations (20 test clusters versus 10,000 grid models per node), so the recovery test can fail; it does fail for Rap = 0.5 arcsec and for 10 Myr clusters. The headline recommendation that CI apertures should exceed the half-light radius is not an input of the simulations; it is inferred from comparing fixed-aperture recovery and from the aperture-radius dependence of Delta(CI)_TC scatter. The self-citations to Naujalis et al. (2021), Kriskciunas et al. (2023), and de Meulenaer et al. (2013, 2017) provide the adaptive-aperture recipe and fitting algorithm being tested, but the present work independently tests those tools under controlled simulations, so the citations are not load-bearing. The explicit caveat that all images are background-free is a stated limitation, not circularity; it makes the reported limits optimistic but does not reduce the results to their inputs. The skeptical concern that the R50 rule is inferred from fixed apertures rather than per-cluster R50 scaling is a precision/validity issue, not a circularity, and does not warrant a higher score under the rules requiring a specific reduction. Overall, no step in the derivation chain is equivalent to its inputs by construction.
Assumptions & free parameters
assumptions (6)
- domain assumption Kroupa (2001) IMF and fully stochastic sampling describe star formation outcomes.
- domain assumption EFF (Elson, Fall & Freeman 1987) profile describes young cluster radial structure; grid of rc and gamma spans real M31 clusters.
- domain assumption PARSEC-COLIBRI isochrones at fixed solar metallicity and zero interstellar extinction represent cluster stellar populations.
- ad hoc to paper Simulated images contain no sky background, no field stars, and no differential extinction.
- domain assumption Aperture correction derived in F475W can be applied to all passbands (no colour gradients beyond the C aperture).
- ad hoc to paper The fitting grid used for parameter recovery is generated with the same simulation code and assumptions as the mock data, so the true model is in the grid.
Cite this review
Pith. "Pith review of Deriving physical parameters of unresolved star clusters. VIII. Limits of aperture photometry for star cluster studies." pith.science (2026). https://pith.science/paper/RB74UT5P
@misc{pith2026250608674,
  author       = {Pith},
  title        = {Pith review of: Deriving physical parameters of unresolved star clusters. VIII. Limits of aperture photometry for star cluster studies},
  year         = {2026},
  howpublished = {\url{https://pith.science/paper/RB74UT5P}},
  note         = {Machine review of arXiv:2506.08674}
}
read the original abstract
Recently, it has been noticed that the discrepancies in the integrated colour indices (CIs) between star clusters and models are mostly due to the projection of bright stars in the apertures. In order to reduce this problem, the method of adaptive aperture photometry has been proposed. This method has been applied to star clusters from the M 31 Panchromatic Hubble Andromeda Treasury (PHAT) survey, and studies show that the adaptive aperture photometry performs better than the conventional approach. The aim of this study is to determine the best achievable limits on the accuracy and applicability of the aperture photometry method for studying star clusters in the local Universe. We computed a large network of artificial 3D star clusters spanning the parameter space of the M 31 clusters. We then simulated images of these clusters by projecting each onto a 2D plane from 100 directions. Star cluster images were generated in six passbands to match the PHAT survey. To investigate the limiting accuracy of aperture photometry and the limits of its applicability to star cluster studies, we measured the simulated images and performed parameter determination tests. We demonstrate that star clusters with and without post-main-sequence stars have significant photometric differences. We show that in order to obtain reliable physical parameters of star clusters, the CIs must be measured using an aperture with a radius larger than the cluster's half-light radius. Furthermore, we demonstrate that the parameter determination of young clusters (~10 Myr) is problematic regardless of the aperture size used. Therefore, it is advisable to determine the parameters of these clusters using colour-magnitude diagram fitting methods, when possible. We also show that the randomness of the viewing angle can lead to a CI uncertainty of up to 0.1 mag, depending on cluster parameters and aperture size.
Figures


Figures from the paper (9 more)




Reference graph
Works this paper leans on
-
[1]
Aarseth, S. J., Henon, M., & Wielen, R. 1974, A&A, 37, 183
work page 1974
- [2]
-
[3]
Adamo, A., Zeidler, P., Kruijssen, J. M. D., et al. 2020, Space Sci. Rev., 216, 69
2020
-
[4]
2013, ApJ, 778, 138 Astropy Collaboration, Price-Whelan, A
Anders, P., Kotulla, R., de Grijs, R., & Wicker, J. 2013, ApJ, 778, 138 Astropy Collaboration, Price-Whelan, A. M., Sip˝ocz, B. M., et al. 2018, AJ, 156, 123 Astropy Collaboration, Robitaille, T. P., Tollerud, E. J., et al. 2013, A&A, 558, A33
2013
-
[5]
2012, MNRAS, 419, 2606
Bastian, N., Adamo, A., Gieles, M., et al. 2012, MNRAS, 419, 2606
2012
-
[6]
Beerman, L. C., Johnson, L. C., Fouesneau, M., et al. 2012, ApJ, 760, 104 Bialopetraviˇcius, J., Narbutis, D., & Vanseviˇcius, V . 2019, A&A, 621, A103 Bridžius, A., Narbutis, D., Stonkut ˙e, R., Deveikis, V ., & Vanseviˇcius, V . 2008, Baltic Astronomy, 17, 337
work page 2012
-
[7]
& Gnedin, O
Brown, G. & Gnedin, O. Y . 2021, MNRAS, 508, 5935
2021
- [8]
Show all 52 references
-
[9]
& Romanowsky, A
Caldwell, N. & Romanowsky, A. J. 2016, ApJ, 824, 42
2016
-
[10]
A., & Harding, P
Caldwell, N., Schiavon, R., Morrison, H., Rose, J. A., & Harding, P. 2011, AJ, 141, 61
2011
-
[11]
C., Sabbi, E., et al
Calzetti, D., Lee, J. C., Sabbi, E., et al. 2015, AJ, 149, 51
2015
-
[12]
O., Lee, J
Cook, D. O., Lee, J. C., Adamo, A., et al. 2019, MNRAS, 484, 4897
2019
-
[13]
D., Puerari, I., & Rosa-González, D
Cuevas-Otahola, B., Mayya, Y . D., Puerari, I., & Rosa-González, D. 2020, MN- RAS, 492, 993 ˇCeponis, M., Stonkut ˙e, R., & Vansevi ˇcius, V . 2024, Lithuanian Journal of Physics, 64, 122
2020
-
[14]
J., Williams, B
Dalcanton, J. J., Williams, B. F., Lang, D., et al. 2012, ApJS, 200, 18 de Meulenaer, P., Narbutis, D., Mineikis, T., & Vanseviˇcius, V . 2013, A&A, 550, A20 de Meulenaer, P., Narbutis, D., Mineikis, T., & Vanseviˇcius, V . 2014, A&A, 569, A4 de Meulenaer, P., Stonkut˙e, R., &...
2012
-
[15]
C., Whitmore, B
Deger, S., Lee, J. C., Whitmore, B. C., et al. 2022, MNRAS, 510, 32
2022
-
[16]
2008, Baltic Astronomy, 17, 351
Deveikis, V ., Narbutis, D., Stonkut˙e, R., Bridžius, A., & Vansevi ˇcius, V . 2008, Baltic Astronomy, 17, 351
2008
-
[17]
Elson, R. A. W., Fall, S. M., & Freeman, K. C. 1987, ApJ, 323, 54
1987
-
[18]
Fitzpatrick, E. L. 1999, PASP, 111, 63
1999
-
[19]
J., Boily, C
Fleck, J. J., Boily, C. M., Lançon, A., & Deiters, S. 2006, MNRAS, 369, 1392
2006
-
[20]
C., Weisz, D
Fouesneau, M., Johnson, L. C., Weisz, D. R., et al. 2014, ApJ, 786, 117
2014
-
[21]
& Lançon, A
Fouesneau, M. & Lançon, A. 2010, A&A, 521, A22
2010
-
[22]
Fouesneau, M., Lançon, A., Chandar, R., & Whitmore, B. C. 2012, ApJ, 750, 60
2012
-
[23]
& Gieles, M
Gaburov, E. & Gieles, M. 2008, MNRAS, 391, 190
2008
-
[24]
Y ., Offner, S
Grudic, M. Y ., Offner, S. S. R., Guszejnov, D., Faucher-Giguère, C.-A., & Hop- kins, P. F. 2023, The Open Journal of Astrophysics, 6, 48
2023
-
[25]
Hunter, J. D. 2007, Computing in Science & Engineering, 9, 90
2007
-
[26]
C., Seth, A
Johnson, L. C., Seth, A. C., Dalcanton, J. J., et al. 2016, ApJ, 827, 33
2016
-
[27]
C., Seth, A
Johnson, L. C., Seth, A. C., Dalcanton, J. J., et al. 2015, ApJ, 802, 127
2015
-
[28]
C., Wainer, T
Johnson, L. C., Wainer, T. M., Torresvillanueva, E. E., et al. 2022, ApJ, 938, 81
2022
-
[29]
1962, AJ, 67, 471 Krišˇci¯unas, E., Daugevi ˇcius, K., Stonkut ˙e, R., & Vansevi ˇcius, V
King, I. 1962, AJ, 67, 471 Krišˇci¯unas, E., Daugevi ˇcius, K., Stonkut ˙e, R., & Vansevi ˇcius, V . 2023, A&A, 677, A100
1962
-
[30]
2001, MNRAS, 322, 231
Kroupa, P. 2001, MNRAS, 322, 231
2001
-
[31]
R., Fumagalli, M., da Silva, R
Krumholz, M. R., Fumagalli, M., da Silva, R. L., Rendahl, T., & Parra, J. 2015, MNRAS, 452, 1447
2015
-
[32]
R., McKee, C
Krumholz, M. R., McKee, C. F., & Bland-Hawthorn, J. 2019, ARA&A, 57, 227
2019
-
[33]
Lada, C. J. & Lada, E. A. 2003, ARA&A, 41, 57
2003
-
[34]
Larsen, S. S. 1999, A&AS, 139, 393
1999
-
[35]
Larsen, S. S. 2004, A&A, 416, 537
2004
-
[36]
C., Whitmore, B
Lee, J. C., Whitmore, B. C., Thilker, D. A., et al. 2022, ApJS, 258, 10
2022
-
[37]
2017, ApJ, 835, 77
Marigo, P., Girardi, L., Bressan, A., et al. 2017, ApJ, 835, 77
2017
-
[38]
W., Irwin, M
McConnachie, A. W., Irwin, M. J., Ferguson, A. M. N., et al. 2005, MNRAS, 356, 979
2005
-
[39]
McLaughlin, D. E. & van der Marel, R. P. 2005, ApJS, 161, 304
2005
-
[40]
D., Larsen, S
Mora, M. D., Larsen, S. S., Kissler-Patig, M., Brodie, J. P., & Richtler, T. 2009, A&A, 501, 949
2009
-
[41]
2014, A&A, 569, A30
Narbutis, D., Semionov, D., Stonkut˙e, R., et al. 2014, A&A, 569, A30
2014
-
[42]
2021, A&A, 654, A6 Portegies Zwart, S
Naujalis, R., Stonkut˙e, R., & Vanseviˇcius, V . 2021, A&A, 654, A6 Portegies Zwart, S. F., McMillan, S. L. W., & Gieles, M. 2010, ARA&A, 48, 431
2021
-
[43]
& Bressert, E
Robitaille, T. & Bressert, E. 2012, APLpy: Astronomical Plotting Library in
2012
-
[44]
E., Bastian, N., Adamo, A., et al
Ryon, J. E., Bastian, N., Adamo, A., et al. 2015, MNRAS, 452, 525
2015
-
[45]
A., Haas, M
Scheepmaker, R. A., Haas, M. R., Gieles, M., et al. 2007, A&A, 469, 925 Šableviˇci¯ut˙e, I., Vanseviˇcius, V ., Kodaira, K., et al. 2007, Baltic Astronomy, 16, 397 Vanseviˇcius, V ., Kodaira, K., Narbutis, D., et al. 2009, ApJ, 703, 1872
2007
-
[46]
E., et al
Virtanen, P., Gommers, R., Oliphant, T. E., et al. 2020, Nature Methods, 17, 261
2020
-
[47]
M., Johnson, L
Wainer, T. M., Johnson, L. C., Seth, A. C., et al. 2022, ApJ, 928, 15
2022
-
[48]
R., Johnson, L
Weisz, D. R., Johnson, L. C., Foreman-Mackey, D., et al. 2015, ApJ, 806, 198
2015
-
[49]
C., Chandar, R., Lee, J., et al
Whitmore, B. C., Chandar, R., Lee, J., et al. 2020, ApJ, 889, 154
2020
-
[50]
C., Chandar, R., Lee, J
Whitmore, B. C., Chandar, R., Lee, J. C., et al. 2023, MNRAS, 520, 63
2023
-
[51]
F., Durbin, M
Williams, B. F., Durbin, M. J., Dalcanton, J. J., et al. 2021, ApJS, 253, 53
2021
-
[52]
1994, ApJS, 95, 107 Article number, page 14 of 14
Worthey, G. 1994, ApJS, 95, 107 Article number, page 14 of 14
1994
Reviewed August 7, 2026 · model on record in the stance chip above.
Discussion (0). Sign in to comment.