REVIEW 4 major objections 5 minor 36 references
Price Discovery in Cryptocurrency Markets
T0 review · 4 major / 5 minor · reviewed 2026-08-07 · deepseek-v4-flash
Pith's one-line read Centralized exchanges lead price discovery in cryptocurrency markets, with futures ahead of spot for Bitcoin except in stress events.
desk verdict Standard price-discovery methods applied to 2024 crypto data, but the VECM estimates contain internal inconsistencies that sink the central claim. read the letter →
The pith
A machine-rendered reading of the paper's core claim, the machinery that carries it, and where it could break.
The reading
What carries the argument
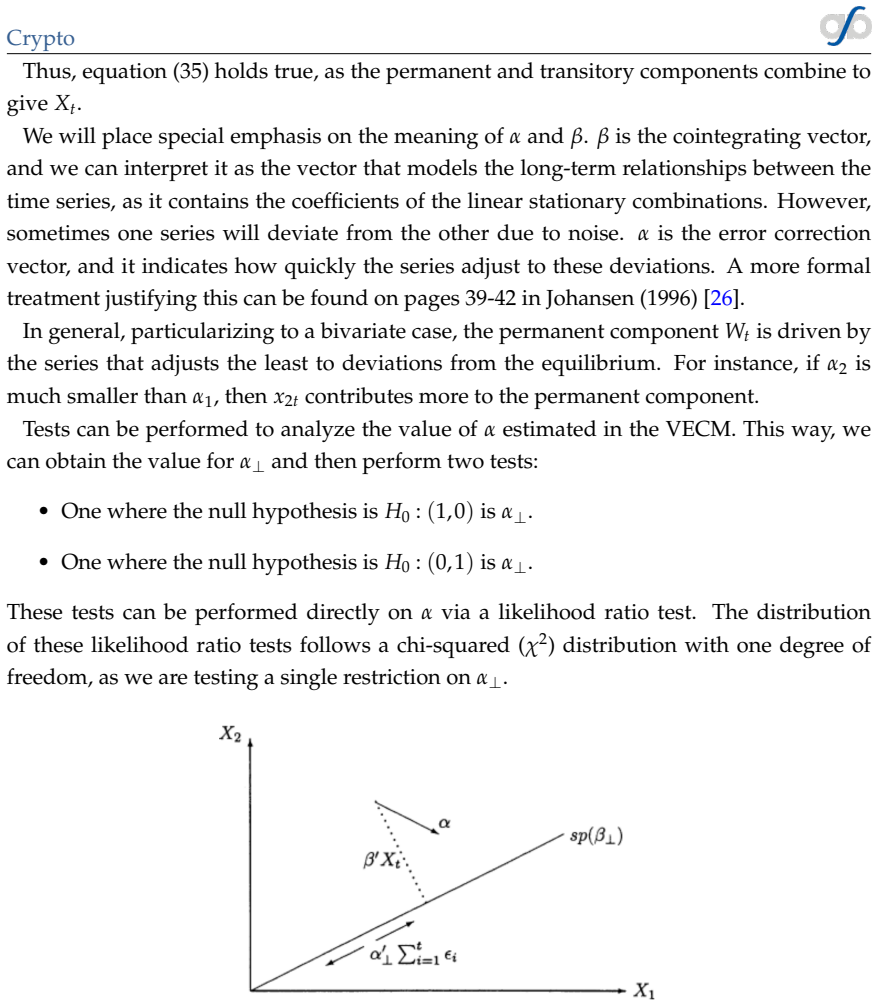
The quantitative engine is a bivariate vector error correction model (VECM) fitted to each pair of price series, plus three statistics derived from it. Hasbrouck's information share attributes the variance of the common efficient price to each market and yields a 0-to-1 dominance score. The Gonzalo-Granger permanent-transitory decomposition reads the leader off the error-correction vector alpha: the market that adjusts least to price gaps carries the common stochastic trend. The Hayashi-Yoshida lagged estimator handles asynchronous tick data and reports which market's movements precede the other's, summarized as a lead-lag ratio and a lead time in seconds. The three measures are deliberately redundant, and when they agree the paper treats the directional conclusion as robust.
What would settle it
Recompute the May 20 ETH event metrics without the cointegration assumption, for example with pure lead-lag correlations on returns or with a model that lets the series drift apart, and see whether Binance still leads. A second check is to apply the identical metric suite to 60-minute windows around each event, where cointegration is far more likely to hold, and test whether the August 5, 2024 spot-leads-futures flip for BTC persists.
Extended reading notes
Core claim
The paper's central claim is that the centralized market is the price leader for ETH, and that futures lead spot for BTC except under stress. In the long-run ETH analysis, the centralized market's Hasbrouck information share is 0.999 against essentially zero for Uniswap v2, and the Gonzalo-Granger adjustment vector points the same way: Uniswap does the correcting while Binance does the discovering. Across the five 2024 event windows, the centralized share stays above 0.9 in four cases and is 0.628 in the remaining one (May 20), with every Hayashi-Yoshida lead-lag ratio above 1, indicating Binance leads. For BTC, the CME futures market shows Hasbrouck shares between 0.52 and 0.56 and positive lead-lag times of 0.055 to 0.15 seconds on most dates, but on August 5, 2024 the futures share collapses to 0.158 and all three metrics place the lead in the Binance spot market. The paper reads this as futures leading more often, although not as decisively as centralized spot leads decentralized exchange.
Load-bearing premise
The results stand or fall on the assumption that the two price series are cointegrated inside each short 14-to-20-minute event window, which is what makes the VECM information shares interpretable; the paper's own Johansen test for the May 20, 2024 ETH window finds no cointegration at the 10% level, yet the analysis of that window proceeds anyway.
Editorial extensions
If this is right
- Traders tracking ETH should treat Binance as the reference price and read Uniswap v2 deviations as lagged adjustments rather than independent information, because that is the direction the paper's three metrics point.
- For BTC under normal conditions, CME futures order flow is the earlier signal, with measured lead times between 0.055 and 0.15 seconds over Binance spot.
- The ordering is not fixed: on August 5, 2024, all three metrics place the lead in the Binance spot market, so stress events can temporarily invert the futures-spot hierarchy.
- DeFi arbitrage between Uniswap v2 and Binance is rarely profitable once gas fees are included, so the price gaps the paper documents mostly reflect transaction costs rather than exploitable profit.
- Applying the same metric suite to Uniswap v3 pools, which the paper notes hold more liquidity than v2, is the natural follow-up it explicitly proposes.
Reading between the lines
- If the centralized lead is caused by liquidity and speed, then the ETH ordering should weaken as Uniswap v3 and layer-2 venues gain depth; the paper only tests Uniswap v2, so this is a testable prediction of its own explanation.
- The August 5 reversal suggests a rule the paper leaves implicit: when the shock arrives outside CME trading hours, the 24/7 spot market becomes the information source until futures reopen, which can be checked from the timestamps of the lead-lag flip.
- The May 20 ETH window, where the Johansen test finds no cointegration yet the analysis proceeds, is the case to re-estimate without the cointegration assumption before treating the centralized-lead result as universal.
- Combining all three venues in one model could reveal whether the spot-futures and centralized-decentralized leads are two faces of the same fact, namely Binance spot as the anchor price, or two separate mechanisms.
Editorial analysis
A structured set of objections, weighed in public.
Referee Report
Summary. This paper studies price discovery in cryptocurrency markets using VECM-based Hasbrouck information shares, Gonzalo-Granger permanent-transitory decompositions, and Hayashi-Yoshida lead-lag statistics. For ETH it compares Binance spot with Uniswap v2 prices over a one-year span and five 14–20 minute event windows in 2024; for BTC it compares CME Micro Bitcoin futures with Binance spot over the same event windows. The headline claims are that the centralized market consistently leads the decentralized market for ETH, and that futures generally lead spot for BTC, with August 5, 2024 as a notable exception in the BTC case. The paper also provides a detailed reconstruction of Uniswap v2/v3 order books and an arbitrage-cost analysis based on gas fees.
Significance. If the results were reliable, the paper would offer a useful benchmark for assessing AMM oracle quality and for understanding information flow between centralized and decentralized venues, and between futures and spot markets. The institutional and data-processing material on reconstructing Uniswap order books is a genuine contribution, and the use of multiple price-discovery measures is appropriate in principle. However, the empirical support as currently reported is not yet solid enough to carry the headline conclusions. Load-bearing problems in the event-window VECM estimation, in the internal consistency of the Hasbrouck shares, and in the unspecified synchronization of the two price series prevent the paper from establishing its central claims in its present form.
major comments (4)
- [Section 3.1.4, Table 3.11] The Johansen trace test for the May 20 ETH window rejects both r=0 (16.80 > 13.43) and r=1 (6.755 > 2.705) at the 10% level. The paper states that the two series are not found to be cointegrated by this test and that the analysis is performed anyway. With no single cointegrating vector, the VECM is not identified for the assumed one common trend, and the Hasbrouck and Gonzalo-Granger shares in Table 3.12 are not valid estimates. This event therefore cannot be counted as evidence for the universal 'centralized leads' claim unless the model is re-specified and the test issue is resolved.
- [Tables 3.9 and 3.12] The reported Hasbrouck information shares do not sum to one within each Cholesky ordering. For April 30, Table 3.9 gives 0.965 + 0.076 = 1.041 and 0.923 + 0.003 = 0.926. For May 20, Table 3.12 gives 0.628 + 0.416 = 1.044 and 0.583 + 0.371 = 0.954. Hasbrouck information shares partition the innovation variance of the common factor, so each ordering should sum to one. This indicates a computational or reporting error in a central metric and requires correction and re-estimation.
- [Section 3.1 and Section 2.8] The paper never specifies how the one-second Binance series is synchronized with the sparse, block-level Uniswap v2 observations before estimating the VECM. Hasbrouck and Gonzalo-Granger methods require a synchronous bivariate series, and the choice of interpolation, aggregation, or timestamp alignment can mechanically create or erase lead-lag signals. The authors should describe the exact synchronization procedure and show that the price-discovery conclusions are robust to alternative reasonable alignments.
- [Section 3.3 and Table 3.35] No confidence intervals or standard errors are reported for any information share, Gonzalo-Granger alpha test, or Hayashi-Yoshida metric. This is especially damaging for the BTC futures-leads-spot conclusion, where the information shares are 0.52–0.56 and the LLR values are 1.11–1.36, i.e., close to the null values of 0.5 and 1.0. Without precision measures, these estimates do not distinguish 'futures lead' from 'both markets contribute equally.' At a minimum, block-bootstrap or delta-method confidence intervals should be provided for each event.
minor comments (5)
- [Section 3.1.1, Table 3.2] The text reports a centralized information share of 0.9996 for both orderings and a decentralized share of 4.2071e-4, but Table 3.2 shows centralized shares of 0.999 and 0.982 and decentralized shares of 0.001 and 0.018. These numbers are inconsistent and should be reconciled.
- [Section 3.1.2, Table 3.4] The text states that the rank-1 trace statistic of 2.113 'exceeds the critical value (2.705)' and thus rejects r=1, but 2.113 is less than 2.705. The correct reading is that exactly one cointegrating relationship is supported; this reversed inequality should be fixed.
- [Section 3.3.4 and Table 3.35] The text reports an August 5 BTC lead-lag time of -0.057 seconds, while Table 3.35 lists -0.571 seconds. One of these is a typographical error and should be corrected.
- [Section 3.1 (event windows)] The paper asserts that the series are 'clearly non-stationary' but reports no unit-root test statistics for the event windows. The VECM setup depends on this assumption, so the supporting tests should be reported or referenced.
- [Section 3.1.2, Gas Fee Calculation] The arbitrage cost calculation uses a gas limit of 50,000, which is low for a Uniswap swap; if actual gas usage is larger, the conclusion that arbitrage is unprofitable would only be strengthened, but the cost figure should be justified or corrected.
Circularity Check
No circularity: the price-discovery conclusions are data-driven estimates interpreted with standard metrics, not derivations equivalent to the paper's own inputs.
full rationale
The paper's chain is standard empirical inference. Long-run and event-window VECMs are estimated from Binance/Uniswap and CME/Binance price series; Hasbrouck information shares, Gonzalo-Granger permanent-transitory decompositions, and Hayashi-Yoshida lead-lag ratios are then computed from the estimated adjustment coefficients, residual covariance, and tick returns. The central statements—'the centralized market incorporated the most information in most cases' and 'the futures market appears to lead more often'—are interpretations of those estimated metrics, not quantities defined to equal the inputs. There is no fitted parameter renamed as a prediction and no out-of-sample claim. The nearest concern is Section 3.1.4, where the reported Johansen test does not support a single cointegrating vector and the paper states 'we decide to perform the analysis anyway'; this is a maintained-assumption/validity problem, not circularity, because the information shares are not constructed from the cointegration test result. Similarly, the non-summing Hasbrouck shares in Table 3.12 and the incorrect verbal reading of Table 3.4's rank-1 statistic are statistical or reporting errors, not evidence that the conclusion reduces to the data by construction. No load-bearing self-citations, imported uniqueness theorems, or ansatz-smuggling citations appear. The comparison with prior Bitcoin futures literature is used only as external context. The derivation is therefore self-contained and non-circular.
Assumptions & free parameters
free parameters (5)
- VECM alpha adjustment coefficients =
long-run (-0.026, 0.958); event values e.g.
- VECM cointegrating vector beta =
[1, -0.999] for long-run ETH; other windows not reported
- VECM lag order =
p = 1 for all windows
- Hayashi-Yoshida lag grid =
not disclosed (the text says 'arbitrarily choosing')
- Gas limit for arbitrage fee =
50,000 gas units
assumptions (6)
- domain assumption Binance and Uniswap v2 ETH prices are I(1) and cointegrated, so a VECM(1) is the correct model.
- domain assumption Sparse Uniswap v2 trade or block observations can be aligned with 1-second Binance data to form a bivariate time series.
- domain assumption The WETH/USDT Uniswap v2 pool price and the Binance ETH price represent the same asset with a stationary difference.
- domain assumption The CME Micro Bitcoin futures price and Binance spot BTC price are cointegrated with a stationary basis, and no maturity or convenience-yield adjustment is needed.
- ad hoc to paper Long-run cointegration justifies VECM estimation on 14-20 minute event windows.
- standard math Standard asymptotic theory for Johansen, Hasbrouck, and Gonzalo-Granger statistics applies to these short, heteroskedastic, high-frequency samples.
Cite this review
Pith. "Pith review of Price Discovery in Cryptocurrency Markets." pith.science (2026). https://pith.science/paper/OGL5RFMU
@misc{pith2026250608718,
  author       = {Pith},
  title        = {Pith review of: Price Discovery in Cryptocurrency Markets},
  year         = {2026},
  howpublished = {\url{https://pith.science/paper/OGL5RFMU}},
  note         = {Machine review of arXiv:2506.08718}
}
read the original abstract
This document analyzes price discovery in cryptocurrency markets by comparing centralized and decentralized exchanges, as well as spot and futures markets. The study focuses first on Ethereum (ETH) and then applies a similar approach to Bitcoin (BTC). Chapter 1 outlines the theoretical framework, emphasizing the structural differences between centralized exchanges and decentralized finance mechanisms, especially Automated Market Makers (AMMs). It also explains how to construct an order book from a liquidity pool in a decentralized setting for comparison with centralized exchanges. Chapter 2 describes the methodological tools used: Hasbrouck's Information Share, Gonzalo and Granger's Permanent-Transitory decomposition, and the Hayashi-Yoshida estimator. These are applied to explore lead-lag dynamics, cointegration, and price discovery across market types. Chapter 3 presents the empirical analysis. For ETH, it compares price dynamics on Binance and Uniswap v2 over a one-year period, focusing on five key events in 2024. For BTC, it analyzes the relationship between spot and futures prices on the CME. The study estimates lead-lag effects and cointegration in both cases. Results show that centralized markets typically lead in ETH price discovery. In futures markets, while they tend to lead overall, high-volatility periods produce mixed outcomes. The findings have key implications for traders and institutions regarding liquidity, arbitrage, and market efficiency. Various metrics are used to benchmark the performance of modified AMMs and to understand the interaction between decentralized and centralized structures.
Figures


Figures from the paper (24 more)


Reference graph
Works this paper leans on
-
[1]
Hayden Adams et al. Uniswap v3 Core. 2021. URL: https://api.semanticscholar. org/CorpusID:232416764
work page 2021
-
[2]
Luigi Ambrosio. Lecture Notes. Google Sites. https://sites.google.com/site/ ambropo/LectureNotes. 2024
work page 2024
-
[3]
Coexisting Exchange Platforms: Limit Order Books and Auto- mated Market Makers
Jun Aoyagi and Yuki Ito. Coexisting Exchange Platforms: Limit Order Books and Auto- mated Market Makers . 2021. SSRN: 3808755. URL: https : / / ssrn . com / abstract = 3808755
work page 2021
-
[4]
Price discovery and common factor models
Richard T. Baillie et al. “Price discovery and common factor models”. In: Journal of Financial Markets 5.3 (2002). Price Discovery, pp. 309–321. ISSN : 1386-4181. DOI: https : / / doi . org / 10 . 1016 / S1386 - 4181(02 ) 00027 - 7. URL: https : / / www . sciencedirect.com/science/article/pii/S1386418102000277
work page 2002
-
[5]
On The Quality Of Cryptocurrency Markets: Cen- tralized Versus Decentralized Exchanges
Andrea Barbon and Angelo Ranaldo. On The Quality Of Cryptocurrency Markets: Cen- tralized Versus Decentralized Exchanges . 2021. arXiv: 2112 . 07386 [q-fin.TR]. URL: https://arxiv.org/abs/2112.07386
arXiv 2021
-
[6]
Binance: Cryptocurrency Exchange
Binance. Binance: Cryptocurrency Exchange. https://www.binance.com. 2024
work page 2024
-
[7]
John Y. Campbell, Andrew W. Lo, and A.Craig MacKinlay. The Econometrics of Fi- nancial Markets. Princeton University Press, 1997. ISBN : 9780691043012. URL: http: //www.jstor.org/stable/j.ctt7skm5 (visited on 07/24/2024)
work page 1997
-
[8]
Price Discovery on Decentralized Ex- changes
Agostino Capponi, Ruizhe Jia, and Shihao Yu. Price Discovery on Decentralized Ex- changes. 2024. URL: https://ink.library.smu.edu.sg/lkcsb_research/7508
work page 2024
Show all 36 references
-
[9]
Cartea, S
Á. Cartea, S. Jaimungal, and J. Penalva. Algorithmic and High-Frequency Trading. Cam- bridge University Press, 2015. ISBN : 9781107091146. URL: https://books.google. es/books?id=5dMmCgAAQBAJ
2015
-
[10]
Flash Boys 2.0: Frontrunning, Transaction Reordering, and Consensus Instability in Decentralized Exchanges
Philip Daian et al. Flash Boys 2.0: Frontrunning, Transaction Reordering, and Consensus Instability in Decentralized Exchanges. 2019. arXiv: 1904.05234 [cs.CR]. URL: https: //arxiv.org/abs/1904.05234
2019 arXiv
-
[11]
OxMetrics: An Interface to Empirical Modelling
Jurgen A. Doornik and David F. Hendry. “OxMetrics: An Interface to Empirical Modelling”. In: 9th OxMetrics User Conference. 2018. 90 Crypto
2018
-
[12]
Dynamic Conditional Correlation: A Simple Class of Multivariate Generalized Autoregressive Conditional Heteroskedasticity Models
Robert F. Engle. “Dynamic Conditional Correlation: A Simple Class of Multivariate Generalized Autoregressive Conditional Heteroskedasticity Models”. In: Journal of Business & Economic Statistics 20.3 (2002), pp. 339–350
2002
-
[13]
Etherscan: Ethereum Blockchain Explorer
Etherscan. Etherscan: Ethereum Blockchain Explorer. https://etherscan.io. 2024
2024
-
[14]
Modelling and measuring price dis- covery in commodity markets
Isabel Figuerola-Ferretti and Jesus Gonzalo. “Modelling and measuring price dis- covery in commodity markets”. In: Journal of Econometrics 158.1 (2010), pp. 95–107
2010
-
[15]
Ethereum poised for high volatility as Grayscale CEO departs several days be- fore SEC’s ETF decision
FXStreet. Ethereum poised for high volatility as Grayscale CEO departs several days be- fore SEC’s ETF decision . Accessed: 2024-05-20. 2024. URL: https://www.fxstreet. com / cryptocurrencies / news / ethereum - poised - for - high - volatility - as - grayscale-ceo-departs-sev...
2024
-
[16]
Estimation of Common Long-Memory Com- ponents in Cointegrated Systems
Jesus Gonzalo and Clive Granger. “Estimation of Common Long-Memory Com- ponents in Cointegrated Systems”. In: Journal of Business & Economic Statistics 13.1 (1995), pp. 27–35. ISSN : 07350015. URL: http://www.jstor.org/stable/1392518 (visited on 07/18/2024)
1995
-
[17]
Estimation of Common Long-Memory Com- ponents in Cointegrated Systems
Jesus Gonzalo and Clive Granger. “Estimation of Common Long-Memory Com- ponents in Cointegrated Systems”. In: Journal of Business & Economic Statistics 13.1 (1995), pp. 27–35
1995
-
[18]
Investigating Causal Relations by Econometric Models and Cross- spectral Methods
C. W. J. Granger. “Investigating Causal Relations by Econometric Models and Cross- spectral Methods”. In:Econometrica 37.3 (1969), pp. 424–438.ISSN : 00129682, 14680262. URL: http://www.jstor.org/stable/1912791 (visited on 07/25/2024)
1969
-
[19]
Trust in DeFi: An Empirical Study of the Decentralized Exchange
Jianlei Han, Shiyang Huang, and Zhuo Zhong. Trust in DeFi: An Empirical Study of the Decentralized Exchange. 2021. SSRN: 3896461. URL: https://papers.ssrn.com/ sol3/papers.cfm?abstract_id=3896461
2021
-
[20]
One Security, Many Markets: Determining the Contributions to Price Discovery
Joel Hasbrouck. “One Security, Many Markets: Determining the Contributions to Price Discovery”. In: Journal of Finance 50.4 (1995), pp. 1175–1199
1995
-
[21]
On covariance estimation of non-synchronously observed diffusion processes
Takaki Hayashi and Nakahiro Yoshida. “On covariance estimation of non-synchronously observed diffusion processes”. In: Bernoulli 11.2 (2005), pp. 359–379. DOI: 10.3150/ bj/1116340299. URL: https://doi.org/10.3150/bj/1116340299
2005
-
[22]
Behavior of Liquidity Providers in Decentralized Exchanges
Lioba Heimbach, Ye Wang, and Roger Wattenhofer. Behavior of Liquidity Providers in Decentralized Exchanges. 2021. arXiv: 2105.13822 [q-fin.CP]. URL: https://arxiv. org/abs/2105.13822
2021 arXiv
-
[23]
What role do futures markets play in Bitcoin pricing? Causality, cointegration and price discovery from a time-varying perspective?
Yang Hu, Yang Greg Hou, and Les Oxley. “What role do futures markets play in Bitcoin pricing? Causality, cointegration and price discovery from a time-varying perspective?” In: International Review of Financial Analysis 72 (2020), p. 101569. ISSN : 1057-5219. DOI: https://doi....
2020
-
[24]
High Frequency Lead/Lag Relationships—Empirical Facts
Nicolas Huth and Frederic Abergel. “High Frequency Lead/Lag Relationships—Empirical Facts”. In: Quantitative Finance 14.4 (2014), pp. 497–507
2014
-
[25]
Estimation and Hypothesis Testing of Cointegration Vectors in Gaussian Vector Autoregressive Models
Søren Johansen. “Estimation and Hypothesis Testing of Cointegration Vectors in Gaussian Vector Autoregressive Models”. In:Econometrica 59.6 (1991), pp. 1551–1580. ISSN : 00129682, 14680262. URL: http://www.jstor.org/stable/2938278 (visited on 09/03/2024)
1991
-
[26]
Likelihood-Based Inference in Cointegrated Vector Autoregressive Models
Søren Johansen. Likelihood-Based Inference in Cointegrated Vector Autoregressive Models. Oxford University Press, 1996
1996
-
[27]
The role of the constant and linear terms in cointegration analysis of nonstationary variables
Søren Johansen. “The role of the constant and linear terms in cointegration analysis of nonstationary variables”. In: Econometric Reviews 13.2 (1994), pp. 205–229. DOI: 10.1080/07474939408800284
1994 doi
-
[28]
Smart Contracts and Decentralized Fi- nance
Kose John, Leonid Kogan, and Fahad Saleh. “Smart Contracts and Decentralized Fi- nance”. In: SSRN Electronic Journal(2022). DOI: 10.2139/ssrn.4222528. URL: https: //papers.ssrn.com/sol3/papers.cfm?abstract_id=4222528
2022 doi
-
[29]
Fragmentation and optimal liq- uidity supply on decentralized exchanges
Alfred Lehar, Christine Parlour, and Marius Zoican. Fragmentation and optimal liq- uidity supply on decentralized exchanges . 2024. arXiv: 2307 . 13772 [q-fin.TR]. URL: https://arxiv.org/abs/2307.13772
2024 arXiv
-
[30]
Spoofing and Layering
Gideon Mark. “Spoofing and Layering”. In: Journal of Corporation Law 45.2 (2020), pp. 399–430
2020
-
[31]
Putnin, š
T ¯alis J. Putnin, š. An Overview of Market Manipulation. SSRN, 2019, p. 46
2019
-
[32]
Refinitiv: Financial Market Data and Infrastructure
Refinitiv. Refinitiv: Financial Market Data and Infrastructure. https://www.refinitiv. com. 2024
2024
-
[33]
Decentralized Finance: On Blockchain- and Smart Contract-Based Fi- nancial Markets
Fabian Schär. “Decentralized Finance: On Blockchain- and Smart Contract-Based Fi- nancial Markets”. In: Review 103.2 (Apr. 2021), pp. 153–174. DOI: 10.20955/r.103. 153-74. URL: https://ideas.repec.org/a/fip/fedlrv/91428.html
2021 doi
-
[34]
Statsmodels: Econometric and statistical mod- eling with Python
Skipper Seabold and Josef Perktold. “Statsmodels: Econometric and statistical mod- eling with Python”. In: 9th Python in Science Conference. 2010
2010
-
[35]
Investigating the Efficiency of Bitcoin Futures in Price Dis- covery
Prashant Sharma et al. “Investigating the Efficiency of Bitcoin Futures in Price Dis- covery”. In: International Journal of Economics and Financial Issues 12.3 (May 2022), pp. 104–109. URL: https://ideas.repec.org/a/eco/journ1/2022-03-12.html
2022
-
[36]
Ruey S. Tsay. Analysis of Financial Time Series. 3rd. Wiley, 2010, p. 712. 92 de 92
2010
Reviewed August 7, 2026 · model on record in the stance chip above.
Discussion (0). Sign in to comment.