REVIEW 3 major objections 6 minor 2 cited by
Radio-loud AGN morphology and host-galaxy properties in the LOFAR Two-Metre Sky Survey Data Release 2
T0 review · 3 major / 6 minor · reviewed 2026-08-07 · deepseek-v4-flash
Pith's one-line read Host stellar mass, not radio luminosity, decides jet morphology near the Fanaroff-Riley break, and the Ledlow-Owen relation is not supported once selection effects are controlled.
desk verdict A solid, careful catalogue paper with a defensible mass-morphology result near the FR break; the main caveat is that classification purity hasn't been shown to be mass-independent, so the central claim deserves a conditionality check rather than dismissal. read the letter →
The pith
A machine-rendered reading of the paper's core claim, the machinery that carries it, and where it could break.
The reading
What carries the argument
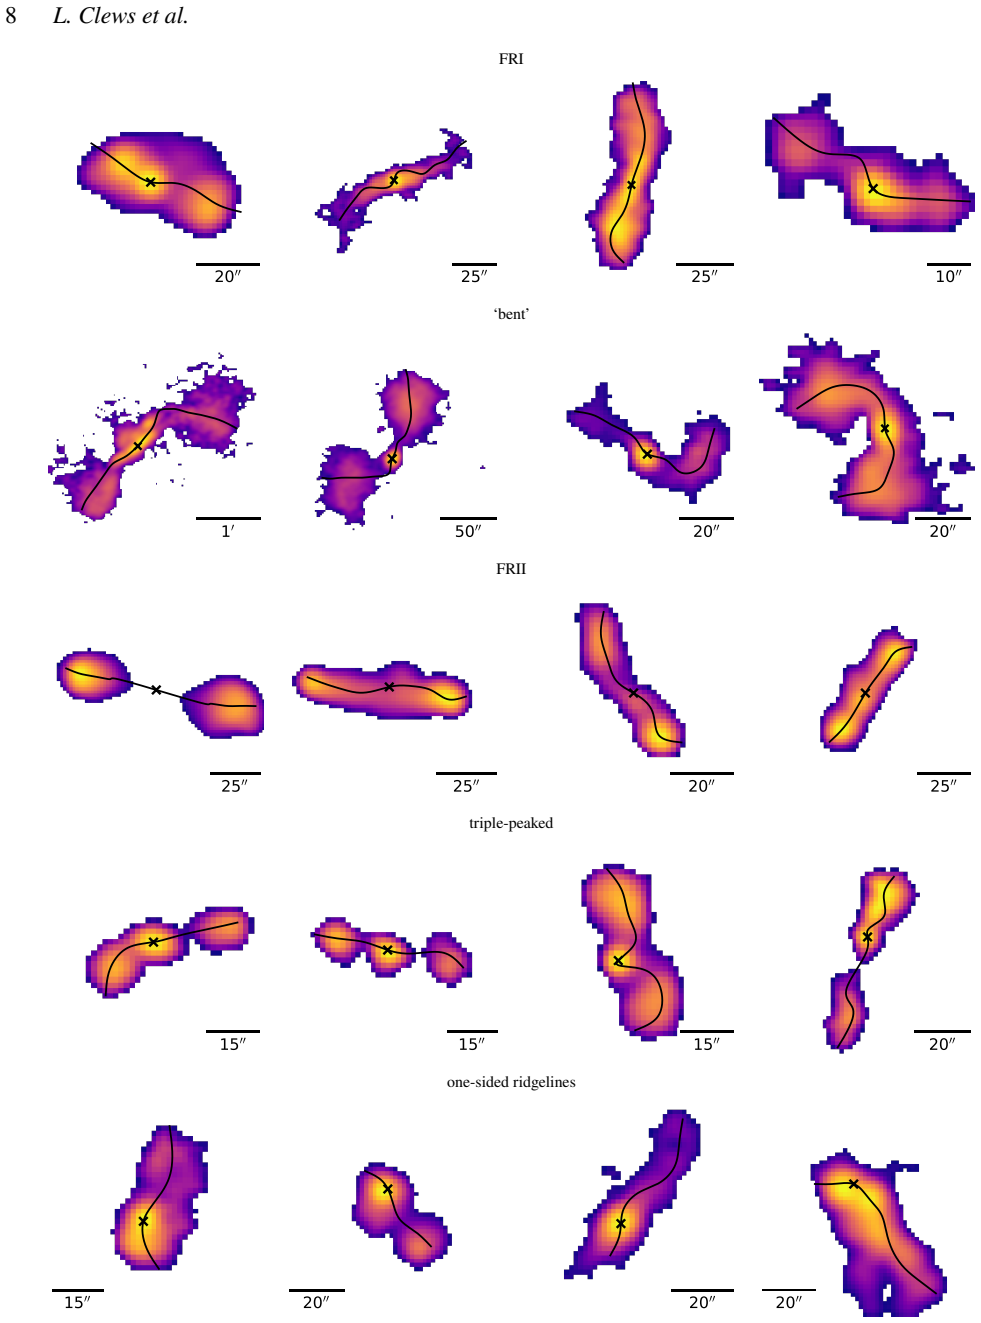
The central tool is the ridgeline, the path of highest radio surface brightness along a jet, extracted by the RL-Xid code and smoothed with a third-order parametric spline. Surface-brightness profiles along these ridgelines are embedded in two dimensions with UMAP and clustered with HDBSCAN into groups of similar jet morphology; host-galaxy positions along the ridgeline are then separated into subgroups with Gaussian mixture modelling, and curvature plus opening-angle profiles identify bent-tailed sources. This pipeline produces the clean FRI and FRII samples whose host stellar masses, specific star formation rates and environments are compared, and it is the first use of ridgeline-based, unsupervised clustering for LOFAR radio galaxies.
What would settle it
Measure whether the fraction of sources rejected by the $>45$ arcsec size cut and the dynamic-range cut in the $10^{25} \le L_{144} \le 10^{26}$ W Hz$^{-1}$ bin varies with host stellar mass: if low-mass rejected sources are preferentially faint FRIs, the mass trend could be pure selection. Alternatively, visually classify a random sample of about 500 near-break sources from the published catalogue and check whether misclassification rates are equal across stellar mass; a mass-dependent error rate would falsify the claim that the trend is physical.
Extended reading notes
Core claim
Near the Fanaroff-Riley break, host stellar mass decides morphology. For sources with $10^{25} \le L_{144} \le 10^{26}$ W Hz$^{-1}$, $200 < \text{observed size} < 1000$ kpc and $z \le 0.8$, the FRI and FRII-low stellar-mass distributions differ at $>99\%$ confidence in both Anderson-Darling and Kolmogorov-Smirnov tests, and the difference persists in three separate redshift bins, so it is not a redshift selection effect. At the same time, the paper finds no support for the Ledlow-Owen relation: partial correlation tests controlling for redshift give $r = 0.2$ ($p = 0.5$) between the break luminosity and stellar mass, and only a weak correlation with rest-frame $K_s$ magnitude that cannot be separated from selection effects. The authors conclude that jet power alone does not set the FR dichotomy and that the inner environment of the host, whose density is expected to scale with galaxy mass, plays a role in determining when jets of similar power disrupt.
Load-bearing premise
The load-bearing premise is that the ridgeline classification and the angular-size, dynamic-range and host-position cuts do not systematically depend on host stellar mass within the near-break bin; if faint FRI plumes in low-mass hosts are excluded or mislabelled more often than those in massive hosts, the observed mass-morphology trend could arise without any physical mass dependence.
Editorial extensions
If this is right
- Radio luminosity alone cannot be used to predict or classify radio morphology; near the break, host-galaxy mass carries the decisive information.
- The Fanaroff-Riley break is not a single luminosity threshold but a population transition whose location depends on host properties.
- The Ledlow-Owen relation should not be cited as evidence that jet power scales with host-galaxy mass or magnitude, since it disappears when selection effects are controlled.
- The public catalogue of about 5,900 FRI and FRII sources enables future studies of jet disruption, AGN feedback and the link between radio morphology and galaxy evolution.
- The tentative sSFR signal means stellar population content, not merely total mass, may modulate jet disruption and warrants a larger spectroscopic sample.
Reading between the lines
- If the trend is physical, radio morphology near the break becomes a rough, redshift-limited probe of host stellar mass, usable where SED-based masses are incomplete.
- The trend's robustness still rests on classification error being mass-independent; the paper's sensitivity test shows faint FRIs are mostly excluded by the selection cuts rather than mislabelled, but a mass-dependent exclusion rate would mimic the result.
- The tentative sSFR difference suggests a testable extension: a larger sample with spectroscopic sSFRs could determine whether the mass trend is driven by recent star formation rather than total mass.
- The deliberate $>45$ arcsec size cut means small FRIs are under-represented; applying the ridgeline method to higher-resolution LOFAR or VLBI data would test whether the mass dependence holds for smaller, lower-power jets.
Editorial analysis
A structured set of objections, weighed in public.
Referee Report
Summary. This paper presents a semi-automated ridgeline-based morphological classification of radio-loud AGN from LoTSS DR2, yielding Q1 samples of 2354 FRIs and 3590 FRIIs at z<=0.8. The central scientific claim is that for sources near the FR break (1e25 <= L_144 <= 1e26 W/Hz, 200 < observed size < 1000 kpc, z<=0.8), the probability of exhibiting FRI morphology increases with host stellar mass, with FRI and FRII-low stellar-mass distributions differing at >99% confidence according to Anderson-Darling and Kolmogorov-Smirnov tests (Sec. 4.2.1, Fig. 8). The paper also reports no support for the Ledlow-Owen relation when selection effects are considered (Sec. 4.2.2, Figs. 9-10) and tentative evidence that FRI hosts have higher specific star formation rates (Sec. 4.2.3). The classification pipeline is independent of host-galaxy mass and magnitude measurements, so the reported mass-morphology trend is an empirical correlation rather than a fitted prediction.
Significance. If the mass-morphology claim holds, it would support the inner-environment or jet-disruption model for the FR divide and would constitute the largest such sample studied to date. The paper's strengths include the public release of a large classified catalogue, the explicit testing of redshift selection through three redshift bins and partial-correlation analyses, and the comparison with Chilufya et al. (2025) showing 90% classification agreement. However, the central result rests on the premise that classification purity and sample selection are not correlated with host stellar mass within the near-break subsample, and this premise is not directly tested. The paper's own sensitivity test (Sec. 3.5) shows that faint FRIs are preferentially excluded by the selection cuts, which creates a plausible channel for mass-dependent selection bias. The significance is therefore conditional on additional validation; with such validation the paper would be a useful contribution to the field.
major comments (3)
- [Sec. 3.5, Fig. 8]
- [Sec. 4.2.2, Fig. 10]
- [Sec. 3.1, Table 1]
minor comments (6)
- [Fig. 8]
- [Sec. 3.4]
- [Sec. 4.1]
- [Sec. 4.2.3, Fig. 11]
- [Table 2]
- [Abstract and Sec. 3.5]
Circularity Check
No significant circularity: morphological labels are derived from radio surface-brightness ridgelines and host positions, independent of the stellar-mass and K-band measurements used in the science analysis.
full rationale
The central claim—that near the FR break the probability of FRI over FRII-low morphology increases with host stellar mass—is an empirical correlation between an independently constructed radio morphology label and host stellar masses taken from LoTSS DR2 SED modelling. The classification pipeline (UMAP/HDBSCAN on surface-brightness spline profiles, GMM host-position subgrouping, opening-angle and curvature filters) never uses stellar mass, luminosity, redshift, or absolute magnitude as inputs, so the morphological labels are not defined in terms of the quantities being correlated. The near-break selection (10^25 <= L_144 <= 10^26 W/Hz, 200 < observed size < 1000 kpc, z <= 0.8) is a fixed, pre-specified window rather than a fitted parameter, and the Anderson-Darling and Kolmogorov-Smirnov tests compare distributions rather than fit the result. The Ledlow-Owen analysis uses partial correlations controlling for redshift and is not constructed to force the null result; indeed the paper reports both a raw trend and its disappearance under redshift control. Self-citations (Barkus et al. 2022 for ridgelines; Hardcastle et al. 2023, 2025 for host identifications and masses; Mingo et al. 2019, 2022 for comparisons) are used as data sources and external validation, not as unverified theorems that force the conclusion. The paper also validates against Chilufya et al. (2025), which is independent of the present authors' classification loop. The main legitimate concern—that classification purity or the LAS>45 arcsec, dynamic-range, and Q1 host-position selection could correlate with host mass—is a selection-bias and correctness risk, not a circularity: the paper explicitly tests the sensitivity of its classifications and discloses residual sample limitations, but the morphological label is not equivalent to host mass by construction, so the reported correlation is not true by definition.
Assumptions & free parameters
free parameters (5)
- UMAP hyperparameters =
n_neighbors=400, min_dist=1e-3, n_components=2, repulsion_strength=24
- HDBSCAN hyperparameters =
min_samples=100, min_cluster_size=800, max_cluster_size=8500
- SB outlier reassignment threshold =
>=5 spline points deviating >=3 sigma from cluster mean
- Sample selection cuts =
ridgeline points>5, dynamic range>2, LAS>45 arcsec, host not in first or last 10% of ridgeline
- Near-break analysis window =
1e25 <= L_144 <= 1e26 W/Hz, 200 < observed size < 1000 kpc, z <= 0.8
assumptions (5)
- domain assumption Radio luminosity is an imperfect proxy for jet power, with order-unity scatter from environment, particle content, and radiative losses.
- domain assumption Host-galaxy stellar mass and rest-frame K-band magnitude trace the inner ISM density available to disrupt jets.
- domain assumption Ridgelines computed by RL-Xid follow the true path of the jet and its surface brightness.
- domain assumption The UMAP/HDBSCAN clusters correspond to physically meaningful morphological classes rather than artifacts of the embedding.
- domain assumption Redshift and surface-brightness selection effects are adequately controlled by the 45 arcsec size cut, dynamic range cut, and redshift-binned comparisons.
Cite this review
Pith. "Pith review of Radio-loud AGN morphology and host-galaxy properties in the LOFAR Two-Metre Sky Survey Data Release 2." pith.science (2026). https://pith.science/paper/AP4V3MYS
@misc{pith2026250608878,
  author       = {Pith},
  title        = {Pith review of: Radio-loud AGN morphology and host-galaxy properties in the LOFAR Two-Metre Sky Survey Data Release 2},
  year         = {2026},
  howpublished = {\url{https://pith.science/paper/AP4V3MYS}},
  note         = {Machine review of arXiv:2506.08878}
}
abstract
Radio-loud active galaxies (RLAGN) can exhibit various morphologies. The Fanaroff-Riley (FR) classifications, which are defined by the locations of peaks in surface brightness, have been applied to many catalogues of RLAGN. The FR classifications were initially found to correlate with radio luminosity. However, recent surveys have demonstrated that radio luminosity alone does not reliably predict radio morphology. We have devised a new-semi automated method involving ridgeline characterisations to compile the largest known classified catalogue of RLAGN to date with data from the second data release of the LOFAR Two-Metre Sky Survey (LoTSS DR2). We reassess the FR divide and its cause by examining the physical and host galaxy properties of $3590$ FRIIs and $2354$ FRIs (at $z \leq 0.8$). We find that RLAGN near the FR divide with $10^{25} \le L_{144} \le 10^{26} $ WHz$^{-1}$ are more likely to show FRI over FRII morphology if they occupy more massive host galaxies. We find no correlation, when considering selection effects, between the FR break luminosity and stellar mass or host-galaxy rest-frame absolute magnitude. Overall, we find the cause of different radio morphologies in this sample to be complex. Considering sources near the FR divide with $10^{25} \le L_{144} \le 10^{26} $ WHz$^{-1}$, we find evidence to support inner environment having a role in determining jet disruption. We make available a public catalogue of morphologies for our sample, which will be of use for future investigations of RLAGN and their impact on their surroundings.
Figures


Figures from the paper (8 more)



Forward citations
Cited by 2 Pith papers
-
Satellite quenching by radio jets of central galaxies in galaxy groups
Kinetic AGN feedback from central radio jets, particularly large FR-II lobes, quenches star formation in satellite galaxies of groups after matching halo mass, redshift, central stellar mass and SFR.
-
Tracing the Cosmic web across Cosmic time through SKA observations of radio galaxies
A review/roadmap arguing that SKA observations of radio galaxies, combined with multi-wavelength redshift and cosmic-web catalogues, will let radio galaxies trace and probe the structure, magnetism, and energetics of ...
Reference graph
Works this paper leans on
-
[1]
Abazajian K. N., et al., 2009, @doi [ApJS] 10.1088/0067-0049/182/2/543 , https://ui.adsabs.harvard.edu/abs/2009ApJS..182..543A 182, 543
-
[2]
Barkus B., et al., 2022, @doi [MNRAS] 10.1093/mnras/stab2952 , https://ui.adsabs.harvard.edu/abs/2022MNRAS.509....1B 509, 1
-
[3]
Baron Perez N., Br ''uggen M., Kasieczka G., Lucie-Smith L., 2025, @doi [arXiv e-prints] 10.48550/arXiv.2503.19111 , https://ui.adsabs.harvard.edu/abs/2025arXiv250319111B p. arXiv:2503.19111
-
[4]
Begelman M. C., Blandford R. D., Rees M. J., 1984, @doi [Reviews of Modern Physics] 10.1103/RevModPhys.56.255 , https://ui.adsabs.harvard.edu/abs/1984RvMP...56..255B 56, 255
-
[5]
Best P. N., 2009, @doi [Astronomische Nachrichten] 10.1002/asna.200811152 , https://ui.adsabs.harvard.edu/abs/2009AN....330..184B 330, 184
-
[6]
Best P. N., Kauffmann G., Heckman T. M., Brinchmann J., Charlot S., Ivezi \'c Z ., White S. D. M., 2005, @doi [MNRAS] 10.1111/j.1365-2966.2005.09192.x , https://ui.adsabs.harvard.edu/abs/2005MNRAS.362...25B 362, 25
arXiv 2005
-
[7]
V., 1994, @doi [ApJ] 10.1086/173748 , https://ui.adsabs.harvard.edu/abs/1994ApJ...422..542B 422, 542
Bicknell G. V., 1994, @doi [ApJ] 10.1086/173748 , https://ui.adsabs.harvard.edu/abs/1994ApJ...422..542B 422, 542
doi:10.1086/173748 1994
-
[8]
L., 2000, PhD thesis, Columbia University, New York
Blanton E. L., 2000, PhD thesis, Columbia University, New York
2000
Show all 81 references
-
[9]
Blanton E., 2015, Bending of WAT Radio Lobes in Abell 623 Through ICM Sloshing , Chandra proposal ID \#17800069
2015
-
[10]
L., Gregg M
Blanton E. L., Gregg M. D., Helfand D. J., Becker R. H., Leighly K. M., 2001, @doi [AJ] 10.1086/321074 , https://ui.adsabs.harvard.edu/abs/2001AJ....121.2915B 121, 2915
2001 doi
-
[11]
P., Komissarov S
Bowman M., Leahy J. P., Komissarov S. S., 1996, @doi [ ] 10.1093/mnras/279.3.899 , https://ui.adsabs.harvard.edu/abs/1996MNRAS.279..899B 279, 899
1996 doi
-
[12]
H., Perley R
Bridle A. H., Perley R. A., 1984, @doi [ARA&A] 10.1146/annurev.aa.22.090184.001535 , https://ui.adsabs.harvard.edu/abs/1984ARA&A..22..319B 22, 319
1984
- [13]
-
[14]
O., Owen F
Burns J. O., Owen F. N., 1980, @doi [AJ] 10.1086/112663 , https://ui.adsabs.harvard.edu/abs/1980AJ.....85..204B 85, 204
1980 doi
-
[15]
D., 2017, @doi [A&A] 10.1051/0004-6361/201630247 , https://ui.adsabs.harvard.edu/abs/2017A&A...601A..81C 601, A81
Capetti A., Massaro F., Baldi R. D., 2017, @doi [A&A] 10.1051/0004-6361/201630247 , https://ui.adsabs.harvard.edu/abs/2017A&A...601A..81C 601, A81
2017 doi
- [16]
-
[17]
H., Ineson J., Hardcastle M
Croston J. H., Ineson J., Hardcastle M. J., 2018, @doi [MNRAS] 10.1093/mnras/sty274 , https://ui.adsabs.harvard.edu/abs/2018MNRAS.476.1614C 476, 1614
2018 doi
-
[18]
H., Hardcastle M
Croston J. H., Hardcastle M. J., Duncan K. J., R \"o ttgering H. J. A., 2025, , Submitted
2025
-
[19]
De Gazon G., Achong K.-M., Beltran Y., Morris M., Hooper E., Wilcots E., 2023, in American Astronomical Society Meeting Abstracts. p. 360.16
2023
-
[20]
B., et al., 2024, @doi [ ] 10.1093/mnras/stae2117 , https://ui.adsabs.harvard.edu/abs/2024MNRAS.534.1107D 534, 1107
Drake A. B., et al., 2024, @doi [ ] 10.1093/mnras/stae2117 , https://ui.adsabs.harvard.edu/abs/2024MNRAS.534.1107D 534, 1107
2024 doi
-
[21]
J., 2022, @doi [ ] 10.1093/mnras/stac608 , https://ui.adsabs.harvard.edu/abs/2022MNRAS.512.3662D 512, 3662
Duncan K. J., 2022, @doi [ ] 10.1093/mnras/stac608 , https://ui.adsabs.harvard.edu/abs/2022MNRAS.512.3662D 512, 3662
2022 doi
-
[22]
Duncan K., et al., 2014, @doi [ ] 10.1093/mnras/stu1622 , https://ui.adsabs.harvard.edu/abs/2014MNRAS.444.2960D 444, 2960
2014 doi
-
[23]
J., et al., 2019, @doi [ ] 10.1051/0004-6361/201833562 , https://ui.adsabs.harvard.edu/abs/2019A&A...622A...3D 622, A3
Duncan K. J., et al., 2019, @doi [ ] 10.1051/0004-6361/201833562 , https://ui.adsabs.harvard.edu/abs/2019A&A...622A...3D 622, A3
2019 doi
-
[24]
J., et al., 2021, @doi [A&A] 10.1051/0004-6361/202038809 , https://ui.adsabs.harvard.edu/abs/2021A&A...648A...4D 648, A4
Duncan K. J., et al., 2021, @doi [A&A] 10.1051/0004-6361/202038809 , https://ui.adsabs.harvard.edu/abs/2021A&A...648A...4D 648, A4
2021 doi
-
[25]
Edwards L. O. V., Fadda D., Frayer D. T., 2010, @doi [ApJ Letters] 10.1088/2041-8205/724/2/L143 , https://ui.adsabs.harvard.edu/abs/2010ApJ...724L.143E 724, L143
2010 doi
-
[26]
D., 1978, Astronomy and Astrophysics, https://ui.adsabs.harvard.edu/abs/1978A&A....69..253E 69, 253
Ekers R. D., 1978, Astronomy and Astrophysics, https://ui.adsabs.harvard.edu/abs/1978A&A....69..253E 69, 253
1978
-
[27]
L., Riley J
Fanaroff B. L., Riley J. M., 1974, @doi [MNRAS] 10.1093/mnras/167.1.31P , https://ui.adsabs.harvard.edu/abs/1974MNRAS.167P..31F 167, 31P
1974 doi
-
[28]
Freeland E., Wilcots E., 2011, @doi [ApJ] 10.1088/0004-637X/738/2/145 , https://ui.adsabs.harvard.edu/abs/2011ApJ...738..145F 738, 145
2011 doi
-
[29]
A., Best P
Gendre M. A., Best P. N., Wall J. V., 2010, @doi [ ] 10.1111/j.1365-2966.2010.16413.x , https://ui.adsabs.harvard.edu/abs/2010MNRAS.404.1719G 404, 1719
2010
-
[30]
A., Best P
Gendre M. A., Best P. N., Wall J. V., Ker L. M., 2013, @doi [MNRAS] 10.1093/mnras/stt116 , https://ui.adsabs.harvard.edu/abs/2013MNRAS.430.3086G 430, 3086
2013 doi
-
[31]
Golden-Marx E., et al., 2021, @doi [ApJ] 10.3847/1538-4357/abcd96 , https://ui.adsabs.harvard.edu/abs/2021ApJ...907...65G 907, 65
2021 doi
-
[32]
J., 2018, @doi [ ] 10.1093/mnras/stx3358 , https://ui.adsabs.harvard.edu/abs/2018MNRAS.475.2768H 475, 2768
Hardcastle M. J., 2018, @doi [ ] 10.1093/mnras/stx3358 , https://ui.adsabs.harvard.edu/abs/2018MNRAS.475.2768H 475, 2768
2018 doi
-
[33]
J., Croston J
Hardcastle M. J., Croston J. H., 2020, @doi [New Astronomy Reviews] 10.1016/j.newar.2020.101539 , https://ui.adsabs.harvard.edu/abs/2020NewAR..8801539H 88, 101539
2020
-
[34]
J., et al., 2023, @doi [A&A] 10.1051/0004-6361/202347333 , https://ui.adsabs.harvard.edu/abs/2023A&A...678A.151H 678, A151
Hardcastle M. J., et al., 2023, @doi [A&A] 10.1051/0004-6361/202347333 , https://ui.adsabs.harvard.edu/abs/2023A&A...678A.151H 678, A151
2023 doi
-
[35]
J., et al., 2025, @doi [ ] 10.1093/mnras/staf622 , https://ui.adsabs.harvard.edu/abs/2025MNRAS.539.1856H 539, 1856
Hardcastle M. J., et al., 2025, @doi [ ] 10.1093/mnras/staf622 , https://ui.adsabs.harvard.edu/abs/2025MNRAS.539.1856H 539, 1856
2025 doi
-
[36]
G., 2006, @doi [ ] 10.1111/j.1365-2966.2006.10808.x , https://ui.adsabs.harvard.edu/abs/2006MNRAS.371.1717H 371, 1717
Hubbard A., Blackman E. G., 2006, @doi [ ] 10.1111/j.1365-2966.2006.10808.x , https://ui.adsabs.harvard.edu/abs/2006MNRAS.371.1717H 371, 1717
2006
-
[37]
Jackson N., Rawlings S., 1997, @doi [MNRAS] 10.1093/mnras/286.1.241 , https://ui.adsabs.harvard.edu/abs/1997MNRAS.286..241J 286, 241
1997 doi
-
[38]
W., Owen F
Jones T. W., Owen F. N., 1979, @doi [ApJ] 10.1086/157561 , https://ui.adsabs.harvard.edu/abs/1979ApJ...234..818J 234, 818
1979 doi
-
[39]
Kauffmann G., et al., 2003, @doi [MNRAS] 10.1046/j.1365-8711.2003.06291.x , https://ui.adsabs.harvard.edu/abs/2003MNRAS.341...33K 341, 33
2003
-
[40]
T., Georganopoulos M., Reddy K., French O
Keenan M., Meyer E. T., Georganopoulos M., Reddy K., French O. J., 2021, @doi [MNRAS] 10.1093/mnras/stab1182 , https://ui.adsabs.harvard.edu/abs/2021MNRAS.505.4726K 505, 4726
2021 doi
-
[41]
Kim D.-W., Fabbiano G., 2013, @doi [ApJ] 10.1088/0004-637X/776/2/116 , https://ui.adsabs.harvard.edu/abs/2013ApJ...776..116K 776, 116
2013 doi
-
[42]
S., 1994, @doi [MNRAS] 10.1093/mnras/269.2.394 , https://ui.adsabs.harvard.edu/abs/1994MNRAS.269..394K 269, 394
Komissarov S. S., 1994, @doi [MNRAS] 10.1093/mnras/269.2.394 , https://ui.adsabs.harvard.edu/abs/1994MNRAS.269..394K 269, 394
1994 doi
-
[43]
J., Jamrozy M., Croston J
Konar C., Hardcastle M. J., Jamrozy M., Croston J. H., Nandi S., 2012, @doi [ ] 10.1111/j.1365-2966.2012.21279.x , https://ui.adsabs.harvard.edu/abs/2012MNRAS.424.1061K 424, 1061
2012
-
[44]
Kondapally R., et al., 2022, @doi [MNRAS] 10.1093/mnras/stac1128 , https://ui.adsabs.harvard.edu/abs/2022MNRAS.513.3742K 513, 3742
2022 doi
-
[45]
Konishi M., et al., 2011, @doi [ ] 10.1093/pasj/63.sp2.S363 , https://ui.adsabs.harvard.edu/abs/2011PASJ...63S.363K 63, S363
2011 doi
-
[46]
A., Bridle A
Laing R. A., Bridle A. H., 2002, @doi [ ] 10.1046/j.1365-8711.2002.05873.x , https://ui.adsabs.harvard.edu/abs/2002MNRAS.336.1161L 336, 1161
2002
-
[47]
J., Owen F
Ledlow M. J., Owen F. N., 1996, @doi [AJ] 10.1086/117985 , https://ui.adsabs.harvard.edu/abs/1996AJ....112....9L 112, 9
1996 doi
-
[48]
A., Richards G
Lin Y.-T., Shen Y., Strauss M. A., Richards G. T., Lunnan R., 2010, @doi [ApJ] 10.1088/0004-637x/723/2/1119 , 723, 1119–1138
2010 doi
-
[49]
H., Kasieczka G., Best P
Lukic V., Br \"u ggen M., Mingo B., Croston J. H., Kasieczka G., Best P. N., 2019, @doi [MNRAS] 10.1093/mnras/stz1289 , https://ui.adsabs.harvard.edu/abs/2019MNRAS.487.1729L 487, 1729
2019 doi
-
[50]
D., 1971, @doi [MNRAS] 10.1093/mnras/154.2.209 , https://ui.adsabs.harvard.edu/abs/1971MNRAS.154..209M 154, 209
Mackay C. D., 1971, @doi [MNRAS] 10.1093/mnras/154.2.209 , https://ui.adsabs.harvard.edu/abs/1971MNRAS.154..209M 154, 209
1971 doi
-
[51]
J., 1951, Journal of the American Statistical Association, 46, 68
Massey F. J., 1951, Journal of the American Statistical Association, 46, 68
1951
-
[52]
McInnes L., Healy J., Astels S., 2017, The Journal of Open Source Software, 2, 205
2017
-
[53]
McInnes L., Healy J., Melville J., 2020, UMAP: Uniform Manifold Approximation and Projection for Dimension Reduction ( @eprint arXiv 1802.03426 ), https://arxiv.org/abs/1802.03426
2020 arXiv
- [54]
-
[55]
Miley G., 1980, @doi [ARA&A] 10.1146/annurev.aa.18.090180.001121 , https://ui.adsabs.harvard.edu/abs/1980ARA&A..18..165M 18, 165
1980
-
[56]
Miley G., De Breuck C., 2008, @doi [The Astronomy and Astrophysics Review] 10.1007/s00159-007-0008-z , 15, 67–144
2008 doi
-
[57]
Mingo B., et al., 2019, @doi [MNRAS] 10.1093/mnras/stz1901 , https://ui.adsabs.harvard.edu/abs/2019MNRAS.488.2701M 488, 2701
2019 doi
-
[58]
Mingo B., et al., 2022, @doi [MNRAS] 10.1093/mnras/stac140 , https://ui.adsabs.harvard.edu/abs/2022MNRAS.511.3250M 511, 3250
2022 doi
-
[59]
E., Wilcots E., Hooper E., Heinz S., 2022, @doi [AJ] 10.3847/1538-3881/ac66db , https://ui.adsabs.harvard.edu/abs/2022AJ....163..280M 163, 280
Morris M. E., Wilcots E., Hooper E., Heinz S., 2022, @doi [AJ] 10.3847/1538-3881/ac66db , https://ui.adsabs.harvard.edu/abs/2022AJ....163..280M 163, 280
2022 doi
-
[60]
J., Miller J
Morsony B. J., Miller J. J., Heinz S., Freeland E., Wilcots E., Br \"u ggen M., Ruszkowski M., 2013, @doi [MNRAS] 10.1093/mnras/stt210 , https://ui.adsabs.harvard.edu/abs/2013MNRAS.431..781M 431, 781
2013 doi
-
[61]
Mostert R. I. J., et al., 2021, @doi [A&A] 10.1051/0004-6361/202038500 , https://ui.adsabs.harvard.edu/abs/2021A&A...645A..89M 645, A89
2021 doi
-
[62]
Nandi S., et al., 2019, @doi [ ] 10.1093/mnras/stz1184 , https://ui.adsabs.harvard.edu/abs/2019MNRAS.486.5158N 486, 5158
2019 doi
-
[63]
N., Norris R
O'Brien A. N., Norris R. P., Tothill N. F. H., Filipovi \'c M. D., 2018, @doi [MNRAS] 10.1093/mnras/sty2642 , https://ui.adsabs.harvard.edu/abs/2018MNRAS.481.5247O 481, 5247
2018 doi
-
[64]
P., Owen F
O'Dea C. P., Owen F. N., 1985, @doi [AJ] 10.1086/113802 , https://ui.adsabs.harvard.edu/abs/1985AJ.....90..954O 90, 954
1985 doi
-
[65]
N., Rudnick L., 1976a, @doi [ApJ] 10.1086/154080 , https://ui.adsabs.harvard.edu/abs/1976ApJ...203..307O 203, 307
Owen F. N., Rudnick L., 1976a, @doi [ApJ] 10.1086/154080 , https://ui.adsabs.harvard.edu/abs/1976ApJ...203..307O 203, 307
-
[66]
N., Rudnick L., 1976b, @doi [ApJ Letters] 10.1086/182077 , https://ui.adsabs.harvard.edu/abs/1976ApJ...205L...1O 205, L1
Owen F. N., Rudnick L., 1976b, @doi [ApJ Letters] 10.1086/182077 , https://ui.adsabs.harvard.edu/abs/1976ApJ...205L...1O 205, L1
-
[67]
Perucho M., 2020, @doi [ ] 10.1093/mnrasl/slaa031 , https://ui.adsabs.harvard.edu/abs/2020MNRAS.494L..22P 494, L22
2020 doi
-
[68]
M., Laing R
Perucho M., Mart \' J. M., Laing R. A., Hardee P. E., 2014, @doi [ ] 10.1093/mnras/stu676 , https://ui.adsabs.harvard.edu/abs/2014MNRAS.441.1488P 441, 1488
2014 doi
-
[69]
N., 1976, @doi [ApJ] 10.1086/182030 , https://ui.adsabs.harvard.edu/abs/1976ApJ...203L.107R 203, L107
Rudnick L., Owen F. N., 1976, @doi [ApJ] 10.1086/182030 , https://ui.adsabs.harvard.edu/abs/1976ApJ...203L.107R 203, L107
1976 doi
-
[70]
Salim S., et al., 2007, @doi [ApJS] 10.1086/519218 , https://ui.adsabs.harvard.edu/abs/2007ApJS..173..267S 173, 267
2007 doi
-
[71]
W., Stephens M
Scholz F. W., Stephens M. A., 1987, Journal of the American Statistical Association, 82, 918
1987
-
[72]
W., et al., 2022, @doi [A&A] 10.1051/0004-6361/202142484 , https://ui.adsabs.harvard.edu/abs/2022A&A...659A...1S 659, A1
Shimwell T. W., et al., 2022, @doi [A&A] 10.1051/0004-6361/202142484 , https://ui.adsabs.harvard.edu/abs/2022A&A...659A...1S 659, A1
2022 doi
-
[73]
Tasse C., et al., 2021, @doi [A&A] 10.1051/0004-6361/202038804 , https://ui.adsabs.harvard.edu/abs/2021A&A...648A...1T 648, A1
2021 doi
-
[74]
Tchekhovskoy A., Bromberg O., 2016, @doi [MNRAS] 10.1093/mnrasl/slw064 , https://ui.adsabs.harvard.edu/abs/2016MNRAS.461L..46T 461, L46
2016 doi
-
[75]
A., et al., 2004, @doi [ApJ] 10.1086/423264 , https://ui.adsabs.harvard.edu/abs/2004ApJ...613..898T 613, 898
Tremonti C. A., et al., 2004, @doi [ApJ] 10.1086/423264 , https://ui.adsabs.harvard.edu/abs/2004ApJ...613..898T 613, 898
2004 doi
-
[76]
L., et al., 2019, @doi [A&A] 10.1051/0004-6361/201833564 , https://ui.adsabs.harvard.edu/abs/2019A&A...622A...2W 622, A2
Williams W. L., et al., 2019, @doi [A&A] 10.1051/0004-6361/201833564 , https://ui.adsabs.harvard.edu/abs/2019A&A...622A...2W 622, A2
2019 doi
-
[77]
D., Blanton E
Wing J. D., Blanton E. L., 2011, @doi [AJ] 10.1088/0004-6256/141/3/88 , https://ui.adsabs.harvard.edu/abs/2011AJ....141...88W 141, 88
2011 doi
-
[78]
J., Karakas A
Wykes S., Hardcastle M. J., Karakas A. I., Vink J. S., 2015, @doi [MNRAS] 10.1093/mnras/stu2440 , https://ui.adsabs.harvard.edu/abs/2015MNRAS.447.1001W 447, 1001
2015 doi
-
[79]
Ye H., et al., 2024, @doi [ ] 10.1051/0004-6361/202348103 , https://ui.adsabs.harvard.edu/abs/2024A&A...691A.347Y 691, A347
2024 doi
-
[80]
de Jong J. M. G. H. J., et al., 2024a, @doi [ ] 10.1051/0004-6361/202347131 , https://ui.adsabs.harvard.edu/abs/2024A&A...683A..23D 683, A23
-
[81]
de Jong J. M. G. H. J., et al., 2024b, @doi [ ] 10.1051/0004-6361/202450595 , https://ui.adsabs.harvard.edu/abs/2024A&A...689A..80D 689, A80
Reviewed August 7, 2026 · model on record in the stance chip above.
Discussion (0). Sign in to comment.