REVIEW 4 major objections 5 minor 30 references
From Fads to Classics -- Analyzing Video Game Trend Evolutions through Steam Tags
T0 review · 4 major / 5 minor · reviewed 2026-08-07 · deepseek-v4-flash
Pith's one-line read Steam tag data indicates a typical video-game feature trend rises for about four years before fading.
desk verdict The four-year trend duration claim rests on a null model that removes the metric's own autocorrelation; the paper itself is a solid descriptive study that needs major revision. read the letter →
The pith
A machine-rendered reading of the paper's core claim, the machinery that carries it, and where it could break.
The reading
What carries the argument
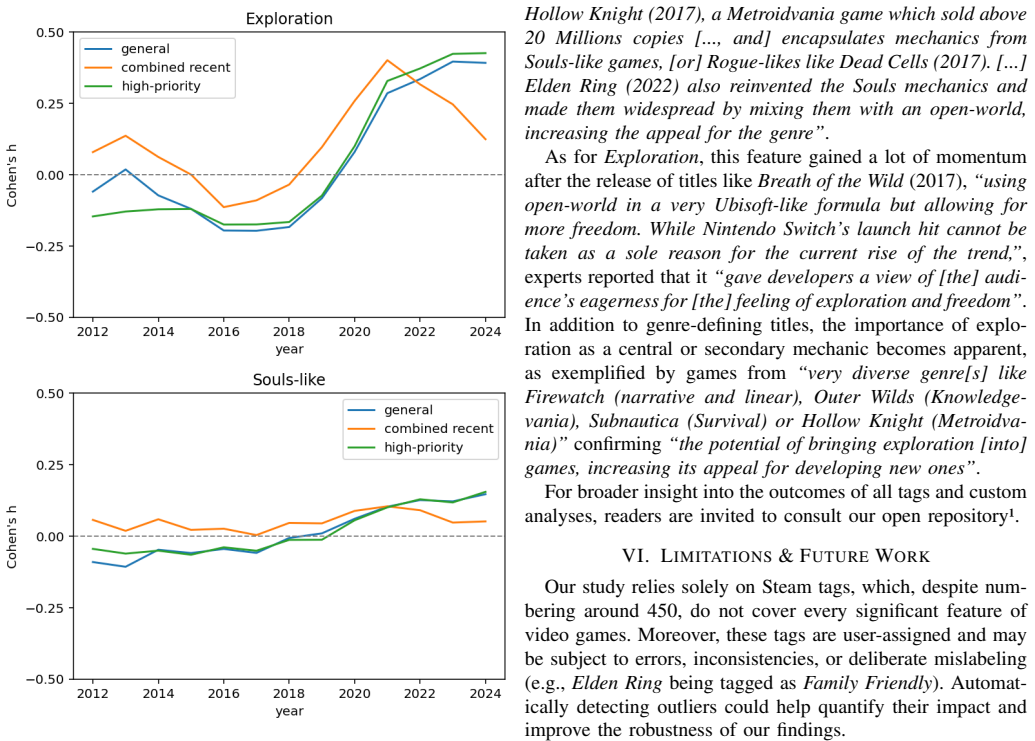
The central mechanism is the combined recent trend score, $f_c(T,Y_i)=0.82f_r(T,Y_i)+0.57f^h_r(T,Y_i)$, built as a weighted sum after a sparse PCA on four related curves. Each ingredient is a Cohen's h comparison of a yearly proportion with a benchmark: for two proportions $p_1$ and $p_2$, Cohen's h is $\phi(p_1)-\phi(p_2)$ with $\phi(p)=2\arcsin(\sqrt{p})$, so a difference only counts as a trend if the current proportion is itself large. The recent scores compare the current year with the average of the previous five years; the high-priority variant uses only games where the tag is essential. Trend-increase periods are consecutive years in which this combined score stays positive, and the four-year claim comes from comparing the histogram of the longest such periods with an independent-sampling null.
What would settle it
Build a null distribution for the longest positive-run histogram by resampling the combined recent trend score with a method that preserves its year-to-year dependence (for example, fitting a simple autoregressive model or using block bootstrap); if the second mode at four years still appears in that null, the paper's inference that the mode reflects real four-year trend cycles would not be supported.
Extended reading notes
Core claim
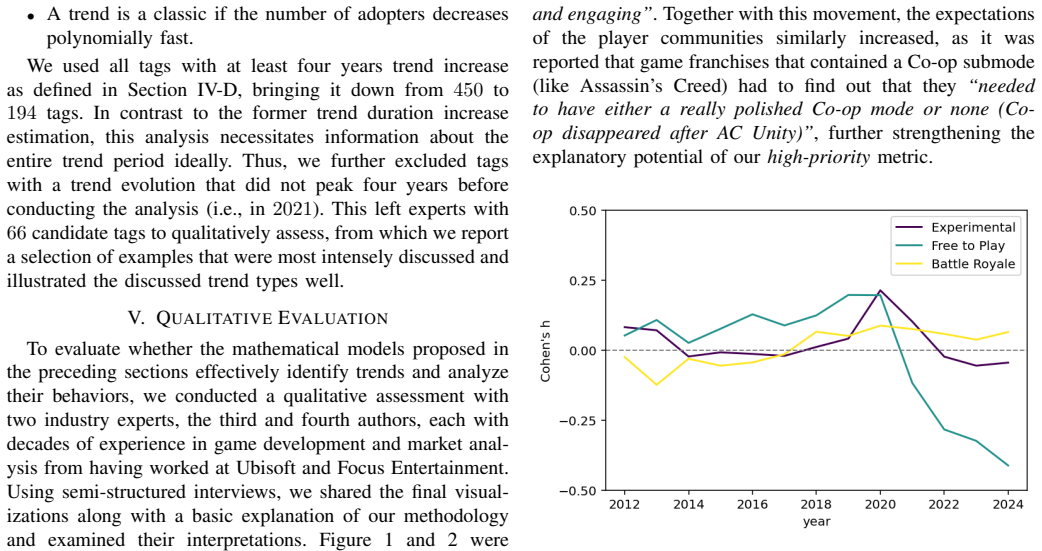
The paper's central discovery is that the rise phase of a video-game tag trend typically lasts about four years. This is inferred from the histogram of the longest consecutive runs in which the combined recent trend score remains positive: the observed histogram shows a mode at two years and a second mode at four years, while the histogram built from independently sampled score values shows only the first mode. The paper attributes this extra four-year mode to genuine trend effects. It also claims that the same measurements reproduce the conceptual division of trends into fads, fashions, and classics, and it presents expert-validated examples: Experimental as a fad, Free to Play as a fashion, and Battle Royale as a classic. The analysis is explicitly a supply-side view, tracking the features of released games rather than player purchases or playtime.
Load-bearing premise
The four-year claim stands on the assumption that the extra mode in the duration histogram comes from real trend effects rather than from the way the score is built, specifically from comparing each year with the average of the previous five years, which makes consecutive yearly values depend on one another.
Editorial extensions
If this is right
- If the four-year rise is typical, a development cycle of three to five years means a project started at a trend's onset can release at or after its peak, so trend-following is a risky strategy.
- The fad/fashion/classic split gives a vocabulary and a visual method for separating short spikes from durable genre shifts, useful to publishers and investors.
- Proportion-based scores protect the analysis from the steady growth in total yearly releases, so a tag's rise is measured relative to the market rather than in raw counts.
- Because the pipeline is published with source code, other researchers can apply the same score construction to any Steam tag or to other tagged media catalogs.
Reading between the lines
- The authors leave implicit that their null model may be too lenient: because the combined score compares each year with a trailing five-year average, consecutive values are dependent by construction, and an independent-sampling null removes that dependence rather than 'trend effects.'
- We infer that a demand-side replication, tracking playtime or sales instead of releases, could produce trend lifespans that differ from four years, since supply follows investment cycles while demand reacts to player behavior.
- A calibration experiment the paper does not run is to generate synthetic tag series with known trend durations and pass them through the same pipeline; the share of the four-year mode that survives in synthetic data would reveal how much of the estimate is metric-driven.
Editorial analysis
A structured set of objections, weighed in public.
Referee Report
Summary. The paper proposes a data-driven framework for analyzing the evolution of Steam game tags as a proxy for video game trends. It defines four trend scores (general, recent, high-priority, high-priority recent), combines the two recent scores via sparse PCA into a combined recent trend score, and uses these to classify trends as fads, fashions, or classics following Bae et al. The central quantitative claim, addressing RQ3, is that the surge of a trend typically lasts about four years, based on a comparison of observed maximum positive-run lengths of the combined recent trend score against a null model of independent sampling. The paper also includes qualitative interpretations of selected tag curves by two industry experts and provides open-source code.
Significance. If the four-year trend-increase duration held up, it would be a practically useful quantitative benchmark for game developers and publishers, and the paper would provide a credible supply-side replication of the fad/fashion/classic taxonomy. The paper is also commendable for releasing its analysis code and for grounding its interpretations in concrete, domain-specific examples. However, the central quantitative result is not supported by the analysis as presented: the null model destroys the autocorrelation that the metric itself builds in, and the abstract overstates what the histogram shows. The qualitative evaluation, while rich, cannot substitute for a valid statistical inference.
major comments (4)
- [Section IV-D, Definitions 2 and 4] The independent-sampling null model is inappropriate for the metric it is meant to test. The recent trend score f_r(T,Y_i) compares p_i to a trailing five-year average p_r(i) that includes p_i, so even if the underlying proportions p_i were white noise, the signs of f_r(T,Y_i) (and therefore of f_c = 0.82 f_r + 0.57 f_hr) are autocorrelated by construction. The stated rationale, that in the absence of trend effects the f_c values would be independently distributed, is false. Therefore the second mode at four years in the blue histogram of Figure 3 cannot be attributed to 'trend effects' unless the null model reproduces the overlapping-window dependence of the metric. This invalidates the main RQ3 conclusion as stated.
- [Abstract and Section IV-D / Section VII] The abstract claims that 'the surge of a trend averages at about four years,' and the conclusion says trends 'typically last about four years,' but Section IV-D identifies a second mode at four years in a histogram of maximum positive runs, not an average duration. Moreover, the histogram is over only 9 years per tag (K=13 with f_c defined for i=5,...,13), so a mode at four years is not evidence about a typical trend duration. The claims in the abstract and conclusion should be rephrased to match exactly what the analysis shows, or the analysis should be extended to estimate a duration distribution.
- [Section V] The 'industrial experts' who validate the findings are the third and fourth authors of the paper, and the selection of example tags was made by the authors themselves. This is not an independent external validation, and the abstract's phrasing 'After using industrial experts to validate our findings' overstates the evidentiary value. Please either recruit independent experts or clearly present this as authors' domain-expert interpretation rather than validation.
- [Sections IV-A, IV-B, IV-E] The four-year result depends on several hand-tuned choices with no sensitivity analysis: the five-year recent window (Definition 2), the 0.6 high-priority threshold, the sparse PCA weights (0.82 and 0.57), the start year 2012, and the use of 'at least four years trend increase' as the inclusion criterion for the fad/fashion/classic classification. Because the combined recent trend score f_c is the basis for the duration analysis, the paper should demonstrate that the four-year mode is robust to these choices, or at least discuss how each parameter affects the result.
minor comments (5)
- [Abstract] The phrase 'short-livedfads' is missing a space and should read 'short-lived fads.'
- [Section IV-E] The sentence 'we still intent on following' should be 'we still intend to follow.'
- [Section V] The phrase 'last four approximately four years' has a word-order error and should read 'last approximately four years.'
- [Section IV-D] The parenthetical 'which may be zero if the recent trend score is negative for all years' should refer to the combined recent trend score f_c, not the recent trend score f_r.
- [Figure 1] The line styles in Figure 1 are denoted only by dashes; please add a legend or explicit labels so the curves corresponding to general, recent, high-priority, and high-priority recent trend scores can be distinguished.
Circularity Check
The four-year trend-duration claim is generated by a null model that discards the autocorrelation built into f_c; the attributed 'trend effect' is a construction artifact.
-
self definitional
[Section IV-D (with Definition 2 and Section IV-B combined recent trend score)]
"We define trend increase periods as consecutive years in which the combined recent trend score remains positive. ... Conversely, in the absence of trend effects, the values f_c(T, Yi) for a given tag across different years would be independently distributed. ... only the histogram derived from actual data, shown in blue, displays a second peak at four years. As discussed above, this second mode results from trend effects, supporting our claim that trends typically last around four years."
The 'no trend effects' baseline is defined as independent draws of f_c, but f_c is built as 0.82 f_r + 0.57 f_hr, where f_r(T,Y_i) is Cohen's h of p_i against p_r(i), the average of p_{i-5} through p_i. Therefore f_r(i) and f_r(i+1) share five of six underlying proportions, making consecutive f_c values autocorrelated by construction even if tag proportions were white noise. The paper labels this built-in dependency 'trend effects' and attributes the extra four-year mode to it, but the separation between the blue histogram and the independent-sampling null is exactly the dependency already inserted by the moving-window definition. The four-year duration claim thus reduces to the metric's own construction rather than to an independently established trend cycle.
full rationale
The central quantitative claim, that 'the surge of a trend averages at about four years,' rests entirely on Section IV-D's comparison between the observed distribution of longest positive runs of f_c and an independent-sampling null. That null is not a valid no-trend baseline: because f_r and f_hr compare each p_i to a trailing five-year average that includes p_i, consecutive f_c values are necessarily autocorrelated by construction. The independent-sampling null removes exactly this autocorrelation, so the observed second mode at four years cannot be attributed to 'trend effects' without a null that reproduces the overlapping-window dependence. The paper itself acknowledges the dependency and calls it 'trend effects,' which makes the reasoning circular: the effect being 'discovered' is already present in the definition of the score. Other elements, such as the priority notion cited from the authors' prior work, the hand-chosen 5-year window, the 0.6 priority threshold, and the PCA weights fitted to the same data, weaken the claim's independence but are not themselves the main circular step. Because the paper's headline prediction is an artifact of the metric's own moving-window construction, the circularity score is 6.
Assumptions & free parameters
free parameters (6)
- Recent window size =
5 years
- High-priority threshold =
0.6
- Sparse PCA weights for combined recent trend score =
0.82 and 0.57
- Start year =
2012
- Minimum trend increase length for classification =
4 years
- Peak cutoff year =
2021
assumptions (6)
- domain assumption Steam tags are user-assigned but reliably describe important game features and genres
- domain assumption The proportion of released games carrying a tag is a meaningful supply-side measure of trends
- domain assumption Retroactive tagging does not systematically distort historical trend curves
- domain assumption A game either has a tag or does not, and live-service or DLC updates do not change its tag status
- ad hoc to paper Independent sampling of the combined recent trend score is a valid null model for the absence of trend effects
- ad hoc to paper Qualitative judgments by two industry experts are valid external validation
Cite this review
Pith. "Pith review of From Fads to Classics -- Analyzing Video Game Trend Evolutions through Steam Tags." pith.science (2026). https://pith.science/paper/GBAXPDWP
@misc{pith2026250608881,
  author       = {Pith},
  title        = {Pith review of: From Fads to Classics -- Analyzing Video Game Trend Evolutions through Steam Tags},
  year         = {2026},
  howpublished = {\url{https://pith.science/paper/GBAXPDWP}},
  note         = {Machine review of arXiv:2506.08881}
}
read the original abstract
The video game industry deals with a fast-paced, competitive and almost unpredictable market. Trends of genres, settings and modalities change on a perpetual basis, studios are often one big hit or miss away from surviving or perishing, and hitting the pulse of the time has become one of the greatest challenges for industrials, investors and other stakeholders. In this work, we aim to support the understanding of video game trends over time based on data-driven analysis, visualization and interpretation of Steam tag evolutions. We confirm underlying groundwork that trends can be categorized in short-lived fads, contemporary fashions, or stable classics, and derived that the surge of a trend averages at about four years in the realm of video games. After using industrial experts to validate our findings, we deliver visualizations, insights and an open approach of deciphering shifts in video game trends.
Figures


Figures from the paper (1 more)
Reference graph
Works this paper leans on
-
[1]
Mathematical modeling of trend cycle: Fad, fashion and classic,
H.-O. Bae, S. Y . Cho, J. Yoo, and S.-B. Yun, “Mathematical modeling of trend cycle: Fad, fashion and classic,”Physica D: Nonlinear Phenomena, vol. 472, p. 134500, 2025
work page 2025
-
[2]
Video game genre, evolution and innovation,
D. Arsenault, “Video game genre, evolution and innovation,”Eludamos: Journal for computer game culture, vol. 3, no. 2, pp. 149–176, 2009
work page 2009
-
[3]
Recent trends in the por- tuguese video game industry: 2016–2020,
F. Nunes, P. Santos, P. Romeiro, and C. Pinto, “Recent trends in the por- tuguese video game industry: 2016–2020,” inInternational Conference on Videogame Sciences and Arts. Springer, 2020, pp. 15–32
work page 2016
-
[4]
Our princess is in another castle: A review of trends in serious gaming for education,
M. F. Young, S. Slota, A. B. Cutter, G. Jalette, G. Mullin, B. Lai, Z. Simeoni, M. Tran, and M. Yukhymenko, “Our princess is in another castle: A review of trends in serious gaming for education,”Review of educational research, vol. 82, no. 1, pp. 61–89, 2012
work page 2012
-
[5]
B. Stetina, A. Klaps, Z. Kovacovsky, and J. Aden, “Is this the end of the (fantasy) world as we know it? multiplayer online battle arenas (mobas) versus massively multiplayer online role playing games (mmorpgs).” 11 2016
work page 2016
-
[6]
Electric retrospective – playtime’s over: The rise and fall of toys to life,
WGEcho, “Electric retrospective – playtime’s over: The rise and fall of toys to life,” 2017, accessed: 2025-03-06. [Online]. Available: https://wgecho.org/2017/10/25/ electric-retrospective-playtimes-over-the-rise-and-fall-of-toys-to-life/
work page 2017
-
[7]
Why we hate (some) video game motion controls,
J. Harris, “Why we hate (some) video game motion controls,” Psychology Today, 2015, accessed: 2025-03-06. [Online]. Avail- able: https://www.psychologytoday.com/us/blog/mind-games/201506/ why-we-hate-some-video-game-motion-controls
work page 2015
-
[8]
The case for dynamic difficulty adjustment in games,
R. Hunicke, “The case for dynamic difficulty adjustment in games,” inProceedings of the 2005 ACM SIGCHI International Conference on Advances in computer entertainment technology, 2005, pp. 429–433
work page 2005
Show all 30 references
-
[9]
Squire,Open-ended video games: A model for developing learning for the interactive age
K. Squire,Open-ended video games: A model for developing learning for the interactive age. MacArthur Foundation Digital Media and Learning Initiative, 2007
2007
-
[10]
Designing for disability: Evaluating the state of accessibility design in video games,
M. Brown and S. L. Anderson, “Designing for disability: Evaluating the state of accessibility design in video games,”Games and Culture, vol. 16, no. 6, pp. 702–718, 2021
2021
-
[11]
Is it a sense of autonomy, control, or attachment? exploring the effects of in-game customization on game enjoyment,
K. Kim, M. G. Schmierbach, M.-Y . Chung, J. D. Fraustino, F. Dardis, L. Ahernet al., “Is it a sense of autonomy, control, or attachment? exploring the effects of in-game customization on game enjoyment,” Computers in Human Behavior, vol. 48, pp. 695–705, 2015
2015
-
[12]
Full steam ahead: A conceptual analysis of user-supplied tags on steam,
T. W. Windleharth, J. Jett, M. Schmalz, and J. H. Lee, “Full steam ahead: A conceptual analysis of user-supplied tags on steam,”Cataloging & Classification Quarterly, vol. 54, no. 7, pp. 418–441, 2016
2016
-
[13]
A preliminary network analysis on steam game tags: another way of understanding game genres,
X. Li and B. Zhang, “A preliminary network analysis on steam game tags: another way of understanding game genres,” inProceedings of the 23rd International Conference on Academic Mindtrek, 2020, pp. 65–73
2020
-
[14]
A data-driven classification of video game vocabulary,
N. Grelier and S. Kaufmann, “A data-driven classification of video game vocabulary,” inInternational Conference on Entertainment Computing. Springer, 2023, pp. 17–30
2023
-
[15]
(2025) Steam game releases by year
SteamDB. (2025) Steam game releases by year. [Online]. Available: https://steamdb.info/stats/releases/
2025
-
[16]
PC & console gaming report 2024,
Newzoo, “PC & console gaming report 2024,” Tech. Rep., 2024
2024
-
[17]
An empirical study of early access games on the steam platform,
D. Lin, C.-P. Bezemer, and A. E. Hassan, “An empirical study of early access games on the steam platform,”Empirical Software Engineering, vol. 23, pp. 771–799, 2018
2018
-
[18]
The panorama of steam multiplayer games (2018-2020): A player reviews analysis,
S. Petrosino, E. Loria, A. Kainz, and J. Pirker, “The panorama of steam multiplayer games (2018-2020): A player reviews analysis,” in Proceedings of the 17th International Conference on the Foundations of Digital Games, 2022, pp. 1–7
2018
-
[19]
Virtual reality and education–the steam panorama,
J. Pirker, E. Loria, A. Kainz, J. Kopf, and A. Dengel, “Virtual reality and education–the steam panorama,” inProceedings of the 17th International Conference on the Foundations of Digital Games, 2022, pp. 1–11
2022
-
[20]
Towards factor-oriented understanding of video game genres using exploratory factor analysis on steam game tags,
X. Li, “Towards factor-oriented understanding of video game genres using exploratory factor analysis on steam game tags,” in2020 IEEE international conference on Progress in informatics and computing (PIC). IEEE, 2020, pp. 207–213
2020
-
[21]
Automated clustering of video games into groups with distinctive names,
N. Grelier and S. Kaufmann, “Automated clustering of video games into groups with distinctive names,” inInternational Conference on Entertainment Computing. Springer, 2024, pp. 223–231
2024
-
[22]
Success factors of game products by using a diffusion model and cluster analysis,
S. Song, N.-W. Cho, and T. Kim, “Success factors of game products by using a diffusion model and cluster analysis,”Journal of Korean Institute of Industrial Engineers, vol. 42, no. 3, pp. 222–230, 2016
2016
-
[23]
Predicting success factors of video game titles and companies,
J. Pfau, M. Debus, J. Juul, E. Lundedal Hammar, A. Canossa, and M. Seif El-Nasr, “Predicting success factors of video game titles and companies,” inInternational Conference on Entertainment Computing. Springer, 2022, pp. 269–282
2022
-
[24]
From teams to games: Connecting game development to game characteristics,
E. Lundedal Hammar, A. Canossa, M. S. Debus, J. Pfau, M. Seif El- Nasr, J. Juul, and A. Azadvar, “From teams to games: Connecting game development to game characteristics,” inInternational Conference on Human-Computer Interaction. Springer, 2023, pp. 336–340
2023
-
[25]
Flawless victory! investi- gating search and experience qualities as antecedent predictors of video game success,
S. Heidenreich, F. Handrich, and T. Kraemer, “Flawless victory! investi- gating search and experience qualities as antecedent predictors of video game success,”Electronic Markets, vol. 33, no. 1, p. 20, 2023
2023
-
[26]
Sparse principal component analysis,
H. Zou, T. Hastie, and R. Tibshirani, “Sparse principal component analysis,”Journal of computational and graphical statistics, vol. 15, no. 2, pp. 265–286, 2006
2006
-
[27]
Cohen,Statistical power analysis for the behavioral sciences
J. Cohen,Statistical power analysis for the behavioral sciences. rout- ledge, 2013
2013
-
[28]
Schell,The Art of Game Design: A Book of Lenses, 2nd ed
J. Schell,The Art of Game Design: A Book of Lenses, 2nd ed. Boca Raton, FL: CRC Press, 2014
2014
-
[29]
Dix and P
J. Dix and P. Wright,Game Development Essentials: An Introduction. Boston, MA: Delmar Cengage Learning, 2007
2007
-
[30]
Principal component analysis: a review and recent developments,
I. T. Jolliffe and J. Cadima, “Principal component analysis: a review and recent developments,”Philosophical transactions of the royal society A: Mathematical, Physical and Engineering Sciences, vol. 374, no. 2065, p. 20150202, 2016
2016
Reviewed August 7, 2026 · model on record in the stance chip above.
Discussion (0). Sign in to comment.