REVIEW 6 major objections 6 minor 28 references
Fragility in Average Treatment Effect on the Treated under Limited Covariate Support
T0 review · 6 major / 6 minor · reviewed 2026-08-07 · deepseek-v4-flash
Pith's one-line read The paper proves that the average treatment effect on the treated is not identified when covariate overlap is partial and sampling is unrestricted, then quantifies the minimum assumption strength needed to sign the effect.
desk verdict The paper's diagnostic machinery never gets connected to the theory, and its headline empirical claim is contradicted by its own Figure 1; not ready for peer review. read the letter →
The pith
A machine-rendered reading of the paper's core claim, the machinery that carries it, and where it could break.
The reading
What carries the argument
The central object is the selection frontier $S(P^{obs})$ and the curvature-indexed family $S_\delta$ of sampling mechanisms whose log-probability of selection can vary by at most $\delta$ across outcome values. This family nests missing-at-random selection at $\delta=0$ and unbounded outcome-dependent selection as $\delta\to\infty$. The argument is carried by the identified set $I_\tau(\delta)$--the set of ATT values compatible with the observed distribution and with a mechanism in $S_\delta$--together with the two diagnostics $\delta^* = \inf\{\delta: 0\notin I_\tau(\delta)\}$ (MAS-SI) and the decision-level fragility index $\delta_{frag}(d)$. These objects convert the non-identification theorem into a computable trade-off: increasing $\delta$ widens the identified set monotonically, and the smallest $\delta$ at which the sign is forced is the paper's measure of epistemic fragility.
What would settle it
A direct computation of $I_\tau(\delta)$ for the LaLonde covariates--optimizing over selection mechanisms that satisfy the curvature bound $S_\delta$ instead of using propensity-score trimming as a proxy--would settle the empirical claim: if zero leaves the interval at some small positive $\delta$, the reported fragility index $\delta_{frag}=0$ is an artifact of the trimming approximation.
Extended reading notes
Core claim
The paper's core claim is that the average treatment effect on the treated, $\tau_{ATT} = E[Y(1)-Y(0)|D=1]$, is not identified from the observed distribution $P^{obs}(X,D,Y|S=1)$ once the sampling mechanism $S$ is left unrestricted; two data-generating processes can produce the same observed data yet different values of $\tau_{ATT}$. Identification therefore requires both unconfoundedness and an overlap condition: for every treated covariate profile there must exist comparable untreated units, and selection into the sample must not depend on untreated potential outcomes. Where overlap fails, the estimand is undefined even though estimators keep producing numbers. The paper defines the empirical support region $\mathcal{X}^*$ and shows in the LaLonde data that only 37 of 72 age-by-education strata contain both treated and control units, so the ATT is undefined on a large part of the treated distribution. It then introduces curvature-indexed identified sets and two diagnostics--MAS-SI and the fragility index--to measure how much assumption strength is needed to force a conclusion, and reports that the negative LaLonde ATT loses sign identification under arbitrarily small deviations from ignorability.
Load-bearing premise
The empirical fragility numbers rest on treating propensity-score trimming as the operational realization of the formal curvature classes $S_\delta$; the paper asserts this equivalence rather than deriving it, so the LaLonde diagnostics are only as strong as that link.
Editorial extensions
If this is right
- Applied studies should first map the empirical support region $\mathcal{X}^*$ and report ATT estimates only on that region, since outside it the estimand is undefined.
- Stability of point estimates across matching designs does not by itself indicate robustness; in the LaLonde analysis the numerical agreement across samples reflects shared support constraints rather than global identification.
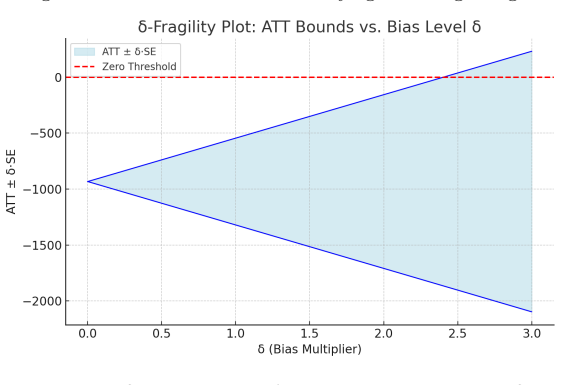
- In the LaLonde data the negative ATT conclusion is fragile: the identified set contains only negative values at $\delta=0$ (MAR), but arbitrarily small departures from ignorability produce sign indeterminacy ($\delta^*=0$, $\delta_{frag}=0$).
- Trimming rules and overlap weights reduce variance and bias under overlap, but they do not restore identification outside $\mathcal{X}^*$; they should be understood as support restrictions, not fixes for overlap failure.
Reading between the lines
- Extending the paper's logic, the same curvature-indexed machinery should transfer to other support-limited estimands such as the effect on the untreated or the local average treatment effect, since the non-identification mechanism depends on shared support and unobserved sampling rather than on the specific estimand.
- The choice of covariate discretization is itself consequential, because coarser or finer partitions change $\mathcal{X}^*$; a practical extension would report fragility indices over a range of partition resolutions, something the paper's 72-cell and 42-cell grids only begin to explore.
- In panel or administrative data with observable attrition, the curvature parameter $\delta$ could be estimated directly from nonresponse patterns, allowing threshold values such as $\delta^*\approx1.2$ in the LaLonde reanalysis to be calibrated against real selection mechanisms.
Editorial analysis
A structured set of objections, weighed in public.
Referee Report
Summary. The paper argues that the average treatment effect on the treated (ATT) is not identified from the observed distribution P_obs = P(X,D,Y|S=1) when the sampling mechanism S is unrestricted, and that standard overlap diagnostics are insufficient. It introduces a 'selection frontier' S(P_obs), a curvature-constrained class of sampling mechanisms S_δ, and a family of identified sets I_τ(δ). Two diagnostics are proposed: MAS-SI (the minimum δ at which the sign of the ATT is identified) and a fragility index δ_frag. The framework is applied to the LaLonde (1986) data, where the author claims that nearly half of the treated strata lack empirical support, and to a simulation with outcome-dependent selection. The central theoretical results are Theorems 2.2.1, 3.5.1, 3.6.1, and 3.8.1, with empirical implementation in Sections 3.10 and 4.2.
Significance. If the framework were valid, indexing identified sets by curvature of the sampling mechanism and reporting MAS-SI/fragility diagnostics would be a useful contribution to sensitivity analysis under limited overlap. The paper also provides replication code in a public repository, which is a strength. However, the significance is severely limited by load-bearing gaps: the claimed collapse to {τ_MAR} at δ=0 is not established, the empirical 'identified sets' are never derived from the theoretical S_δ, and the abstract's headline empirical claim about treated strata lacking support is contradicted by the paper's own Figure 1 counts. These issues mean the central diagnostic objects are not credible as stated.
major comments (6)
- [§3.6, Theorem 3.6.1] The claim that I_τ(0) collapses to {τ_MAR} is not justified. Definition 3.4.2 restricts only the sampling mechanism S to be independent of Y given D and X when δ=0 (MAR for sampling). It does not impose unconfoundedness of treatment assignment, (Y(1),Y(0))⊥D|X, nor does it impose overlap. Without those additional conditions, E[Y(0)|D=1] is not identified from observed controls, so I_τ(0) is not a singleton. The proof in the appendix implicitly adds treatment ignorability when it says 'computed under MAR'. This error propagates to Definition 3.7.1 and to the empirical statement in Section 4.2 that at δ=0 the ATT interval lies entirely below zero and the sign is point-identified.
- [§3.10 and §4.2] The empirical and simulation 'identified sets' are not derived from the theoretical class S_δ. In Section 3.10, I_τ(δ) is constructed by placing a fixed radius ε=0.3 around the observed ATE; in Section 4.2, ATT bounds indexed by δ are generated by trimming on estimated propensity scores. Neither operation corresponds to optimizing over sampling mechanisms in S_δ as defined in Definition 3.4.2. Propensity-score trimming changes the conditioning event and the target population, and no mapping from trimming thresholds to the curvature bound δ is given. Consequently, the reported MAS-SI values and fragility index in Figures 4–9 do not estimate the theoretical quantities defined in Section 3.
- [Abstract and §4.1, Figure 1] The claim that 'nearly half the treated strata lack empirical support' is contradicted by the paper's own counts. Figure 1 reports 72 strata: 37 contain both treated and control units, 27 contain only controls, 1 contains only treated units, and 7 are empty. There are 38 treated-containing strata, of which only 1 (about 2.6%) lacks controls. The 'nearly half' figure appears to count cells without treated units, not treated strata lacking support. This invalidates a central empirical conclusion stated in the abstract and reiterated in Section 4.1.
- [§4.2] The paper reports contradictory diagnostic values for the same empirical application. It states that 'the MAS-SI value is δ*=0, and the fragility index is δ_frag=0', and later states that 'the estimated value δ*=2.5 implies that ATT remains negative under modest symmetric bias but loses sign identification beyond this point.' These cannot both be the MAS-SI for the same estimand without additional explanation of how they are defined on different scales or under different perturbations. As written, this is an internal inconsistency in the main applied results.
- [§3.2 and Theorem 3.8.1] The selection frontier S(P_obs) is defined as the set of sampling mechanisms S for which there exists a full distribution P with P(Y,D,X|S=1)=P_obs. For any S with positive selection probability on the support of P_obs, one can construct such a P, for example by setting P(y,d,x) ∝ P_obs(y,d,x)/P(S=1|y,d,x). Hence S(P_obs) is essentially unrestricted, and the statement that a mechanism 'outside' the frontier is falsified by the data is vacuous. Theorem 3.8.1 is a tautology following from the definition rather than a substantive validity result.
- [Appendix, proof of Theorem 2.2.1] The proof of the main non-identification theorem does not actually construct two data-generating processes that induce the same observed distribution P_obs. DGP2 specifies P(S=1|Y(0))=1{Y(0)>c} but does not specify the full joint distribution of (Y(1),Y(0),D,X,S) or verify that conditioning on S=1 yields exactly P_obs. Without this verification, the two DGPs need not have identical observed distributions. The theorem itself is a standard and essentially correct non-identification result, but the proof as written is incomplete.
minor comments (6)
- [§5] The conclusion states that 'Theorem 3.5.1 shows that δ* is point-identified from the observed distribution P_obs', but Theorem 3.5.1 only establishes monotonicity of identified sets and contains no point-identification result for δ*.
- [§5] The conclusion repeatedly refers to 'Theorem 4' and 'Appendix C', but the manuscript contains no Theorem 4 and no Appendix C. Claims such as 'width(I_τ(δ)) grows as O(√T)' and 'δ_frag ≥ log(1+∥X∥_ψ2)' are asserted without derivation or location.
- [§5] There is a typo: 'presens a bound' should be 'presents a bound'.
- [§4.1] Section 4.1 says 'In Section 5.2, I formally evaluate the sensitivity of empirical conclusions', but the sensitivity analysis appears in Section 4.2, not Section 5.2.
- [§3.6, proof of Theorem 3.6.1] The limit as δ→∞ is stated as [τ_min,τ_max] with a parenthetical 'e.g., [0,1] outcomes', but the paper never assumes bounded outcomes in the general setup. Without support restrictions on Y(1),Y(0), the unrestricted identified set can be unbounded.
- [§5] The conclusion says that 'Theorem 3.6.1 shows that bounds on ATT under curvature constraints can be characterized as the solution to a linear program', but neither Theorem 3.6.1 nor its proof contains any linear-programming formulation.
Circularity Check
The applied MAS-SI, fragility, and simulation conclusions reduce to arbitrary radius-ε and propensity-trimming constructions, with no derived link to the paper's curvature class Sδ.
-
self definitional
[Section 3.10, Simulation (page 8, paragraphs 3–4)]
"For each value, an identified set Iτ (δ) is constructed by placing a fixed radius ε=0.3 around the observed ATE. ... Across all δ, the observed ATEs remain near the population truth, but the identified sets uniformly contain zero. This implies δ∗ =∞ under the MAS-SI criterion: even when MAR holds, the sign of the effect remains unidentified."
MAS-SI is defined as δ∗ = inf{δ≥0 : 0∉Iτ(δ)} (Definition 3.7.1). In the simulation, Iτ(δ) is itself defined as a fixed-radius interval [ATE_obs−0.3, ATE_obs+0.3] around the observed ATE. Since the observed ATE is near 0.1, zero lies inside every interval for every δ by construction. Therefore the reported conclusion δ∗ = ∞ is not a derived property of the curvature class Sδ from Definition 3.4.2; it is equivalent to the arbitrary choice of ε=0.3. The 'prediction' restates its own input.
-
fitted input called prediction
[Section 4.2 (page 13, paragraphs 2–3)]
"ATT bounds indexed by δ are generated by successively trimming the sample based on estimated propensity scores, with each trimming rule interpreted as a proxy for a bound on selection curvature. ... The MAS-SI value is δ∗ = 0, and the fragility index is δfrag = 0, indicating that sign identification fails under arbitrarily small deviations from sampling ignorability."
The theoretical objects Iτ(δ), MAS-SI, and δfrag are defined through the selection-curvature class Sδ of Definition 3.4.2, i.e., by optimizing over sampling mechanisms with bounded log-odds curvature. In the application, however, Iτ(δ) is generated by a sequence of propensity-score trimming rules, and the paper states only that each rule is 'interpreted as a proxy' for a curvature bound. No derivation connects a trimming threshold to a constraint of the form sup |log odds ratio| ≤ δ. Consequently, the reported δ∗ = 0 and δfrag = 0 are determined by the chosen trimming design and the estimated propensity scores, not by the theoretical identified set. The fitted trimming rule is relabeled as a prediction of the paper's structural fragility diagnostics.
full rationale
The core non-identification result, Theorem 2.2.1, is a standard external result and is not circular: its proof constructs two DGPs with the same observed distribution but different τATT. Theorems 3.5.1 and 3.6.1 are largely immediate consequences of the definitions of Sδ and Iτ(δ), but they are presented as formal results rather than as predictions derived from independent inputs, so they do not by themselves raise the score substantially. The paper contains no load-bearing self-citations: the only self-citation is to replication code, and the cited external works are genuine literature references. The central circularity is in the operationalization of the diagnostics. In the simulation, Iτ(δ) is defined by a fixed radius of 0.3, making δ∗ = ∞ a direct consequence of that arbitrary radius rather than of the curvature framework. In the LaLonde application, MAS-SI and the fragility index are computed from propensity-score trimming rules, with the mapping from trimming thresholds to the curvature class Sδ asserted but never derived; the reported values therefore restate the trimming design. There is also an internal inconsistency in the reported MAS-SI values, δ∗ = 0 and δ∗ = 2.5 in the same section, which suggests the quantity is not being computed from the theoretical definition. Separately, the abstract's claim that 'nearly half the treated strata lack empirical support' is contradicted by the paper's own Figure 1 counts, which show 37 of 38 treated-containing strata have controls and only 1 treated-only cell; this is a factual or reporting problem, not a circularity. Because the headline applied conclusions are forced by ad hoc construction choices rather than by the paper's formal identified-set theory, a partial-circularity score of 6 is appropriate.
Assumptions & free parameters
free parameters (3)
- Simulation radius ε =
0.3
- Propensity score trimming thresholds =
[0.1, 0.9]
- Mapping from trimming level to δ =
not specified
assumptions (6)
- standard math Neyman-Rubin potential outcomes framework with observed treatment D and covariates X
- domain assumption The observed distribution is P(X,D,Y|S=1) with no assumptions on the sampling mechanism S
- ad hoc to paper At δ=0, the identified set collapses to a singleton {τ_MAR}
- ad hoc to paper Outcomes are bounded in [0,1] when appealing to Manski bounds as δ→∞
- domain assumption The empirical support is represented by a specific age-education cell stratification
- ad hoc to paper Propensity score trimming corresponds to selection curvature constraints
invented entities (4)
-
Selection frontier S(P_obs)
-
MAS-SI (δ*)
-
Fragility index (δ_frag)
-
Triple alignment
Cite this review
Pith. "Pith review of Fragility in Average Treatment Effect on the Treated under Limited Covariate Support." pith.science (2026). https://pith.science/paper/Q3G5AUZ3
@misc{pith2026250608950,
  author       = {Pith},
  title        = {Pith review of: Fragility in Average Treatment Effect on the Treated under Limited Covariate Support},
  year         = {2026},
  howpublished = {\url{https://pith.science/paper/Q3G5AUZ3}},
  note         = {Machine review of arXiv:2506.08950}
}
read the original abstract
This paper studies the identification of the average treatment effect on the treated (ATT) under unconfoundedness when covariate overlap is partial. A formal diagnostic is proposed to characterize empirical support -- the subset of the covariate space where ATT is point-identified due to the presence of comparable untreated units. Where support is absent, standard estimators remain computable but cease to identify meaningful causal parameters. A general sensitivity framework is developed, indexing identified sets by curvature constraints on the selection mechanism. This yields a structural selection frontier tracing the trade-off between assumption strength and inferential precision. Two diagnostic statistics are introduced: the minimum assumption strength for sign identification (MAS-SI), and a fragility index that quantifies the minimal deviation from ignorability required to overturn qualitative conclusions. Applied to the LaLonde (1986) dataset, the framework reveals that nearly half the treated strata lack empirical support, rendering the ATT undefined in those regions. Simulations confirm that ATT estimates may be stable in magnitude yet fragile in epistemic content. These findings reframe overlap not as a regularity condition but as a prerequisite for identification, and recast sensitivity analysis as integral to empirical credibility rather than auxiliary robustness.
Figures


Figures from the paper (6 more)


Reference graph
Works this paper leans on
- [1]
-
[2]
Angrist, J. D. and J.-S. Pischke (2009).Mostly Harmless Econometrics. Princeton University Press. Reference forδ≈0.5 in education attrition
work page 2009
-
[3]
Becker, S. O. and M. Caliendo (2007, March). Sensitivity analysis for average treatment effects.The Stata Journal 7(1), 71–83
work page 2007
-
[4]
Carneiro, P., J. J. Heckman, and E. Vytlacil (2010). Evaluating marginal policy changes and the average effect of treatment for individuals at the margin.Econometrica 78(1), 377–394
work page 2010
-
[5]
Cinelli, C. and C. Hazlett (2020). Making sense of sensitivity: Extending omitted variable bias.Journal of the Royal Statistical Society: Series B (Statistical Methodology) 82(1), 39–67
work page 2020
-
[6]
Crump, R. K., V. J. Hotz, G. W. Imbens, and O. A. Mitnik (2009). Dealing with limited overlap in estimation of average treatment effects.Biometrika 96(1), 187–199
work page 2009
-
[7]
Dahabreh, I. J., S. E. Robertson, J. A. Steingrimsson, M. A. Hern´ an, and E. A. Stuart (2020). Extending inferences from a randomized trial to a new target population.Statistics in Medicine 39(14), 1999–2014
work page 2020
-
[8]
Dehejia, R. and S. Wahba (1999). Causal effects in non-experimental studies: Reevaluating the evaluation of training programs.Journal of the American Statistical Association 94(448), 1053–1062
work page 1999
Show all 28 references
-
[9]
Dehejia, R. and S. Wahba (2002). Propensity score matching methods for non-experimental causal studies. Review of Economics and Statistics 84(1), 151–161
2002
-
[10]
Heckman, J. J. (1979). Sample selection bias as a specification error.Econometrica 47(1), 153–161
1979
-
[11]
Heckman, J. J. and J. A. Smith (1995). Assessing the case for social experiments.Journal of Economic Perspectives 9(2), 85–110. Source forδ≈0.69 (log(2.0)) in JTPA program
1995
-
[12]
Hirano, K. and G. W. Imbens (2001). Estimating causal effects using propensity score weighting: An appli- cation to data on right heart catheterization.Health Services and Outcomes Research Methodology 2(3), 259–278
2001
-
[13]
Ho, D. E., K. I. Vincent, G. King, and E. A. Stuart (2002). Matching as nonparametric preprocessing for reducing model dependence in parametric causal inference. InAnnual Meeting of the Midwest Political Science Association, Chicago. 24
2002
-
[14]
Ichimura, H. and W. K. Newey (2021). The influence function of semiparametric estimators. Working Paper 21-03, MIT Department of Economics. Revised version of July 2015 draft
2021
-
[15]
Imbens, G. and Y. Xu (2025). Comparing experimental and nonexperimental methods: What lessons have we learned four decades after lalonde (1986)?
2025
-
[16]
Imbens, G. W. (2003). Sensitivity to exogeneity assumptions in program evaluation.American Economic Review 93(2), 126–132. Framework for bias decomposition
2003
-
[17]
Imbens, G. W. (2004). Nonparametric estimation of average treatment effects under exogeneity: A review. Review of Economics and Statistics 86(1), 4–29
2004
-
[18]
King, G. and L. Zeng (2006). The dangers of extreme counterfactuals.Political Analysis 14(2), 131–159
2006
-
[19]
LaLonde, R. J. (1986). Evaluating the econometric evaluations of training programs with experimental data. American Economic Review 76(4), 604–620
1986
-
[20]
Li, F., K. L. Morgan, and A. M. Zaslavsky (2018). Balancing covariates via propensity score weighting. Journal of the American Statistical Association 113(521), 390–400
2018
-
[21]
Li, M. (2025). fragilityonatt: Version 1.0.0: Replication code
2025
-
[22]
Manski, C. F. (2003).Partial Identification of Probability Distributions. New York: Springer
2003
-
[23]
Robins, J. M., A. Rotnitzky, and L. P. Zhao (1995). Analysis of semiparametric regression models for re- peated outcomes in the presence of missing data.Journal of the American Statistical Association 90(429), 106–121
1995
-
[24]
Rosenbaum, P. R. (1989). Optimal matching for observational studies.Journal of the American Statistical Association 84(408), 1024–1032
1989
-
[25]
Rosenbaum, P. R. (2001). Effects attributable to treatment: Inference in experiments and observational studies with a discrete pivot.Biometrika 88(1), 219–231
2001
-
[26]
Rosenbaum, P. R. (2002).Observational Studies(2nd ed.). Springer. Reference for Γ = 1.8 sensitivity analysis
2002
-
[27]
Rosenbaum, P. R. and D. B. Rubin (1983). The central role of the propensity score in observational studies for causal effects.Biometrika 70(1), 41–55
1983
-
[28]
Rothe, C. (2017). Robust confidence intervals for average treatment effects under limited overlap.Econo- metrica 85(2), 645–660. 25
2017
Reviewed August 7, 2026 · model on record in the stance chip above.
Discussion (0). Sign in to comment.