REVIEW 5 major objections 6 minor 103 references
Galaxies at the edges: a complete census of MACS J0416.1-2403 cluster
T0 review · 5 major / 6 minor · reviewed 2026-08-07 · deepseek-v4-flash
Pith's one-line read A spectroscopic census of the outskirts of cluster MACS J0416 confirms 81 galaxies inside photometrically identified overdensities and filaments, arguing that galaxies are quenched in groups before joining the cluster.
desk verdict A useful new spectroscopic catalog of the MACS J0416 outskirts, with environmental claims that currently rest on inherited photometry and need a sturdier analysis. read the letter →
The pith
A machine-rendered reading of the paper's core claim, the machinery that carries it, and where it could break.
The reading
What carries the argument
The carrying object is the local density field $\delta$ inherited from the prior photometric catalog, divided into three bins, $\delta\leq 0$ for underdense regions, $0<\delta\leq 1$ for filamentary regions, and $\delta>1$ for overdensities, and overlaid with the new spectroscopic members. The new measurements come from AAOmega multi-object spectroscopy, with redshifts obtained by three independent methods, namely Redrock, EZ, and the new Redmost tool, a member selection window $z=[0.382,0.412]$, and rest-frame stacked spectra that make the color, mass, and density trends visible. Kolmogorov-Smirnov tests comparing the average spectra support the claim that the spectral differences between density populations are not driven by their K-band magnitude distributions.
What would settle it
Re-derive the local density field using only the new spectroscopic members and measure the line-of-sight velocity dispersions of the galaxies assigned to each overdensity: if the 81 galaxies do not cluster in A/B/C and the filaments, or if their dispersions are comparable to the field rather than well below the cluster's global roughly 800-1000 km/s, the pre-infall interpretation would fail.
Extended reading notes
Core claim
The paper's central claim is that the photometric overdensities and filaments in the outskirts of MACS J0416 correspond to genuine galaxies or galaxy groups currently undergoing infall, and that the environment has already begun reshaping their galaxy populations before they reach the cluster. This rests on the spectroscopic confirmation of 81 of the 148 new members inside the three overdensity regions A, B, and C plus the filamentary structures, and on stacked spectra that show a density-dependent trend: as local density rises from underdense through filamentary to overdense, galaxies become progressively redder in $(g-r)_{\rm Kron}$, brighter in the K band, and more passive, while the small population of blue galaxies in high-density regions stays spectrally similar to blue galaxies elsewhere, suggesting recent infall.
Load-bearing premise
The density bins and the A/B/C overdensity and filament labels are taken from a photometric catalog based on SED fitting and photometric redshifts, and the paper does not re-derive the density field from the new spectroscopic data, so if those photometric structures are projections or contaminated by field galaxies, the 81-galaxy confirmation and the density-property trends would rest on a flawed assignment.
Editorial extensions
If this is right
- The A, B, and C overdensities plus the filamentary bridge between B and C are real physical structures that contribute to the cluster's mass assembly.
- Galaxy properties in the outskirts are already differentiated before infall, supporting pre-processing in group environments at $z\sim0.4$.
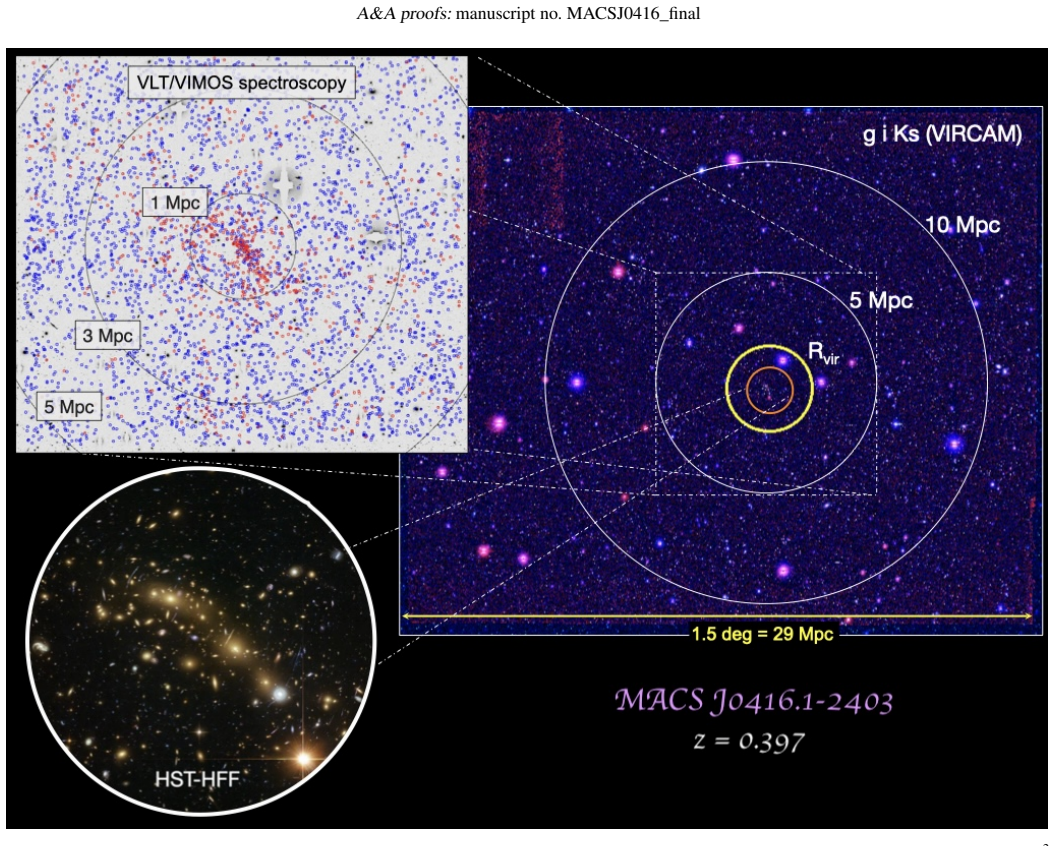
- The new catalog extends spectroscopic coverage of MACS0416 from roughly $2R_{200}$ to $5.5R_{200}$ and includes galaxies down to the dwarf regime, providing a resource for outskirts studies.
- The secondary redshift peaks near $z\sim0.384$ and $z\sim0.405$ correspond to infalling structures, now visible in the combined MUSE, VIMOS, and AAOmega redshift distribution.
Reading between the lines
- A direct dynamical test is available: if the 81 galaxies in regions A, B, and C and the filaments are bound infalling groups, their line-of-sight velocity dispersions should be well below the cluster's roughly 800-1000 km/s, whereas unbound projections would show field-like dispersions.
- The same photometric-to-spectroscopic follow-up strategy could be used to locate pre-processing sites in other $z\sim0.4$ clusters, where X-ray detection of the group gas is difficult.
- The paper's mass-versus-environment separation is only qualitative; a quantitative analysis at fixed stellar mass, combining MUSE, VIMOS, and AAOmega data, would test whether the density trends persist when mass is held constant.
Editorial analysis
A structured set of objections, weighed in public.
Referee Report
Summary. This paper presents 2dF+AAOmega spectroscopy of the outskirts of the galaxy cluster MACS J0416.1-2403 out to about 5.5 R200, measuring redshifts for 1236 objects with a 98.7% success rate and identifying 148 new spectroscopic cluster members in a narrow redshift window around z=0.397. The members are matched to the photometric density map of Estrada et al. (2023), and the paper reports that 81 of the 148 members lie in the A/B/C overdensity and filamentary regions, which it interprets as spectroscopic confirmation of infalling groups and thus support for the pre-processing scenario. The paper also presents stacked spectra split by g-r color, K-band magnitude, and local density, arguing that higher-density environments contain redder, more massive, and more passive galaxies. The redshift catalog and its quality control appear robust, but the environmental analysis is largely qualitative and relies entirely on the inherited photometric density field without controlling for target selection or providing statistical tests.
Significance. If the 81/148 confirmation and the density-property trends are correct, this would be one of the first spectroscopic confirmations of photometric infall structures around a z~0.4 cluster and would support the pre-processing scenario in cluster outskirts. The deliverable catalog is a clear strength: the AAOmega redshifts extend spectroscopic coverage of MACS0416 by a factor of about 2.5 in radius, reach dwarf galaxies, and are supported by careful quality flags following Balestra et al. (2016), cross-checks with three independent redshift codes (Redrock, EZ, and the newly released Redmost), and a public data release. These strengths make the dataset a useful community resource. However, the scientific claims about the reality and nature of the overdense regions are not yet supported at the same standard, because the key counts and trends are not tested against the selection function or a null expectation, and the statistical procedures used for the spectral comparisons are not valid as presented.
major comments (5)
- [Sec. 5.3 (Fig. 6)] The central claim that 81 of 148 new members lie in the A/B/C overdensity and filamentary regions of Estrada et al. (2023) is made without a control for the area fraction of those regions or for the spectroscopic target-selection function. Because the AAOmega targets were selected from the same photometric catalog used to define the overdensities (Sec. 3), an overdensity in the target distribution could be partly induced by the input catalog. The paper should (i) report the sky-area fraction covered by the A/B/C+filament footprint; (ii) compute the expected number of members in that footprint under a null distribution with the same selection function; and (iii) give the counts in A, B, C, and filaments separately, since region A is explicitly admitted to lack a well-defined spectroscopic counterpart. Without these, the 81/148 number cannot be evaluated as a confirmation.
- [Sec. 5.3 (Fig. 4b)] The secondary redshift peaks at z~0.385 and z~0.405 are presented as evidence that regions B and C are real infalling systems, with the text stating that 'These findings support the hypothesis that such structures may correspond to real physical systems currently experiencing infall,' but no statistical significance is given. The peaks appear in the AAOmega and combined redshift distributions, yet no mixture-model fit, bootstrap test, or velocity-dispersion estimate is provided. Given that the membership window itself is ±3000 km/s, the peaks need to be distinguished from the main cluster velocity distribution before they can be used to support the physical interpretation.
- [Sec. 5.3 (Fig. 8)] The Kolmogorov–Smirnov tests are applied to smoothed stacked spectra ('We performed a KS test on each pair of average spectra, obtaining p-values much smaller than 0.05'), which is not a valid test of whether the underlying galaxy populations differ. The effective sample size is not the number of galaxies, and the Gaussian smoothing further modifies the distributions being compared. The subsequent KS tests on K-band magnitude distributions are more appropriate, but they should be reported with sample sizes and test statistics. The spectral comparison should instead use standard two-sample tests on the individual galaxies (e.g., on emission-line strengths or colors) or, at minimum, bootstrap confidence envelopes on the stacked spectra.
- [Sec. 3] The paper states that only ~1290 of ~2000 expected targets were observed due to weather, i.e., roughly 30% of the photometric catalog with Vlim<21.5, and that this 'prevented us from fully spectroscopically covering all the photometric overdensities' and 'partially limited the statistical significance.' The spatial selection function is not quantified. If the missing fibers are not randomly distributed on the sky, which is likely for weather-affected multi-object spectroscopy, both the 81/148 count and the density-property trends could be biased. Please provide a completeness map relative to the parent photometric catalog and test the robustness of the key results to the selection function, for example by re-weighting or by comparing against random subsamples.
- [Secs. 5.1-5.3 (Figs. 5, 7, 8)] All stacked spectra are presented without uncertainties. The qualitative claims, for example that red galaxies in overdense regions are more passive than their lower-density counterparts and that blue galaxies show minimal variation with density, cannot be assessed without error estimates. Adding bootstrap or jackknife confidence envelopes and stating the number of galaxies in each stack would convert these from visual impressions into testable statements. This is particularly relevant because the KS-test justification in Fig. 8 is not statistically valid, as noted above.
minor comments (6)
- [Sec. 4.1] The heading contains a typo: 'distibution' should be 'distribution'.
- [Throughout] The text contains many instances of split ligatures, such as 'e ffects', 'di fferent', and 'e fficiencies'; please ensure the final typeset version renders these correctly.
- [Fig. 6] In the left panel caption, white circles are used for all AAOmega redshifts and light blue circles for members; in grayscale these may be difficult to distinguish, so different symbols or labeled contours would improve readability.
- [Sec. 5.1] The color cut (g-r)~1.20 is adopted from Estrada et al. (2023), but the paper does not state whether the photometric catalog version is the same as that used for target selection; a brief explicit statement would avoid ambiguity.
- [Sec. 5.3] The text explains that region A lacks a spectroscopic counterpart because the photometric candidates did not meet the magnitude limit, but it does not state the actual limiting magnitude of the AAOmega sample; adding this value would help quantify the selection effect.
- [Sec. 4.1] The connection between the quoted cluster redshift z=0.397±0.001 and the adopted membership window z=[0.382-0.412] is described, but a brief sentence explicitly relating the ±3000 km/s velocity range to the Δz=0.015 window would improve clarity.
Circularity Check
The 81/148 confirmation and the environmental trends are measured against the Estrada et al. (2023) photometric density field inherited from the same team and the same parent catalog as the AAOmega targets, so the pre-processing conclusion is partly a self-consistency check rather than an independent test.
-
self citation load bearing
[Sec. 5.3, Fig. 6 and surrounding text]
"following the environmental density definition by Estrada et al. (2023) ... we superimpose the whole AAOmega dataset on the density field of objects dentified as cluster members through photometric SED fitting Estrada et al. (2023). ... In total, we spectroscopically confirm 81 galaxies in the three A, B and C overdensities plus filamentary regions."
The overdensity regions A/B/C and the delta bins are not re-derived from the new spectroscopic sample; they are taken from Estrada et al. (2023), whose photometric SED-fitting member catalog is also the parent catalog from which the AAOmega targets were drawn (Sec. 3: targets are '30% of the total number of objects in the photometric catalog'). The headline '81/148 in overdensities plus filaments' is therefore a count of how many spectroscopically confirmed members fall inside regions defined by the same photometric catalog that supplied the targets; it does not independently establish that those regions are real bound infalling groups. That reality, the pre-processing interpretation, is the load-bearing input inherited from the same team's prior paper.
full rationale
The paper's new spectroscopic redshifts are genuinely independent measurements of cluster membership: 148 members are selected by AAOmega redshifts in z=[0.382-0.412], not derived from Estrada et al. (2023) fitting. However, the central '81 in overdensities' result and the environmental trends are computed by overlaying these new redshifts on Estrada's photometric density field, and the AAOmega targets were drawn from that same photometric catalog. The paper never re-derives the density field or delta bins from the new spectroscopy, and it explicitly admits that region A lacks a well-defined spectroscopic counterpart while still including it in the 81 count. The redshift peaks near z~0.385 and z~0.405 provide some independent support for regions B and the B-C filament, so the central claim is not forced by construction. The result is therefore partially circular in that the pre-processing conclusion is a self-consistency check of the inherited photometric map, but it retains independent spectroscopic content.
Assumptions & free parameters
free parameters (4)
- Local density bins for environment classification
- K Kron magnitude bins for mass stratification
- Redshift membership window =
z = [0.382, 0.412]
- g-r color cut =
(g-r)Kron = 1.20 mag
assumptions (4)
- domain assumption K-band luminosity is a reliable proxy for stellar mass.
- domain assumption The photometric density field and overdensity regions A/B/C from Estrada et al. (2023) correspond to real physical structures.
- domain assumption g-r color bimodality separates star-forming from passive galaxies.
- standard math Lambda-CDM cosmology with Omega_m=0.3, Omega_Lambda=0.7, and H0=70 km/s/Mpc.
Cite this review
Pith. "Pith review of Galaxies at the edges: a complete census of MACS J0416.1-2403 cluster." pith.science (2026). https://pith.science/paper/JIRZPC6F
@misc{pith2026250611216,
  author       = {Pith},
  title        = {Pith review of: Galaxies at the edges: a complete census of MACS J0416.1-2403 cluster},
  year         = {2026},
  howpublished = {\url{https://pith.science/paper/JIRZPC6F}},
  note         = {Machine review of arXiv:2506.11216}
}
read the original abstract
Numerous studies have established that the environment influences the physical properties of a galaxy. While gas inflows supply the fuel for SF, high density and temperature conditions suppress SF activity through various quenching processes. Investigations into large scale structures, such as filaments and overdense regions in the cluster outskirts, have focused on the low z. To move to intermediate z and explore galaxy pathways combined with environmental effects, it is crucial to join wide field spectroscopy and deep photometry. Our primary objective is to spectroscopically analyze the photometric overdensities observed by Estrada et al.(2023) in the outskirts of massive cluster MACS J0416.1-2403 (z=0.397), interpreted as evidence of ongoing group infall, i.e. the pre processing scenario, and to investigate the behavior of galaxies in the outskirts about their g-r color, Mstar, and local density, emphasizing the influence of the environment on galaxy evolution. We conducted a spectroscopic analysis out to 5.5R200, using the AAOmega spectrograph. The large FoV and depth allowed us to explore galaxies up to the cluster periphery and across a wide Mstar range, reaching down to the limit of dwarf galaxies. Redshifts were obtained through independent but comparable methods: Redrock, EZ, and Redmost. We identified 148 new spectroscopic cluster members from a sample of 1236 objects. We found 81 galaxies located in filamentary and overdense regions, supporting the role of filamentary infall in the cluster mass assembly history. Our analysis revealed that galaxies in high density regions are more massive, redder, and more passive, compared to galaxies in low density regions that appear to be bluer, less massive, and more SF. These findings underscore the significance of environmental effects and the role of pre processing in shaping galaxy properties before cluster infall.
Figures


Figures from the paper (5 more)


Reference graph
Works this paper leans on
-
[1]
, " * write output.state after.block = add.period write newline
ENTRY address archiveprefix author booktitle chapter edition editor howpublished institution eprint journal key month note number organization pages publisher school series title type volume year label extra.label sort.label short.list INTEGERS output.state before.all mid.sentence after.sentence after.block FUNCTION init.state.consts #0 'before.all := #1 ...
-
[2]
write newline
" write newline "" before.all 'output.state := FUNCTION n.dashify 't := "" t empty not t #1 #1 substring "-" = t #1 #2 substring "--" = not "--" * t #2 global.max substring 't := t #1 #1 substring "-" = "-" * t #2 global.max substring 't := while if t #1 #1 substring * t #2 global.max substring 't := if while FUNCTION word.in bbl.in " " * FUNCTION format....
-
[3]
2017, , 851, 81
Annunziatella , M., Bonamigo , M., Grillo , C., et al. 2017, , 851, 81
2017
-
[4]
2016, , 585, A160
Annunziatella , M., Mercurio , A., Biviano , A., et al. 2016, , 585, A160
2016
-
[5]
2016, , 224, 33
Balestra , I., Mercurio , A., Sartoris , B., et al. 2016, , 224, 33
2016
-
[6]
L., Navarro , J
Balogh , M. L., Navarro , J. F., & Morris , S. L. 2000, , 540, 113
2000
-
[7]
R., Pfrommer , C., & Sievers , J
Battaglia , N., Bond , J. R., Pfrommer , C., & Sievers , J. L. 2012, , 758, 74
2012
-
[8]
2023, , 674, A79
Bergamini , P., Grillo , C., Rosati , P., et al. 2023, , 674, A79
2023
Show all 103 references
-
[9]
2018, , 476, 2689
Biffi , V., Planelles , S., Borgani , S., et al. 2018, , 476, 2689
2018
-
[10]
2017, , 842, 132
Bonamigo , M., Grillo , C., Ettori , S., et al. 2017, , 842, 132
2017
-
[11]
2018, , 864, 98
Bonamigo , M., Grillo , C., Ettori , S., et al. 2018, , 864, 98
2018
-
[12]
& Charlot , S
Bruzual , G. & Charlot , S. 2003, , 344, 1000
2003
-
[13]
B., Grillo , C., Rosati , P., et al
Caminha , G. B., Grillo , C., Rosati , P., et al. 2017, , 600, A90
2017
-
[14]
H., Grillo , C., et al
Chiriv \` , G., Suyu , S. H., Grillo , C., et al. 2018, , 614, A8
2018
-
[15]
Cowie , L. L. & Songaila , A. 1977, , 266, 501
1977
-
[16]
2024, mauritiusdadd/redmost: 0.2.3
D'Addona, M. 2024, mauritiusdadd/redmost: 0.2.3
2024
-
[17]
2012, , 422, 1732
Danovich , M., Dekel , A., Hahn , O., & Teyssier , R. 2012, , 422, 1732
2012
-
[18]
de Jong , R. S. & Bell , E. F. 2001, in Astronomical Society of the Pacific Conference Series, Vol. 230, Galaxy Disks and Disk Galaxies, ed. J. G. Funes & E. M. Corsini , 555--556
2001
-
[19]
De Lucia , G., Springel , V., White , S. D. M., Croton , D., & Kauffmann , G. 2006, , 366, 499
2006
-
[20]
2009, , 457, 451
Dekel , A., Birnboim , Y., Engel , G., et al. 2009, , 457, 451
2009
-
[21]
M., Adams , N
Diego , J. M., Adams , N. J., Willner , S. P., et al. 2024, , 690, A114
2024
-
[22]
V., & More , S
Diemer , B., Mansfield , P., Kravtsov , A. V., & More , S. 2017, , 843, 140
2017
-
[23]
1980, , 236, 351
Dressler , A. 1980, , 236, 351
1980
-
[24]
C., & Henry , J
Ebeling , H., Edge , A. C., & Henry , J. P. 2001, , 553, 668
2001
-
[25]
2014, , 211, 21
Ebeling , H., Ma , C.-J., & Barrett , E. 2014, , 211, 21
2014
-
[26]
2023, , 671, A146
Estrada , N., Mercurio , A., Vulcani , B., et al. 2023, , 671, A146
2023
-
[27]
& Bebek, C
Flaugher, B. & Bebek, C. 2014, in Ground-based and Airborne Instrumentation for Astronomy V, Vol. 9147
2014
-
[28]
2007, , 465, 711
Franzetti , P., Scodeggio , M., Garilli , B., et al. 2007, , 465, 711
2007
-
[29]
2004, , 56, 29
Fujita , Y. 2004, , 56, 29
2004
-
[30]
Gallazzi , A., Charlot , S., Brinchmann , J., White , S. D. M., & Tremonti , C. A. 2005, , 362, 41
2005
-
[31]
2010, , 122, 827
Garilli , B., Fumana , M., Franzetti , P., et al. 2010, , 122, 827
2010
-
[32]
1996, , 312, 397
Gavazzi , G., Pierini , D., & Boselli , A. 1996, , 312, 397
1996
-
[33]
Gnedin , O. Y. 2003, , 582, 141
2003
-
[34]
H., Rosati , P., et al
Grillo , C., Suyu , S. H., Rosati , P., et al. 2015, , 800, 38
2015
-
[35]
Gunn , J. E. & Gott , J. Richard, I. 1972, , 176, 1
1972
-
[36]
2023, , 165, 144
Guy , J., Bailey , S., Kremin , A., et al. 2023, , 165, 144
2023
-
[37]
J., Ruiz-Macias , O., et al
Hahn , C., Wilson , M. J., Ruiz-Macias , O., et al. 2023, , 165, 253
2023
-
[38]
H., Treu , T., et al
Hoag , A., Huang , K. H., Treu , T., et al. 2016, , 831, 182
2016
-
[39]
2013, , 766, 90
Ichikawa , K., Matsushita , K., Okabe , N., et al. 2013, , 766, 90
2013
-
[40]
2014, , 443, 1549
Jauzac , M., Cl \'e ment , B., Limousin , M., et al. 2014, , 443, 1549
2014
-
[41]
2015, , 446, 4132
Jauzac , M., Jullo , E., Eckert , D., et al. 2015, , 446, 4132
2015
-
[42]
& Charlot , S
Kauffmann , G. & Charlot , S. 1998, , 297, L23
1998
-
[43]
M., Diaferio , A., & White , S
Kauffmann , G., Colberg , J. M., Diaferio , A., & White , S. D. M. 1999 a , , 303, 188
1999
-
[44]
M., Diaferio , A., & White , S
Kauffmann , G., Colberg , J. M., Diaferio , A., & White , S. D. M. 1999 b , , 307, 529
1999
-
[45]
M., White , S
Kauffmann , G., Heckman , T. M., White , S. D. M., et al. 2003, , 341, 33
2003
-
[46]
B., Tinsley , B
Larson , R. B., Tinsley , B. M., & Caldwell , C. N. 1980, , 237, 692
1980
-
[47]
T., Kravtsov , A
Lau , E. T., Kravtsov , A. V., & Nagai , D. 2009, , 705, 1129
2009
-
[48]
T., Nagai , D., Avestruz , C., Nelson , K., & Vikhlinin , A
Lau , E. T., Nagai , D., Avestruz , C., Nelson , K., & Vikhlinin , A. 2015, , 806, 68
2015
-
[49]
2013, arXiv e-prints, arXiv:1308.0847
Levi , M., Bebek , C., Beers , T., et al. 2013, arXiv e-prints, arXiv:1308.0847
2013 arXiv
-
[50]
M., Koekemoer , A., Coe , D., et al
Lotz , J. M., Koekemoer , A., Coe , D., et al. 2017, , 837, 97
2017
-
[51]
Mann , A. W. & Ebeling , H. 2012, , 420, 2120
2012
-
[52]
V., & Diemer , B
Mansfield , P., Kravtsov , A. V., & Diemer , B. 2017, , 841, 34
2017
-
[53]
2021, , 656, A147
Mercurio , A., Rosati , P., Biviano , A., et al. 2021, , 656, A147
2021
-
[54]
2022, , 516, 3532
Me s tri \'c , U., Vanzella , E., Zanella , A., et al. 2022, , 516, 3532
2022
-
[55]
Mihos , J. C. 2004, in Clusters of Galaxies: Probes of Cosmological Structure and Galaxy Evolution, ed. J. S. Mulchaey , A. Dressler , & A. Oemler , 277
2004
-
[56]
Mihos , J. C. & Hernquist , L. 1996, , 464, 641
1996
-
[57]
Mirakhor , M. S. & Walker , S. A. 2021, , 506, 139
2021
-
[58]
1998, , 495, 139
Moore , B., Lake , G., & Katz , N. 1998, , 495, 139
1998
-
[59]
2018, , 868, 84
Moresco , M., Jimenez , R., Verde , L., et al. 2018, , 868, 84
2018
-
[60]
Mulchaey , J. S. & Zabludoff , A. I. 1998, , 496, 73
1998
-
[61]
& Lau , E
Nagai , D. & Lau , E. T. 2011, , 731, L10
2011
-
[62]
1974, , 194, 1
Oemler , Augustus, J. 1974, , 194, 1
1974
-
[63]
A., van Weeren , R
Ogrean , G. A., van Weeren , R. J., Jones , C., et al. 2015, , 812, 153
2015
-
[64]
A., van Weeren , R
Ogrean , G. A., van Weeren , R. J., Jones , C., et al. 2016, , 819, 113
2016
-
[65]
2018, , 479, 2328
Olave-Rojas , D., Cerulo , P., Demarco , R., et al. 2018, , 479, 2328
2018
-
[66]
M., et al
Paccagnella , A., Vulcani , B., Poggianti , B. M., et al. 2017, , 838, 148
2017
-
[67]
M., et al
Paccagnella , A., Vulcani , B., Poggianti , B. M., et al. 2016, , 816, L25
2016
-
[68]
M., et al
Paccagnella , A., Vulcani , B., Poggianti , B. M., et al. 2019, , 482, 881
2019
-
[69]
M., Smail , I., Dressler , A., et al
Poggianti , B. M., Smail , I., Dressler , A., et al. 1999, , 518, 576
1999
-
[70]
2012, , 199, 25
Postman , M., Coe , D., Ben \' tez , N., et al. 2012, , 199, 25
2012
-
[71]
2023, , 670, L20
Ragusa , R., Iodice , E., Spavone , M., et al. 2023, , 670, L20
2023
-
[72]
2022, Frontiers in Astronomy and Space Sciences, 9, 852810
Ragusa , R., Mirabile , M., Spavone , M., et al. 2022, Frontiers in Astronomy and Space Sciences, 9, 852810
2022
-
[73]
2021, , 651, A39
Ragusa , R., Spavone , M., Iodice , E., et al. 2021, , 651, A39
2021
-
[74]
A., et al
Raichoor , A., Moustakas , J., Newman , J. A., et al. 2023, , 165, 126
2023
-
[75]
2014, , 444, 268
Richard , J., Jauzac , M., Limousin , M., et al. 2014, , 444, 268
2014
-
[76]
2013, , 432, 3030
Roncarelli , M., Ettori , S., Borgani , S., et al. 2013, , 432, 3030
2013
-
[77]
2014, The Messenger, 158, 48
Rosati , P., Balestra , I., Grillo , C., et al. 2014, The Messenger, 158, 48
2014
-
[78]
Rose , J. A. 1984, , 89, 1238
1984
-
[79]
Rose , J. A. 1985, , 90, 1927
1985
-
[80]
Rudd , D. H. & Nagai , D. 2009, , 701, L16
2009
-
[81]
M., Mart \' nez , H
Salerno , J. M., Mart \' nez , H. J., Muriel , H., et al. 2020, , 493, 4950
2020
-
[82]
Schlafly , E. F. & Finkbeiner , D. P. 2011, , 737, 103
2011
-
[83]
2006, in Society of Photo-Optical Instrumentation Engineers (SPIE) Conference Series, Vol
Sharp , R., Saunders , W., Smith , G., et al. 2006, in Society of Photo-Optical Instrumentation Engineers (SPIE) Conference Series, Vol. 6269, Ground-based and Airborne Instrumentation for Astronomy, ed. I. S. McLean & M. Iye , 62690G
2006
-
[84]
2023, , 669, A27
Sureshkumar , U., Durkalec , A., Pollo , A., et al. 2023, , 669, A27
2023
-
[85]
2021, , 653, A35
Sureshkumar , U., Durkalec , A., Pollo , A., et al. 2021, , 653, A35
2021
-
[86]
M., Lim, P
TheAstropyCollaboration, Price-Whelan, A. M., Lim, P. L., et al. 2022, The Astrophysical Journal, 935, 167
2022
-
[87]
2010, , 404, 1775
Thomas , D., Maraston , C., Schawinski , K., Sarzi , M., & Silk , J. 2010, , 404, 1775
2010
-
[88]
B., Brammer , G
Treu , T., Schmidt , K. B., Brammer , G. B., et al. 2015, , 812, 114
2015
-
[89]
2014, , 795, 163
Umetsu , K., Medezinski , E., Nonino , M., et al. 2014, , 795, 163
2014
-
[90]
B., Rosati , P., et al
Vanzella , E., Caminha , G. B., Rosati , P., et al. 2021, , 646, A57
2021
-
[91]
2009, , 504, 33
Vazza , F., Brunetti , G., Kritsuk , A., et al. 2009, , 504, 33
2009
-
[92]
Verheijen , M. A. W. 2001, , 563, 694
2001
-
[93]
2014, , 444, 313
Villalobos , \'A ., De Lucia , G., & Murante , G. 2014, , 444, 313
2014
-
[94]
M., Gullieuszik , M., et al
Vulcani , B., Poggianti , B. M., Gullieuszik , M., et al. 2023, , 949, 73
2023
-
[95]
2017, , 837, 126
Vulcani , B., Treu , T., Nipoti , C., et al. 2017, , 837, 126
2017
-
[96]
B., et al
Vulcani , B., Treu , T., Schmidt , K. B., et al. 2016, , 833, 178
2016
-
[97]
2019, , 215, 7
Walker , S., Simionescu , A., Nagai , D., et al. 2019, , 215, 7
2019
-
[98]
2020, , 491, 2864
Welker , C., Bland-Hawthorn , J., van de Sande , J., et al. 2020, , 491, 2864
2020
-
[99]
A., Cohen , S
Windhorst , R. A., Cohen , S. H., Jansen , R. A., et al. 2023, , 165, 13
2023
-
[100]
Zabludoff , A. I. & Mulchaey , J. S. 1998, , 496, 39
1998
-
[101]
A., et al
Zhou , R., Dey , B., Newman , J. A., et al. 2023, , 165, 58
2023
-
[102]
2013, , 762, L30
Zitrin , A., Meneghetti , M., Umetsu , K., et al. 2013, , 762, L30
2013
-
[103]
1951, , 63, 61
Zwicky , F. 1951, , 63, 61
1951
Reviewed August 7, 2026 · model on record in the stance chip above.
Discussion (0). Continue with ORCID to comment.