REVIEW 4 major objections 4 minor 49 references
Forecast error diagnostics in neural weather models
T0 review · 4 major / 4 minor · reviewed 2026-08-07 · deepseek-v4-flash
Pith's one-line read In a neural weather model, relaxing the stratosphere or boundary layer toward ERA5 truth substantially improves mid-latitude forecasts, while relaxing the tropics does not.
desk verdict A useful diagnostic toolkit for neural weather models, with a genuinely new relaxation/sensitivity combination and one under-quantified caveat about the stratospheric result. read the letter →
The pith
A machine-rendered reading of the paper's core claim, the machinery that carries it, and where it could break.
The reading
What carries the argument
The carrying object is the relaxation-sensitivity pair of diagnostics. Grid-point relaxation is implemented directly on forecast fields rather than tendencies: a smooth tanh-based weight $\Lambda$, a function of pressure level and latitude, blends the model prediction with the ERA5 truth at each step of the autoregressive rollout, and the relative error change between relaxed and unrelaxed forecasts is tested for significance with the Mann-Whitney U test. Error sensitivity uses auto-differentiability to compute the gradient of a sum-of-absolute-errors function with respect to the standardized initial state, averaged over a test period to give the average magnitude of error sensitivity (AMES). The two probes are complementary: relaxation changes the atmosphere at forecast lead times, sensitivity marks the initial conditions that matter, and their agreement is the evidence for attributing error to specific regions and processes.
What would settle it
Run the same three relaxation experiments on a second, independently trained neural weather model, such as a transformer- or graph-based architecture at comparable resolution, over the same 2020-2022 test forecasts: if tropical relaxation there produces substantial extratropical skill changes, or stratospheric and boundary-layer relaxation gains do not reproduce, the attribution is an artifact of ConvCastNet rather than a general statement about neural weather models.
Extended reading notes
Core claim
On its own terms, the paper establishes that forecast error in a deep-learning weather model can be spatially attributed by a relaxation diagnostic: replacing the model's predicted fields in a chosen region with ERA5 values, via the weighted combination $X(r,t+\Delta t)=\Lambda(r)X^f(r,t+\Delta t)+(1-\Lambda(r))X^t(r,t+\Delta t)$, and measuring the error change elsewhere. In ConvCastNet, relaxation of the tropical troposphere leaves extratropical forecast skill essentially unchanged, while relaxation of the global boundary layer and of the stratosphere each significantly improves mid-latitude medium-range forecasts, with the stratospheric influence descending into the troposphere after a delay. The companion sensitivity analysis, $\partial E/\partial S(0)$ computed by backpropagation, finds that mid-latitude forecast error is most sensitive to initial zonal wind in the jet and storm-track regions and to sea-surface temperature in the mid-latitude oceans, and that the average sensitivity to tropical initial conditions is negligible. The paper reads the overlap between large sensitivity and large relaxation gains as evidence that the model's representation of stratospheric and boundary-layer processes is the main limit on its medium-range mid-latitude skill, while also cautioning that stratospheric relaxation overstates the real gain because tropospheric errors would still propagate upward in a fully coupled model.
Load-bearing premise
The load-bearing premise is that forcing a region of the forecast toward ERA5 truth acts as a faithful stand-in for correcting the model's representation of physical processes in that region, so the skill gain can be attributed to those processes; the paper itself notes this exaggerates the stratospheric gain because errors from the troposphere would still propagate upward in a real coupled model.
Editorial extensions
If this is right
- Targeted corrections to the model's stratospheric and boundary-layer physics should translate into medium-range mid-latitude forecast skill, because relaxing those zones to reanalysis truth produces the largest observed gains.
- Tropical initial-condition errors and tropical process errors are not the main lever for extratropical medium-range predictability in this model, so observations and training effort aimed at the tropics will not fix mid-latitude forecasts.
- Gradient sensitivity maps can indicate where to add or improve observations and initial conditions, most profitably near upstream baroclinic zones and over oceans with strong sea-surface-temperature gradients.
- Boundary-layer relaxation improving stratospheric forecasts after about eight days, and stratospheric relaxation improving tropospheric forecasts with a delay, indicates the model has internalized a two-way troposphere-stratosphere coupling.
- The combined relaxation-plus-sensitivity workflow can serve as a general debugging method for neural weather models, identifying misrepresented regions and processes without a physics-based adjoint.
Reading between the lines
- An untested extension is to apply the same relaxation protocol to a transformer- or graph-based neural weather model to see whether the 'tropics barely matter' result is specific to ConvCastNet.
- A higher-resolution variant would test whether the negligible tropical influence is an artifact of the equatorial waveguide at the 3-degree grid rather than a general property of data-driven forecasts.
- Because Leaky ReLU and the absolute-error loss are non-differentiable at some points, recomputing the sensitivity maps with smooth activations (ELU/GELU) and a squared-error loss would show how much of the sensitivity-relaxation overlap is numerical rather than physical.
- The same tools could be aimed at land-atmosphere coupling, for instance by relaxing soil-moisture fields to test their role in heatwave development, a direction the paper itself lists as future work.
Editorial analysis
A structured set of objections, weighed in public.
Referee Report
Summary. The manuscript presents two complementary diagnostic tools for a U-Net-based neural weather prediction model, ConvCastNet: grid-point relaxation, in which selected subdomains of the forecast trajectory are blended with ERA5 truth via Eq. (2), and gradient-based error sensitivity, computed with backpropagation from the absolute-error loss in Eq. (6). Relaxation experiments in three regions (tropics, boundary layer, stratosphere) indicate that mid-latitude medium-range skill improves substantially when the stratosphere or boundary layer is relaxed, while tropical relaxation has negligible extratropical impact. A hurricane case study and climatological sensitivity maps show error sensitivity concentrated in mid-latitude baroclinic regions and to sea surface temperatures, with limited tropical influence. The authors conclude that stratospheric and boundary-layer process representation and atmosphere-ocean coupling deserve priority in DL weather model development.
Significance. The paper is a useful methodological contribution: it adapts a classical NWP diagnostic (nudging) to a fully differentiable DL model and explicitly connects it to saliency-type sensitivity maps. Strengths include the use of an external reference (ERA5), the absence of free parameters fitted to produce the headline conclusions, a clear statistical significance protocol, and unusually candid limitations in Section 5. If the claims survive, the approach gives model developers an inexpensive way to triage where to invest in physics improvements. The main reservations concern the interpretation of the relaxation signal in a two-way coupled atmosphere and the strength of the statistical evidence for the small tropical influence.
major comments (4)
- [§4.1, Eq. (2), §5] The headline claim in the Abstract and §4.1 that stratospheric relaxation 'underscores the need for a more accurate representation of the stratosphere' is not quantitatively supported because the relaxation protocol in Eq. (2) cannot separate two effects: correcting genuinely deficient stratospheric processes, and injecting tropospheric-consistent information aloft that would in reality still be corrupted by upward error propagation. The §5 caveat ('exaggerates the actual improvement') is qualitative; the paper should either provide a bounding experiment—for example comparing continuous relaxation against relaxation applied only at the initial time or against relaxation to a stratospheric control field that is not dynamically consistent with the troposphere—or explicitly rephrase the central claim as 'the stratospheric state, whatever its origin, controls mid-latitude skill in this model.'
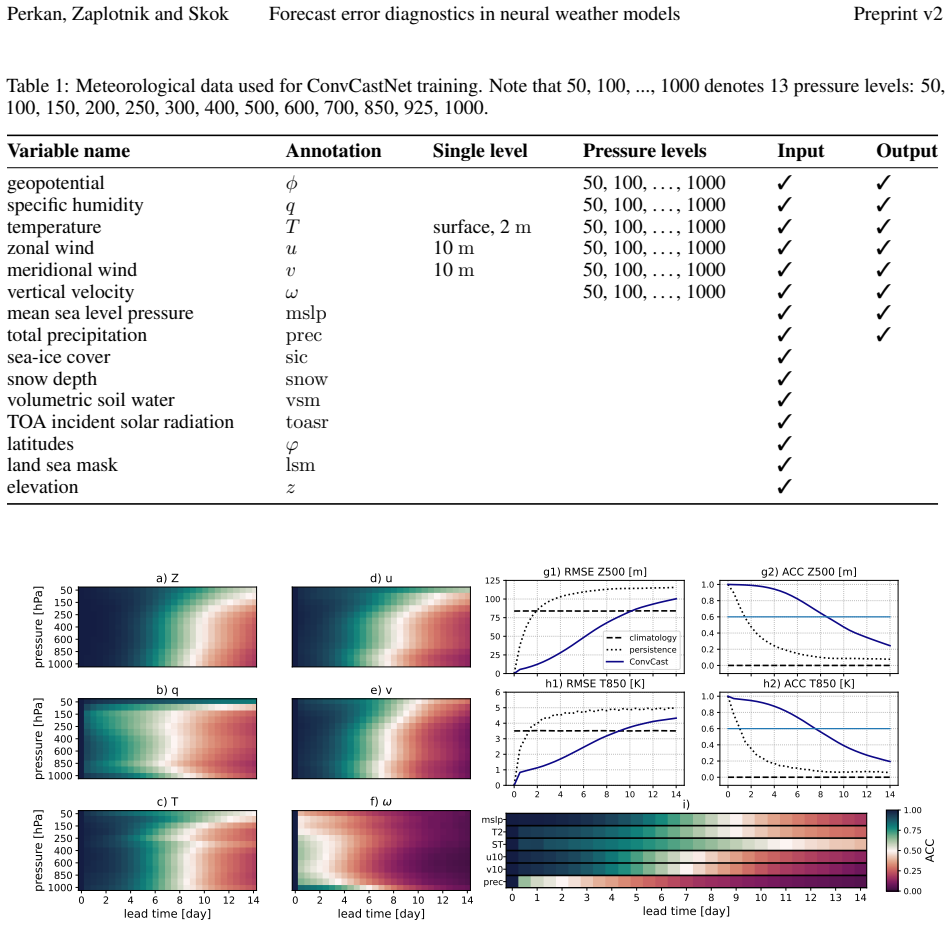
- [§3.1, Figs. 2-3] The relaxation zones are chosen from the same error fields that the paper then diagnoses: the boundary-layer p0 = 850 hPa is selected from the ACC discontinuity in Fig. 2, and the stratospheric zone from rapid normalised error growth in Fig. 3. This creates a selection-dependence that is not acknowledged in the interpretation; the finding that these regions 'need better representation' is partly a restatement of where the model already has large errors. The authors should report sensitivity of the conclusions to the zone parameters (e.g., p0 ∈ [800, 900] hPa, tropopause definition) and, ideally, test at least one control zone selected without reference to the error maps.
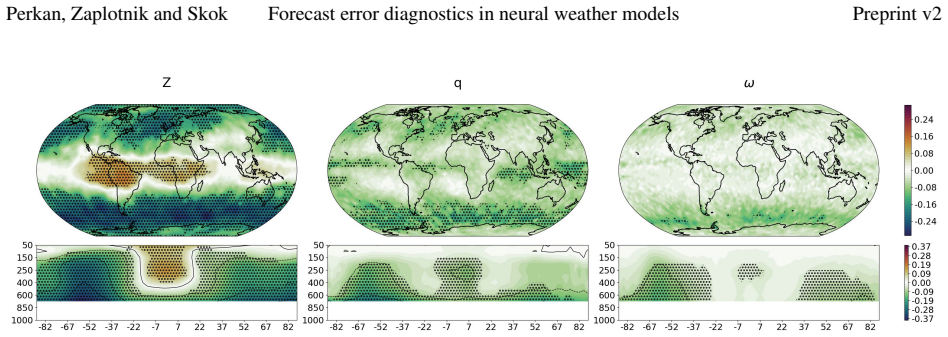
- [§3.1, Eq. (5), Fig. 4] The Mann-Whitney U test is applied to vertically or zonally averaged absolute errors from relaxed and unrelaxed forecasts. These are paired samples (same initial conditions), and the test ignores the pairing, which reduces power and does not account for the common initial-error component; in addition, the hatched markers indicate only significance, not the uncertainty of the relative error change in Eq. (5). I recommend a paired test (e.g., Wilcoxon signed-rank or bootstrap on paired differences) and reporting confidence intervals for the relative error change, so that the magnitudes in Figs. 4-7 can be assessed.
- [§4.2.2, Eq. (8)] The 'average magnitude of error sensitivity' (AMES) is computed from Eq. (8), and because the derivative of the absolute value is just the sign of the residual, the magnitude |∂E/∂S(0)| equals |∇S(0) M|, i.e., the AMES maps show the average Jacobian magnitude, not an error-weighted sensitivity. The paper acknowledges the non-differentiability of the absolute error, but the overlap claim between sensitivity and relaxation gains (Abstract, §5) is never quantified; a spatial correlation or a simple contingency metric between AMES and the relative error change fields would make the overlap claim testable. The AMES is also based on a small test set (2020-2022, every fifth day, alternating 00/12 UTC) without uncertainty estimates, so the conclusion that mid-latitude errors are 'negligibly' influenced by tropical initial conditions rests on visual inspection rather than a statistical bound.
minor comments (4)
- [§3.1, Eqs. (2)-(4)] Eq. (2) does not state how the latitude and pressure weights in Eqs. (3) and (4) are combined; please specify the product Λ(φ)Λ(p) or equivalent in the text.
- [Appendix A] The loss function description in Appendix A ('0.1 · MSE(...)^1/256') is ambiguous; clarify whether the exponent applies to the MSE or to the overall loss and what role the factor 1/256 plays.
- [References] The reference list contains typos ('SIfre' should be 'Sifre'; Domeisen et al. 2020b duplicates the title of the 2020a paper), and §2.3 contains a missing space in 'forZ500'.
- [Data availability] For a methods paper, the absence of model code or trained weights in the Data availability statement is a reproducibility concern; at minimum the relaxation and sensitivity code should be released.
Circularity Check
No significant circularity: the relaxation and sensitivity diagnostics are empirical comparisons against ERA5, and the central conclusions are not encoded in the experimental construction.
full rationale
The paper's central derivation chain is: define relaxation via Eq. (2)-(4) with fixed weights chosen from prior error statistics (Sections 2.3 and 3.1); run ConvCastNet forward with and without relaxation; compare errors against ERA5 via Eq. (5); interpret the resulting skill changes. The downstream mid-latitude skill gain from stratospheric and boundary-layer relaxation is not a fitted quantity: the relaxation weights contain no parameter tuned to the target conclusion, and the gain is an emergent property of the autoregressive rollout. The contrast with the tropical case, where a region also selected for rapid error growth shows negligible downstream influence, demonstrates that choosing high-error regions does not by itself force the claimed outcome. The sensitivity analysis (Eq. 8 and the AMES computations) is an independent gradient-based diagnostic, not derived from the relaxation results; the agreement between the two methods is a cross-validation rather than a tautology. The only self-citation affecting the experimental design is Zaplotnik's co-authorship of Zagar et al. 2017 and Zagar 2017, cited to motivate the tropical relaxation region; this is background motivation rather than load-bearing, because the tropical null result rests on the relaxation experiment itself. The paper's own Section 5 limitation, that 'relaxation of the stratosphere to truth exaggerates the actual improvement that would be achieved only by improving the model's representation of the stratospheric processes, as the forecast errors from the troposphere would still propagate upwards', is an honest interpretability caveat about the magnitude of the process-representation conclusion, not a circular step; it bounds rather than undermines the diagnostic claim. No equation reduces to another by construction, and no fitted parameter is renamed as a prediction. The statistical-testing concerns raised about the small test set and the Mann-Whitney implementation are validity issues, not circularity, so they do not affect this score.
Assumptions & free parameters
free parameters (4)
- Tropical relaxation latitude bounds =
phi_min=-19.5 deg S, phi_max=19.5 deg N, Delta_phi=4.5 deg
- Boundary layer relaxation pressure =
p0=850 hPa, Delta_p=100 hPa, negative sign in Eq. 3
- Stratospheric relaxation pressure and transition =
positive sign, Delta_p=100 hPa, tropopause via temperature derivative with Gaussian smoothing sigma=2
- Sensitivity error domains =
DA: [4.5S, 4.5N], DB: [28.5N, 34.5N], DC: [40.5N, 49.5N]; pressure 1000-600 hPa
assumptions (5)
- domain assumption ERA5 reanalysis is an adequate proxy for the true atmospheric state for relaxation and error computation.
- domain assumption Replacing model forecast fields in a zone with reanalysis truth is a valid way to test the influence of that zone's accuracy on downstream forecasts.
- domain assumption Automatic differentiation through the autoregressive rollout gives a meaningful gradient of the forecast error with respect to initial conditions.
- domain assumption The ConvCastNet results are representative of deep-learning weather models in general.
- standard math Mann-Whitney U test is appropriate for comparing vertically and zonally averaged absolute errors.
Cite this review
Pith. "Pith review of Forecast error diagnostics in neural weather models." pith.science (2026). https://pith.science/paper/INMSCECU
@misc{pith2026250611987,
  author       = {Pith},
  title        = {Pith review of: Forecast error diagnostics in neural weather models},
  year         = {2026},
  howpublished = {\url{https://pith.science/paper/INMSCECU}},
  note         = {Machine review of arXiv:2506.11987}
}
read the original abstract
Deep-learning (DL) weather prediction models offer some notable advantages over traditional physics-based models, including auto-differentiability and low computational cost, enabling detailed diagnostics of forecast errors. Using our convolutional encoder-decoder model, ConvCastNet, we systematically relax selected subdomains of the forecast fields towards "true" weather states (ERA5 reanalyses) and monitor the forecast skill gain in other regions. Our results show that a medium-range mid-latitude forecast improves substantially when the stratosphere and boundary layer are relaxed, while relaxation of the tropical atmosphere has a negligible effect. This underscores the need for a more accurate representation of the stratosphere and the planetary boundary layer to improve medium-range weather predictability. Additionally, we investigate the relationship between the forecast error sensitivity to initial conditions and relaxation experiments. By utilising auto-differentiability, we identify overlapping regions of large error sensitivity and strong forecast skill improvement from relaxation. Average mid-latitude error sensitivity to initial conditions shows negligible influence from the tropics, corroborating the results of the tropical relaxation experiments. The error sensitivity shows a physically consistent influence of upstream weather dynamics and sea surface temperatures on forecast accuracy. The latter also highlights the importance of accurately representing the atmosphere--ocean coupling in numerical weather prediction models. This combined approach could provide valuable heuristics for diagnosing neural model errors and guiding targeted model improvements.
Figures


Figures from the paper (10 more)




Reference graph
Works this paper leans on
-
[1]
M. Andrychowicz, L. Espeholt, D. Li, S. Merchant, A. Merose, F. Zyda, S. Agrawal, and N. Kalchbrenner. Deep learning for day forecasts from sparse observations, 2023. URL https://arxiv.org/abs/2306.06079
arXiv 2023
-
[2]
P. Bauer, A. Thorpe, and G. Brunet. The quiet revolution of numerical weather prediction. Nature, 525 0 (7567): 0 47--55, Sep 2015. ISSN 1476-4687. doi:10.1038/nature14956. URL https://doi.org/10.1038/nature14956
-
[3]
R. Bellman, B. Kashef, and R. Vasudevan. Dynamic programming and bicubic spline interpolation. Journal of Mathematical Analysis and Applications, 44 0 (1): 0 160--174, 1973. ISSN 0022-247X. doi:https://doi.org/10.1016/0022-247X(73)90033-4. URL https://www.sciencedirect.com/science/article/pii/0022247X73900334
arXiv 1973
-
[4]
K. Bi, L. Xie, H. Zhang, X. Chen, X. Gu, and Q. Tian. Accurate medium-range global weather forecasting with 3d neural networks. Nature, 619 0 (7970): 0 533--538, Jul 2023. ISSN 1476-4687. doi:10.1038/s41586-023-06185-3. URL https://doi.org/10.1038/s41586-023-06185-3
-
[5]
C. Bodnar, W. Bruinsma, A. Lucic, M. Stanley, J. Brandstetter, P. Garvan, M. Riechert, J. Weyn, H. Dong, A. Vaughan, J. Gupta, K. Thambiratnam, A. Archibald, E. Heider, M. Welling, R. Turner, and P. Perdikaris. Aurora: A foundation model of the atmosphere. Technical Report MSR-TR-2024-16, Microsoft Research AI for Science, May 2024. URL https://www.micros...
work page 2024
-
[6]
M. Bonavita. On some limitations of current machine learning weather prediction models. Geophysical Research Letters, 51 0 (12): 0 e2023GL107377, 2024. doi:https://doi.org/10.1029/2023GL107377. URL https://agupubs.onlinelibrary.wiley.com/doi/abs/10.1029/2023GL107377. e2023GL107377 2023GL107377
- [7]
-
[8]
L. Chen, X. Zhong, F. Zhang, Y. Cheng, Y. Xu, Y. Qi, and H. Li. Fuxi: a cascade machine learning forecasting system for 15-day global weather forecast. npj Climate and Atmospheric Science, 6 0 (1): 0 190, Nov 2023. ISSN 2397-3722. doi:10.1038/s41612-023-00512-1. URL https://doi.org/10.1038/s41612-023-00512-1
Show all 49 references
-
[9]
L. Chen, X. Zhong, H. Li, J. Wu, B. Lu, D. Chen, S.-P. Xie, L. Wu, Q. Chao, C. Lin, Z. Hu, and Y. Qi. A machine learning model that outperforms conventional global subseasonal forecast models. Nature Communications, 15 0 (1): 0 6425, Jul 2024. ISSN 2041-1723. doi:10.1038/s4146...
2024 doi
-
[10]
Cohen, D
J. Cohen, D. Coumou, J. Hwang, L. Mackey, P. Orenstein, S. Totz, and E. Tziperman. S2s reboot: An argument for greater inclusion of machine learning in subseasonal to seasonal forecasts. Wiley Interdisciplinary Reviews: Climate Change, 10: 0 e00567, 3 2019. ISSN 1757-7799. doi...
2019 doi
-
[11]
D. I. Domeisen, A. H. Butler, A. J. Charlton-Perez, B. Ayarzagüena, M. P. Baldwin, E. Dunn-Sigouin, J. C. Furtado, C. I. Garfinkel, P. Hitchcock, A. Y. Karpechko, H. Kim, J. Knight, A. L. Lang, E.-P. Lim, A. Marshall, G. Roff, C. Schwartz, I. R. Simpson, S.-W. Son, and M. Tagu...
2020
-
[12]
D. I. V. Domeisen, A. H. Butler, A. J. Charlton-Perez, B. Ayarzag \"u ena, M. P. Baldwin, E. Dunn-Sigouin, J. C. Furtado, C. I. Garfinkel, P. Hitchcock, A. Y. Karpechko, H. Kim, J. Knight, A. L. Lang, E.-P. Lim, A. Marshall, G. Roff, C. Schwartz, I. R. Simpson, S.-W. Son, and ...
2020
-
[13]
R. M. Errico. What is an adjoint model? Bulletin of the American Meteorological Society, 78 0 (11): 0 2577 -- 2592, 1997. doi:10.1175/1520-0477(1997)078<2577:WIAAM>2.0.CO;2. URL https://journals.ametsoc.org/view/journals/bams/78/11/1520-0477_1997_078_2577_wiaam_2_0_co_2.xml
1997 doi
-
[14]
A. E. Gill. Some simple solutions for heat-induced tropical circulation. Quarterly Journal of the Royal Meteorological Society, 106 0 (449): 0 447--462, 1980. doi:https://doi.org/10.1002/qj.49710644905. URL https://rmets.onlinelibrary.wiley.com/doi/abs/10.1002/qj.49710644905
1980 doi
-
[15]
Hersbach, B
H. Hersbach, B. Bell, P. Berrisford, S. Hirahara, A. Horányi, J. Muñoz-Sabater, J. Nicolas, C. Peubey, R. Radu, D. Schepers, A. Simmons, C. Soci, S. Abdalla, X. Abellan, G. Balsamo, P. Bechtold, G. Biavati, J. Bidlot, M. Bonavita, G. De Chiara, P. Dahlgren, D. Dee, M. Diamanta...
1999
-
[16]
Hersbach, B
H. Hersbach, B. Bell, P. Berrisford, G. Biavati, A. Horányi, J. Muñoz Sabater, J. Nicolas, C. Peubey, R. Radu, I. Rozum, D. Schepers, A. Simmons, C. Soci, D. Dee, and J.-N. Thépaut. Era5 hourly data on pressure levels from 1940 to present. Copernicus Climate Change Service (C3...
1940 doi
-
[17]
Hersbach, B
H. Hersbach, B. Bell, P. Berrisford, G. Biavati, A. Horányi, J. Muñoz Sabater, J. Nicolas, C. Peubey, R. Radu, I. Rozum, D. Schepers, A. Simmons, C. Soci, D. Dee, and J.-N. Thépaut. Era5 hourly data on single levels from 1940 to present. Copernicus Climate Change Service (C3S)...
1940 doi
-
[18]
S. Z. Husain, L. Separovic, J.-F. Caron, R. Aider, M. Buehner, S. Chamberland, E. Lapalme, R. McTaggart-Cowan, C. Subich, P. A. Vaillancourt, J. Yang, and A. Zadra. Leveraging data-driven weather models for improving numerical weather prediction skill through large-scale spect...
2024 arXiv
-
[19]
T. Jung, M. A. Kasper, T. Semmler, and S. Serrar. Arctic influence on subseasonal midlatitude prediction. Geophysical Research Letters, 41 0 (10): 0 3676--3680, 2014. doi:https://doi.org/10.1002/2014GL059961. URL https://agupubs.onlinelibrary.wiley.com/doi/abs/10.1002/2014GL059961
2014 doi
-
[20]
Kautz, I
L.-A. Kautz, I. Polichtchouk, T. Birner, H. Garny, and J. G. Pinto. Enhanced extended‐range predictability of the 2018 late‐winter eurasian cold spell due to the stratosphere. Q. J. R. Meteorol. Soc., 146 0 (727): 0 1040--1055, Jan. 2020
2018
-
[21]
R. Keisler. Forecasting global weather with graph neural networks, 2022. URL https://arxiv.org/abs/2202.07575
2022 arXiv
-
[22]
D. P. Kingma and J. Ba. Adam: A method for stochastic optimization, 2017. URL https://arxiv.org/abs/1412.6980
2017 arXiv
-
[23]
R. Lam, A. Sanchez-Gonzalez, M. Willson, P. Wirnsberger, M. Fortunato, F. Alet, S. Ravuri, T. Ewalds, Z. Eaton-Rosen, W. Hu, A. Merose, S. Hoyer, G. Holland, O. Vinyals, J. Stott, A. Pritzel, S. Mohamed, and P. Battaglia. Learning skillful medium-range global weather forecasti...
2023 doi
-
[24]
S. Lang, M. Alexe, M. Chantry, J. Dramsch, F. Pinault, B. Raoult, M. C. A. Clare, C. Lessig, M. Maier-Gerber, L. Magnusson, Z. B. Bouallègue, A. P. Nemesio, P. D. Dueben, A. Brown, F. Pappenberger, and F. Rabier. Aifs -- ecmwf's data-driven forecasting system, 2024. URL https:...
2024 arXiv
-
[25]
R. H. Langland. Issues in targeted observing. Quarterly Journal of the Royal Meteorological Society, 131 0 (613): 0 3409--3425, 2005. doi:https://doi.org/10.1256/qj.05.130. URL https://rmets.onlinelibrary.wiley.com/doi/abs/10.1256/qj.05.130
2005 doi
-
[26]
Magnusson
L. Magnusson. Diagnostic methods for understanding the origin of forecast errors. Quarterly Journal of the Royal Meteorological Society, 143 0 (706): 0 2129--2142, 2017. doi:https://doi.org/10.1002/qj.3072. URL https://rmets.onlinelibrary.wiley.com/doi/abs/10.1002/qj.3072
2017 doi
-
[27]
H. B. Mann and D. R. Whitney. On a Test of Whether one of Two Random Variables is Stochastically Larger than the Other . The Annals of Mathematical Statistics, 18 0 (1): 0 50 -- 60, 1947. doi:10.1214/aoms/1177730491. URL https://doi.org/10.1214/aoms/1177730491
1947
-
[28]
Hurricane ian overview, 2022
National Weather Service . Hurricane ian overview, 2022. URL https://www.weather.gov/mhx/HurricaneIan093022. Accessed: 2025-02-04
2022
-
[29]
Nguyen, J
T. Nguyen, J. Brandstetter, A. Kapoor, J. K. Gupta, and A. Grover. Climax: A foundation model for weather and climate, 2023. URL https://arxiv.org/abs/2301.10343
2023 arXiv
-
[30]
Pathak, S
J. Pathak, S. Subramanian, P. Harrington, S. Raja, A. Chattopadhyay, M. Mardani, T. Kurth, D. Hall, Z. Li, K. Azizzadenesheli, P. Hassanzadeh, K. Kashinath, and A. Anandkumar. Fourcastnet: A global data-driven high-resolution weather model using adaptive fourier neural operato...
2022 arXiv
-
[31]
L. M. Polvani and D. W. Waugh. Upward wave activity flux as a precursor to extreme stratospheric events and subsequent anomalous surface weather regimes. J. Clim., 17 0 (18): 0 3548--3554, Sept. 2004
2004
-
[32]
Price, A
I. Price, A. Sanchez-Gonzalez, F. Alet, T. R. Andersson, A. El-Kadi, D. Masters, T. Ewalds, J. Stott, S. Mohamed, P. Battaglia, R. Lam, and M. Willson. Probabilistic weather forecasting with machine learning. Nature, Dec 2024. ISSN 1476-4687. doi:10.1038/s41586-024-08252-9. UR...
2024 doi
-
[33]
J. F. Quinting and S. C. Jones. On the impact of tropical cyclones on rossby wave packets: A climatological perspective. Mon. Weather Rev., 144 0 (5): 0 2021--2048, May 2016
2021
-
[34]
Rasp and N
S. Rasp and N. Thuerey. Data-driven medium-range weather prediction with a resnet pretrained on climate simulations: A new model for weatherbench. Journal of Advances in Modeling Earth Systems, 13 0 (2): 0 e2020MS002405, 2021. doi:https://doi.org/10.1029/2020MS002405. URL http...
2021 doi
-
[35]
D. Ren, M. Lynch, L. M. Leslie, and J. Lemarshall. Sensitivity of tropical cyclone tracks and intensity to ocean surface temperature: Four cases in four different basins. Tellus A: Dynamic Meteorology and Oceanography, Dec 2014. doi:10.3402/tellusa.v66.24212
2014 doi
-
[36]
G. Roff, D. W. Thompson, and H. Hendon. Does increasing model stratospheric resolution improve extended-range forecast skill? Geophysical Research Letters, 38, 3 2011. ISSN 00948276. doi:10.1029/2010GL046515;WGROUP:STRING:PUBLICATION. URL /doi/pdf/10.1029/2010GL046515 https://...
2011 doi
-
[37]
Ronneberger, P
O. Ronneberger, P. Fischer, and T. Brox. U-net: Convolutional networks for biomedical image segmentation, 2015. URL https://arxiv.org/abs/1505.04597
2015 arXiv
-
[38]
SIfre and S
L. SIfre and S. Mallat. Rigid-motion scattering for texture classification. 03 2014
2014
-
[39]
Simonyan, A
K. Simonyan, A. Vedaldi, and A. Zisserman. Deep inside convolutional networks: Visualising image classification models and saliency maps, 2014. URL https://arxiv.org/abs/1312.6034
2014 arXiv
-
[40]
Subich, S
C. Subich, S. Z. Husain, L. Separovic, and J. Yang. Fixing the double penalty in data-driven weather forecasting through a modified spherical harmonic loss function, 2025. URL https://arxiv.org/abs/2501.19374
2025 arXiv
-
[41]
R. D. Torn and G. J. Hakim. Ensemble-based sensitivity analysis. Monthly Weather Review, 136 0 (2): 0 663 -- 677, 2008. doi:10.1175/2007MWR2132.1. URL https://journals.ametsoc.org/view/journals/mwre/136/2/2007mwr2132.1.xml
2008 doi
-
[42]
Venuti, F
F. Venuti, F. Rabier, E. Andersson, U. Modigliani, S. English, C. Kitchen, M. Berrone, D. Pinsault, J. Debrux, and M. Jarraud. Ecmwf’s societal impact through service provision, partnerships and collaborations. Journal of the European Meteorological Society, 2: 0 100013, 2025....
2025
-
[43]
P. T. Vonich and G. J. Hakim. Predictability limit of the 2021 pacific northwest heatwave from deep-learning sensitivity analysis. Geophysical Research Letters, 51 0 (19): 0 e2024GL110651, 2024. doi:https://doi.org/10.1029/2024GL110651. URL https://agupubs.onlinelibrary.wiley....
2021 doi
-
[44]
C. Wang, N. Žagar, and S. Vasylkevych. On the effects of the tropical initial state on extratropical forecasts: a scale perspective. Monthly Weather Review (accepted), 2025
2025
-
[45]
J. A. Weyn, D. R. Durran, and R. Caruana. Can machines learn to predict weather? using deep learning to predict gridded 500-hpa geopotential height from historical weather data. Journal of Advances in Modeling Earth Systems, 11 0 (8): 0 2680--2693, 2019. doi:https://doi.org/10...
2019 doi
-
[46]
J. A. Weyn, D. R. Durran, and R. Caruana. Improving data-driven global weather prediction using deep convolutional neural networks on a cubed sphere. Journal of Advances in Modeling Earth Systems, 12 0 (9): 0 e2020MS002109, 2020. doi:https://doi.org/10.1029/2020MS002109. URL h...
2020 doi
-
[47]
J. A. Weyn, D. R. Durran, R. Caruana, and N. Cresswell-Clay. Sub-seasonal forecasting with a large ensemble of deep-learning weather prediction models. Journal of Advances in Modeling Earth Systems, 13 0 (7): 0 e2021MS002502, 2021. doi:https://doi.org/10.1029/2021MS002502. URL...
2021 doi
-
[48]
Zhang, Z
C. Zhang, Z. P. Brodeur, S. Steinschneider, and J. D. Herman. Leveraging spatial patterns in precipitation forecasts using deep learning to support regional water management. Water Resources Research, 58 0 (9): 0 e2021WR031910, 2022. doi:https://doi.org/10.1029/2021WR031910. U...
2022 doi
-
[50]
Žagar, M
N. Žagar, M. Horvat, Žiga Zaplotnik, and L. M. and. Scale-dependent estimates of the growth of forecast uncertainties in a global prediction system. Tellus A: Dynamic Meteorology and Oceanography, 69 0 (1): 0 1287492, 2017. doi:10.1080/16000870.2017.1287492. URL https://doi.or...
2017
Reviewed August 7, 2026 · model on record in the stance chip above.
Discussion (0). Sign in to comment.